$549,900
Investment Summary
- Monthly Cash Flow
- -$962
- Cap Rate
- 4.0%
- Cash-on-Cash Return
- -9.1%
- Debt Coverage Ratio
- 0.66
- Internal Rate of Return (5 years)
- -4.8%
Cash Flow
Net Operating Income (NOI) minus mortgage payments.
Calculation:
NOI - Mortgage Payments
Cap Rate (Market Value)
Capitalization Rate is a rate of return that compares the yearly Net Operating Income (NOI) to the market value.
Calculation:
NOI / Market Value
Cash-on-Cash Return (CoC)
Annual Cash Flow / Cash Invested
Calculation:
Annual cash flow divided by initial cash invested.
Debt Coverage Ratio (DCR)
Net Operating Income (NOI) divided by total debt payments.
Calculation:
NOI / Total Debt Payments
Internal Rate of Return (IRR)
A metric for assessing profitability over time. IRR is the discount rate at which the net present value (NPV) of all future cash flows (positive and negative) from an investment equals zero — including both periodic cash flow (such as rent) and a projected sale at the end of the holding period. It represents the expected annualized return, accounting for income, expenses, and the recovery of capital through a future sale.
Property Description
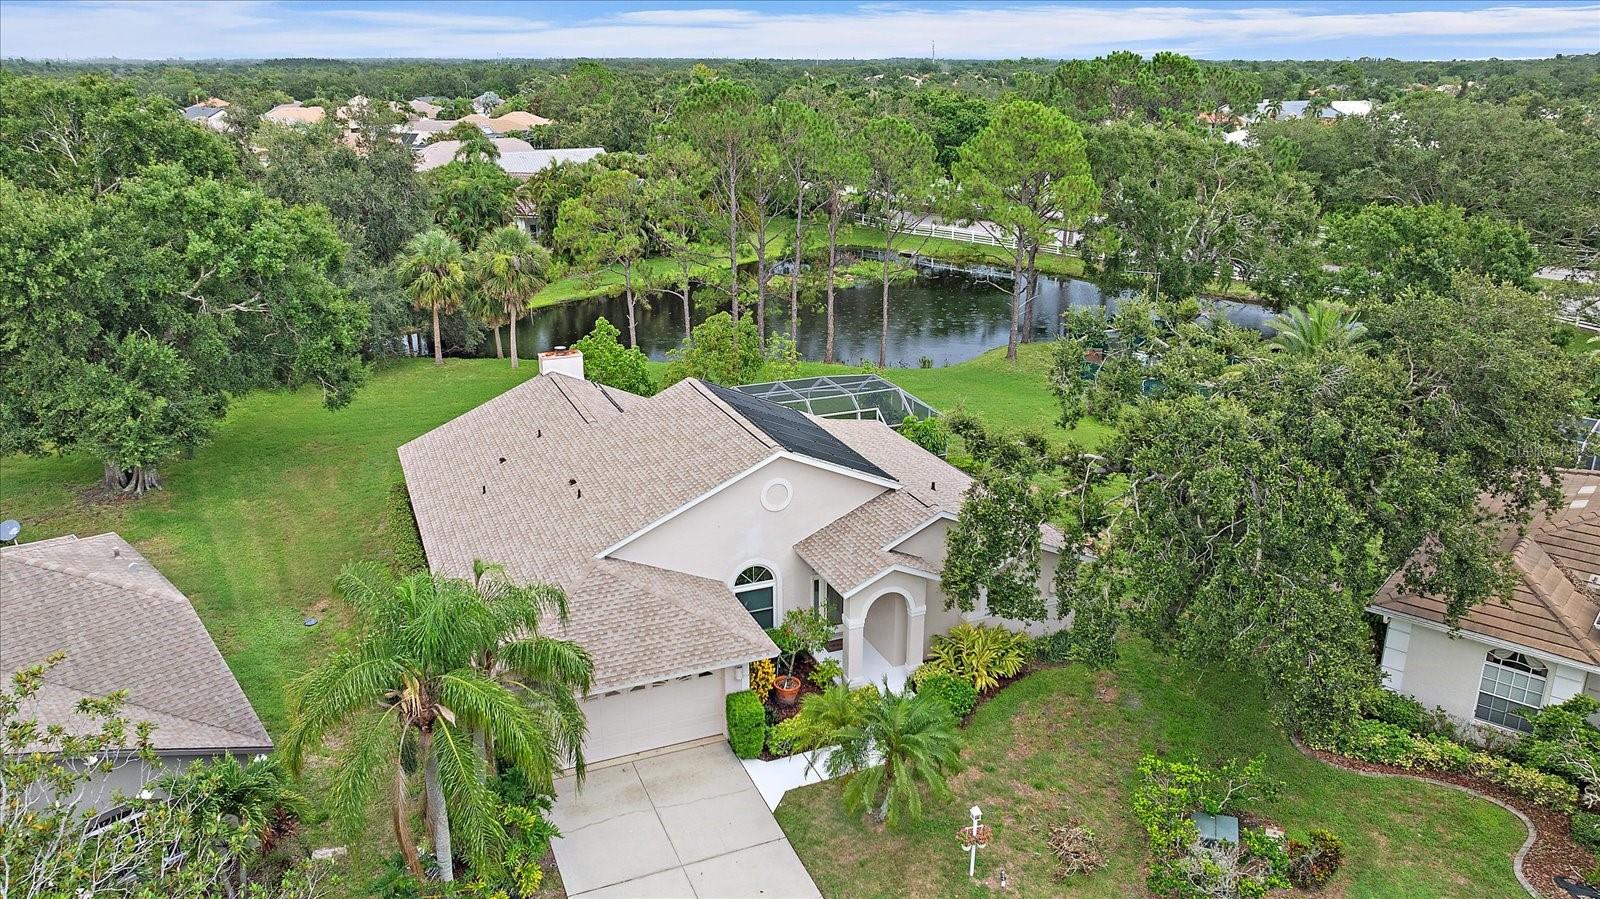
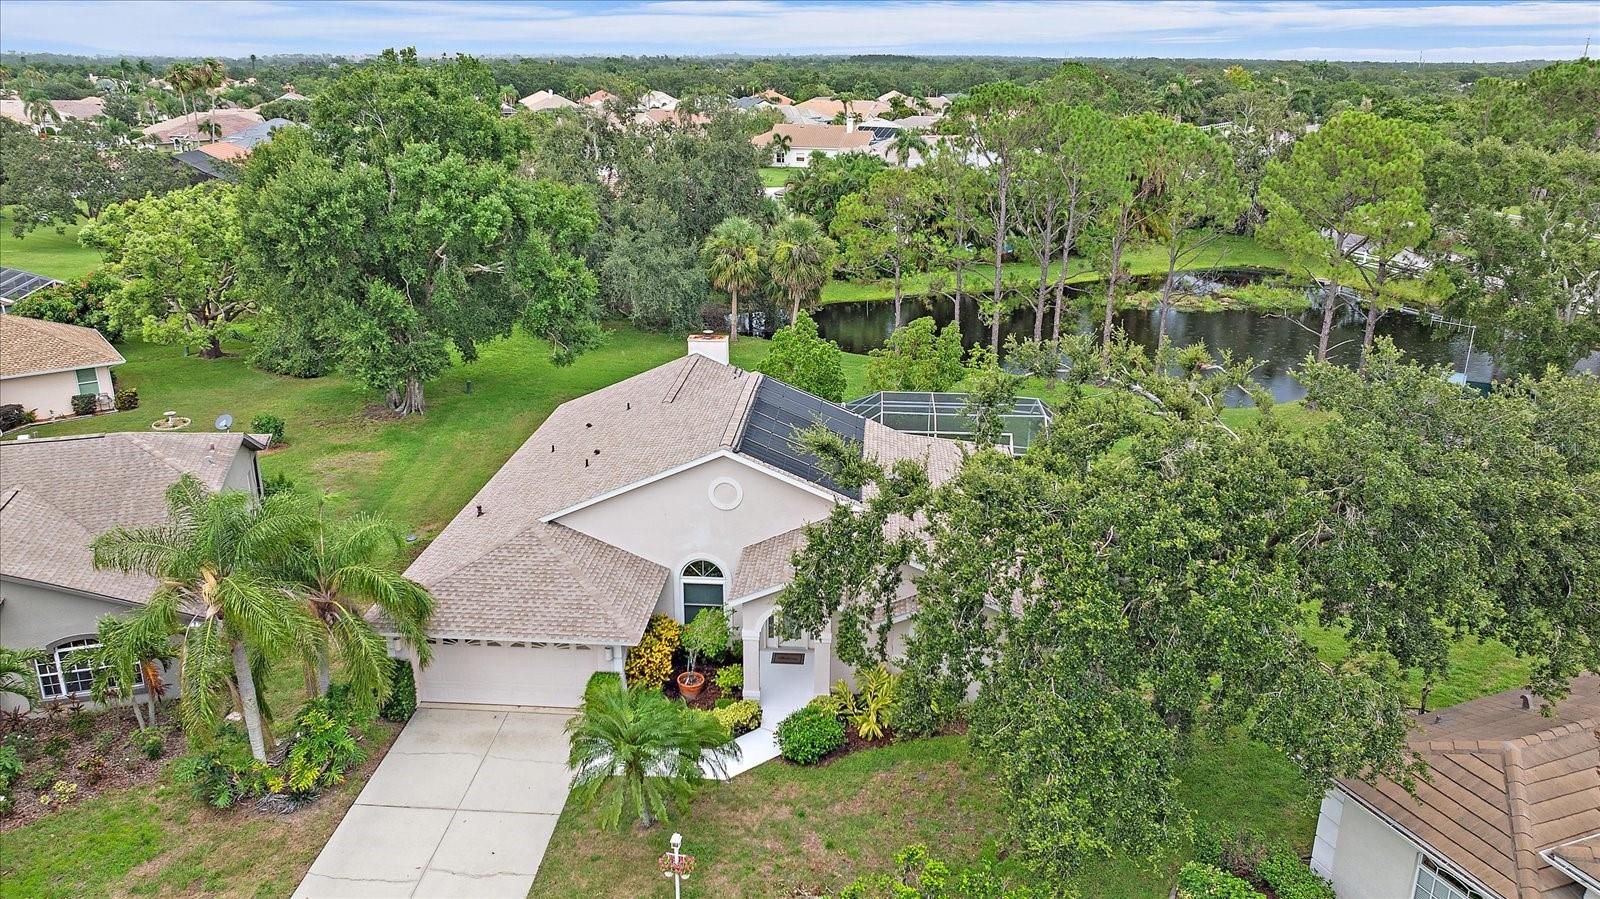
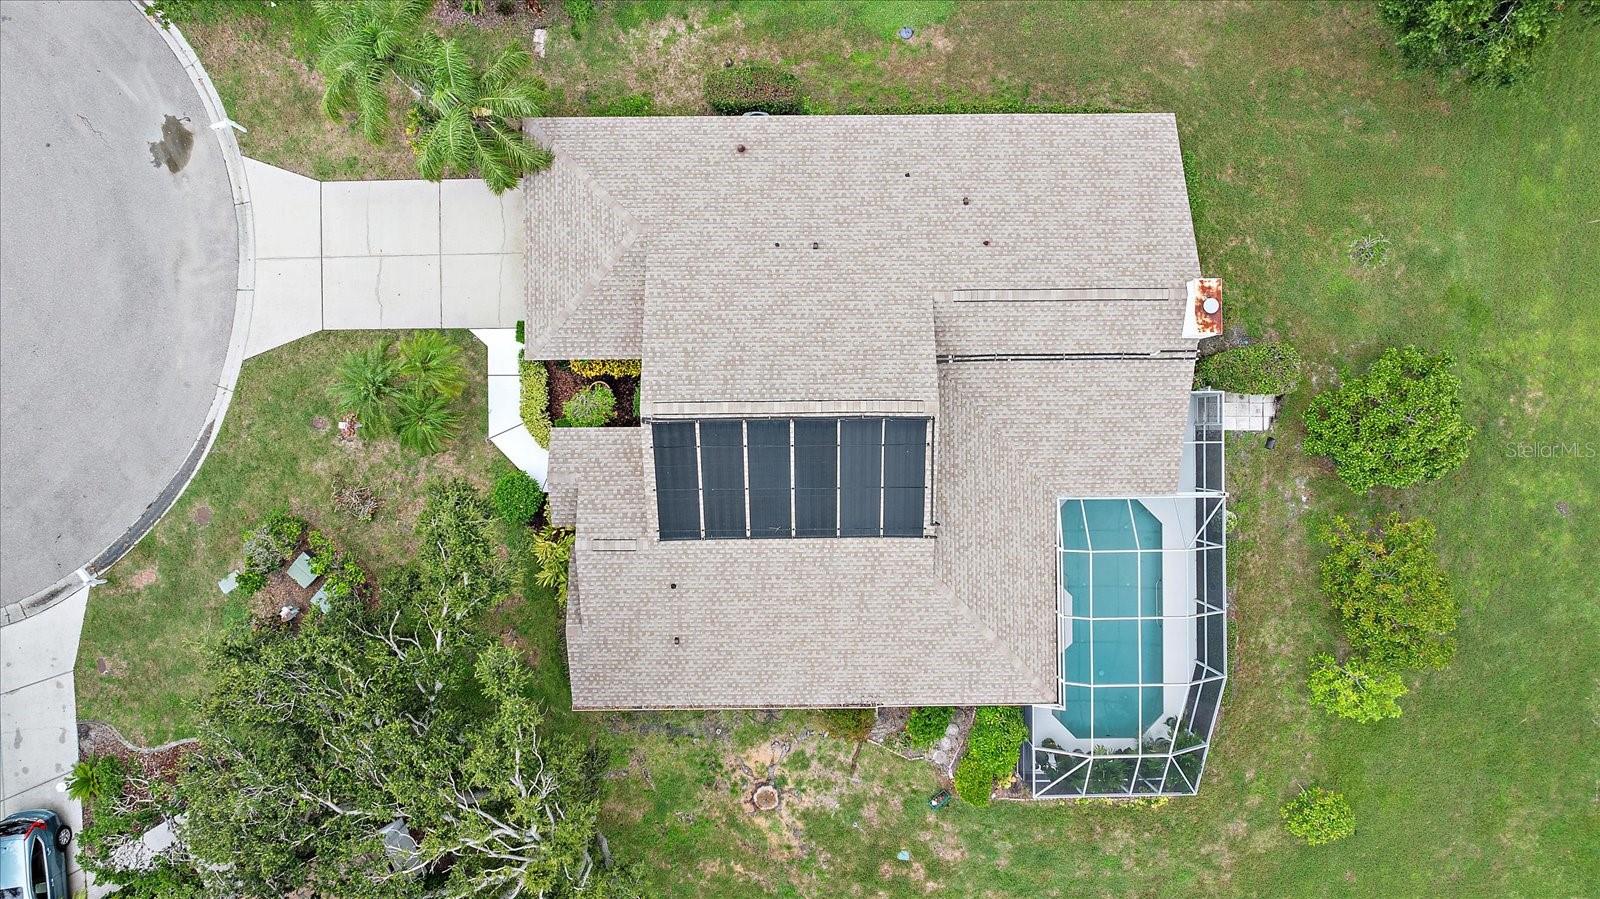
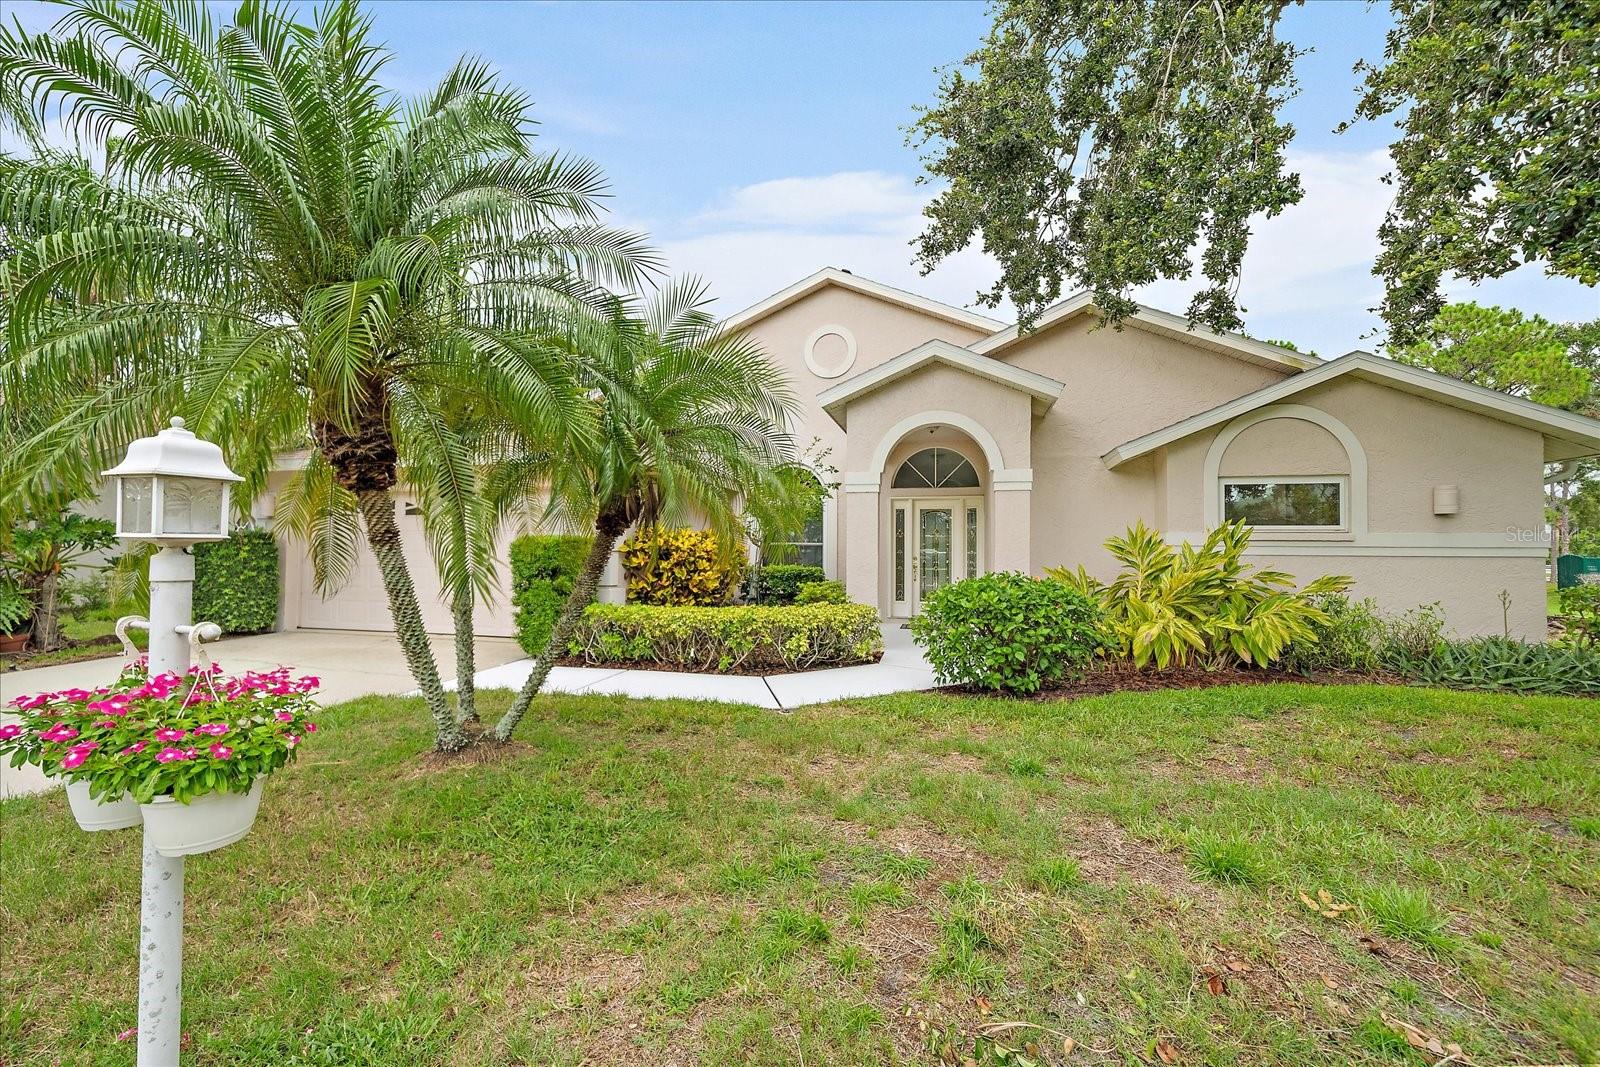
Welcome to this Florida HAVEN. Experience the best of FLORIDA LIVING in this stunning WATERFRONT POOL HOME located in the highly desirable MEADOWLAKE AT MOTE RANCH. This might be the best view in the neighborhood with WOODED TREES behind your PERFECT LAKEVIEW, all you see is NATURE! Plus it is a NON FLOOD ZONE EVACUATIONS E! Upon entering the home you are greeted with beautifully cared for MATURE FLORIDA LANDSCAPING setting the mood for this home. Enjoy peace of mind with HURRICANE IMPACT WINDOWS, a NEW ROOF (2023), HVAC (2021), and HOT WATER HEATER (2025). Step inside to find a light-filled, OPEN FLOOR PLAN featuring MULTIPLE SLIDING GLASS DOORS that fully pocket to reveal a SCREENED-IN LANAI POOL CAGE, SPACIOUS OUTDOOR PATIO, and SOLAR-HEATED POOL—all overlooking a TRANQUIL LAKE perfect for BIRD WATCHING and relaxing sunsets. Tucked away at the end of a QUIET CUL-DE-SAC, this home offers EXTRA PRIVACY with NO THROUGH TRAFFIC—perfect for peaceful living and added safety. And did a mention a TWO CAR ATTACHED GARAGE! The OPEN KITCHEN is a chef’s dream with PLENTY OF COUNTER SPACE and a RARELY FOUND GAS RANGE STOVE. Everyone knows food just taste better on a GAS STOVE. The SPLIT FLOOR PLAN offers privacy with a LARGE PRIMARY SUITE that boasts TWO WALK-IN CLOSETS and an OVERSIZED PRIMARY BATH complete with a STANDALONE SOAKING TUB and SEPARATE WALK-IN SHOWER. On the opposite side of the home, you’ll find TWO ADDITIONAL BEDROOMS and a LARGE GUEST BATHROOM. The spacious layout includes TWO LIVING AREAS, a COZY FIREPLACE, and flexible space for a FORMAL DINING ROOM, OFFICE, or FAMILY ROOM. VINYL LUXURY PLANK throughout the main living area and fresh BRAND NEW carpet in all the bedrooms. The interior features FRESHLY PAINTED WALLS in the PERFECT NEUTRAL TONES—bright and inviting, yet full of CHARACTER with TWO-TONE DETAILING. The lighter upper walls are complemented by a darker shade below, framed by ELEGANT TRIM WORK and GEOMETRIC PANELING that adds STYLE AND DIMENSION throughout. This home is just waiting for you to move in a RELAX. While enjoying WIDE WATER VIEWS from almost every room Take advantage of the exceptional COMMUNITY amenities including a LARGE COMMUNITY POOL, PRIVATE COMMUNITY DOCK, and KAYAK LAUNCH on the BRADEN RIVER—perfect for CANOEING, KAYAKING, and FISHING. The 4.8-ACRE of NATURE TRAILS offers SCENIC WALKING PATHS and LUSH GREENERY ideal for joggers, walkers, bikers and nature lovers. Conveniently located near UTC and an easy drive to SRQ AIRPORT, and I-75, this home is TRULY IN THE HEART OF IT ALL. Don’t miss this rare opportunity to own a beautifully maintained, MOVE-IN READY home with STUNNING WATER VIEWS, DIRECT ACCESS TO NATURE and THE FLORIDA LIFESTYLE you’ve been dreaming of!
Build Your Team
Quickly find investor-friendly professionals who can help you succeed in real estate investing at any stage of the investing journey.


Agents
Match with investor-friendly agents who can help you find, analyze, and close your next deal


Lenders
Get the best funding…find investor-friendly lenders who specialize in your deal strategy


Property Managers
Transition to passive investing. Find a trusted property management partnership that lasts.


Tax Pros & Accountants
Taxes and financial reporting made easy—find experts to create tax savings strategies, file taxes, and more
Location
Property Details
Parking
- Description: Attached Garage
- Details: Driveway, Attached
- Garage Spaces: 2
- Spaces Total: 0
Bedroom Information
- # of Bedrooms: 3
Bathroom Information
- # of Baths (Full): 2
- # of Baths (Total): 2.0
Interior Features
- # of Rooms: 7
- # of Stories: 1
- Fireplace: Yes
Exterior Features
- Exterior Walls Materials: Stucco
- Foundation: Slab
- Roof Type: Gable or Hip
- Roof Material: Shingle
- Pool: Yes
HOA
- Has HOA: Yes
- Association: Andrea Bull
- HOA Fee: $309/quarterly
Land Information
- Land Use: Residential
- Land Use Subtype: Single Family Residential
Lot Information
- Parcel ID: 19204.02508
- Lot Size: 10672 sqft
Property Information
- Property Type: Single Family Residence
- Year Built: 1991
Tax Information
- Annual Tax: $3,003
Utilities
- Water & Sewer: Public
- Heating: Central
- Cooling: Central Air
Location
- County: Manatee
Listing Details
Investment Summary
- Monthly Cash Flow
- -$962
- Cap Rate
- 4.0%
- Cash-on-Cash Return
- -9.1%
- Debt Coverage Ratio
- 0.66
- Internal Rate of Return (5 years)
- -4.8%
Cash Flow
Net Operating Income (NOI) minus mortgage payments.
Calculation:
NOI - Mortgage Payments
Cap Rate (Market Value)
Capitalization Rate is a rate of return that compares the yearly Net Operating Income (NOI) to the market value.
Calculation:
NOI / Market Value
Cash-on-Cash Return (CoC)
Annual Cash Flow / Cash Invested
Calculation:
Annual cash flow divided by initial cash invested.
Debt Coverage Ratio (DCR)
Net Operating Income (NOI) divided by total debt payments.
Calculation:
NOI / Total Debt Payments
Internal Rate of Return (IRR)
A metric for assessing profitability over time. IRR is the discount rate at which the net present value (NPV) of all future cash flows (positive and negative) from an investment equals zero — including both periodic cash flow (such as rent) and a projected sale at the end of the holding period. It represents the expected annualized return, accounting for income, expenses, and the recovery of capital through a future sale.
Purchase Details
Purchase PriceThe price paid for the property. Purchase price:
| $549,900 |
|---|---|
Amount FinancedThe amount of the purchase financed through a loan. Amount financed:
| -$439,920 |
Down paymentThe initial payment made towards the purchase. Down payment:
| $109,980 |
Closing CostsFees and expenses associated with purchasing a property, typically ranging from 2% to 5% of the home’s purchase price, paid at the end of a home purchase to cover services like lending, title transfer, and taxes. Closing costs:
| $16,497 |
Rehab CostsCosts incurred to repair or improve the property, including: roof, flooring, exterior siding, kitchen, exterior paint, bathrooms, etc. Rehab costs:
| $0 |
Initial Cash InvestedThe total initial cash invested in the property. Calculation:Down payment + Buying costs + Rehab costs Initial cash invested:
| $126,477 |
Square Feet (SQFT)The total square footage of the property. Square feet:
| 2,023 |
Cost Per Square FootCost per square foot of the property. Calculation:Purchase Price / Square Feet Cost per square foot:
| $272 |
Monthly Rent Per Square FootMonthly rent divided by the number of square feet. This ratio helps investors compare rental income efficiency across properties, markets, and unit sizes Calculation:Monthly Rent / Square Feet Monthly rent per square foot:
| $1.58 |
Financing Details
Loan AmountThe total sum of money borrowed from a lender to finance a property purchase. Calculation:Purchase Price - Down Payment
Loan amount:
| $439,920 |
|---|---|
Loan to Value Ratio (LTV)Loan amount divided by the market value of the property. Calculation:Loan Amount / Market Value
Loan to value ratio:
| 80.0% |
Loan TypeThe type of loan (e.g., fixed, adjustable).
Loan type:
| Amortizing |
TermThe loan repayment period in years.
Term:
| 30 years |
Interest RateThe percentage a lender charges on the borrowed amount of a loan, determining the cost of borrowing money.
Interest rate:
| 6.625% |
Principal & Interest (PI)The principal is the portion of the loan payment that reduces the loan balance. The interest is the lender's charge for borrowing money. Calculation:(P * r * (1 + r) ** n) / ((1 + r) ** n - 1) Where:
P = Loan amount (principal)
Principal & interest:
| $2,817 |
Property TaxesAnnual taxes levied by local governments on real estate properties. These taxes fund public services like schools, roads, and emergency services.
Property tax:
| $250 |
InsuranceThe costs for insurance coverage to protect against financial losses due to risks like fire, natural disasters, theft, liability, or tenant-related damages. Calculation:Assumes 7% of gross rental income, unless insurance rates are specified.
Insurance:
| $224 |
Private Mortgage Insurance (PMI)A fee that borrowers pay when they take out a conventional loan with a loan-to-value (LTV) ratio above 80%.
Private mortgage insurance (PMI):
| $0 |
Monthly PaymentThe fixed amount a borrower pays each month to repay a loan. It typically includes principal and interest (P&I) and may also cover property taxes, insurance, HOA fees, and PMI if escrowed. Monthly payment:
| $3,291 |
Operating Income
| % Rent | Monthly | Yearly | |
|---|---|---|---|
Gross RentThe total rental income received from tenants before deducting any expenses. Includes base rent, late fees, pet fees, parking fees, and other recurring charges.
Gross rent:
| $3,200 | $38,400 | |
Vacancy LossExpected loss of rent due to vacancies.
Vacancy loss:
(6%)
| 6% | -$192 | -$2,304 |
Operating IncomeGross rental income minus vacancy loss. Calculation:Gross rent - Vacancy loss
Operating income:
| $3,008 | $36,096 |
Operating Expenses
| % Rent | Monthly | Yearly | |
|---|---|---|---|
Property TaxesAnnual taxes levied by local governments on real estate properties. These taxes fund public services like schools, roads, and emergency services. | 8% | -$250 | -$3,003 |
InsuranceThe costs for insurance coverage to protect against financial losses due to risks like fire, natural disasters, theft, liability, or tenant-related damages. Calculation:Assumes 7% of gross rental income, unless insurance rates are specified. | 7% | -$224 | -$2,688 |
Property ManagementThe costs associated with hiring a property manager to handle the day-to-day operations of a rental property. Includes management fees, leasing fes, eviction fees, etc. Calculation:Assumes 8% of gross rental income. | 8% | -$256 | -$3,072 |
Repairs & MaintenanceOngoing costs for routine upkeep and minor fixes needed to keep a property in good working condition. Calculation:Assumes 5% of gross rental income. Varies by property age and condition. | 5% | -$160 | -$1,920 |
Capital ExpensesLarge, infrequent costs for major improvements or replacements, like a new roof, HVAC system, or appliances. Calculation:Assumes 5% of gross rental income. Varies by property age. | 5% | -$160 | -$1,920 |
HOA FeesRegular dues paid to a Homeowners Association for community maintenance, amenities, and management. Similar fees include: Condo Association Fees, Co-op Maintenance Fees, etc. | 3% | -$103 | -$1,236 |
Operating ExpensesRecurring costs required to maintain and manage a rental property, including property taxes, insurance, maintenance, repairs, utilities (if paid by the owner), property management fees, and other day-to-day expenses. Calculation:Insurance + Property Taxes + Property Management + Repairs & Maintenance + Capital Expenditures + HOA Fees | 36% | -$1,153 | -$13,839 |
Cash Flow
| Monthly | Yearly | |
|---|---|---|
Net Operating Income (NOI)The income generated from a property after deducting all operating expenses but before deducting mortgage payments, taxes, and capital expenditures. Calculation:Gross Operating Income - Operating Expenses
Net operating income:
| $1,855 | $22,260 |
Mortgage PaymentThe fixed amount a borrower pays each month to repay a loan. It typically includes principal and interest (P&I) and may also cover property taxes, insurance, HOA fees, and PMI if escrowed. | -$2,817 | -$33,804 |
Cash FlowNet Operating Income (NOI) minus mortgage payments. Calculation:NOI - Mortgage Payments | -$962 | -$11,544 |