$435,000
Investment Summary
- Monthly Cash Flow
- -$417
- Cap Rate
- 5.0%
- Cash-on-Cash Return
- -5.0%
- Debt Coverage Ratio
- 0.81
- Internal Rate of Return (5 years)
- -0.9%
Cash Flow
Net Operating Income (NOI) minus mortgage payments.
Calculation:
NOI - Mortgage Payments
Cap Rate (Market Value)
Capitalization Rate is a rate of return that compares the yearly Net Operating Income (NOI) to the market value.
Calculation:
NOI / Market Value
Cash-on-Cash Return (CoC)
Annual Cash Flow / Cash Invested
Calculation:
Annual cash flow divided by initial cash invested.
Debt Coverage Ratio (DCR)
Net Operating Income (NOI) divided by total debt payments.
Calculation:
NOI / Total Debt Payments
Internal Rate of Return (IRR)
A metric for assessing profitability over time. IRR is the discount rate at which the net present value (NPV) of all future cash flows (positive and negative) from an investment equals zero — including both periodic cash flow (such as rent) and a projected sale at the end of the holding period. It represents the expected annualized return, accounting for income, expenses, and the recovery of capital through a future sale.
Property Description
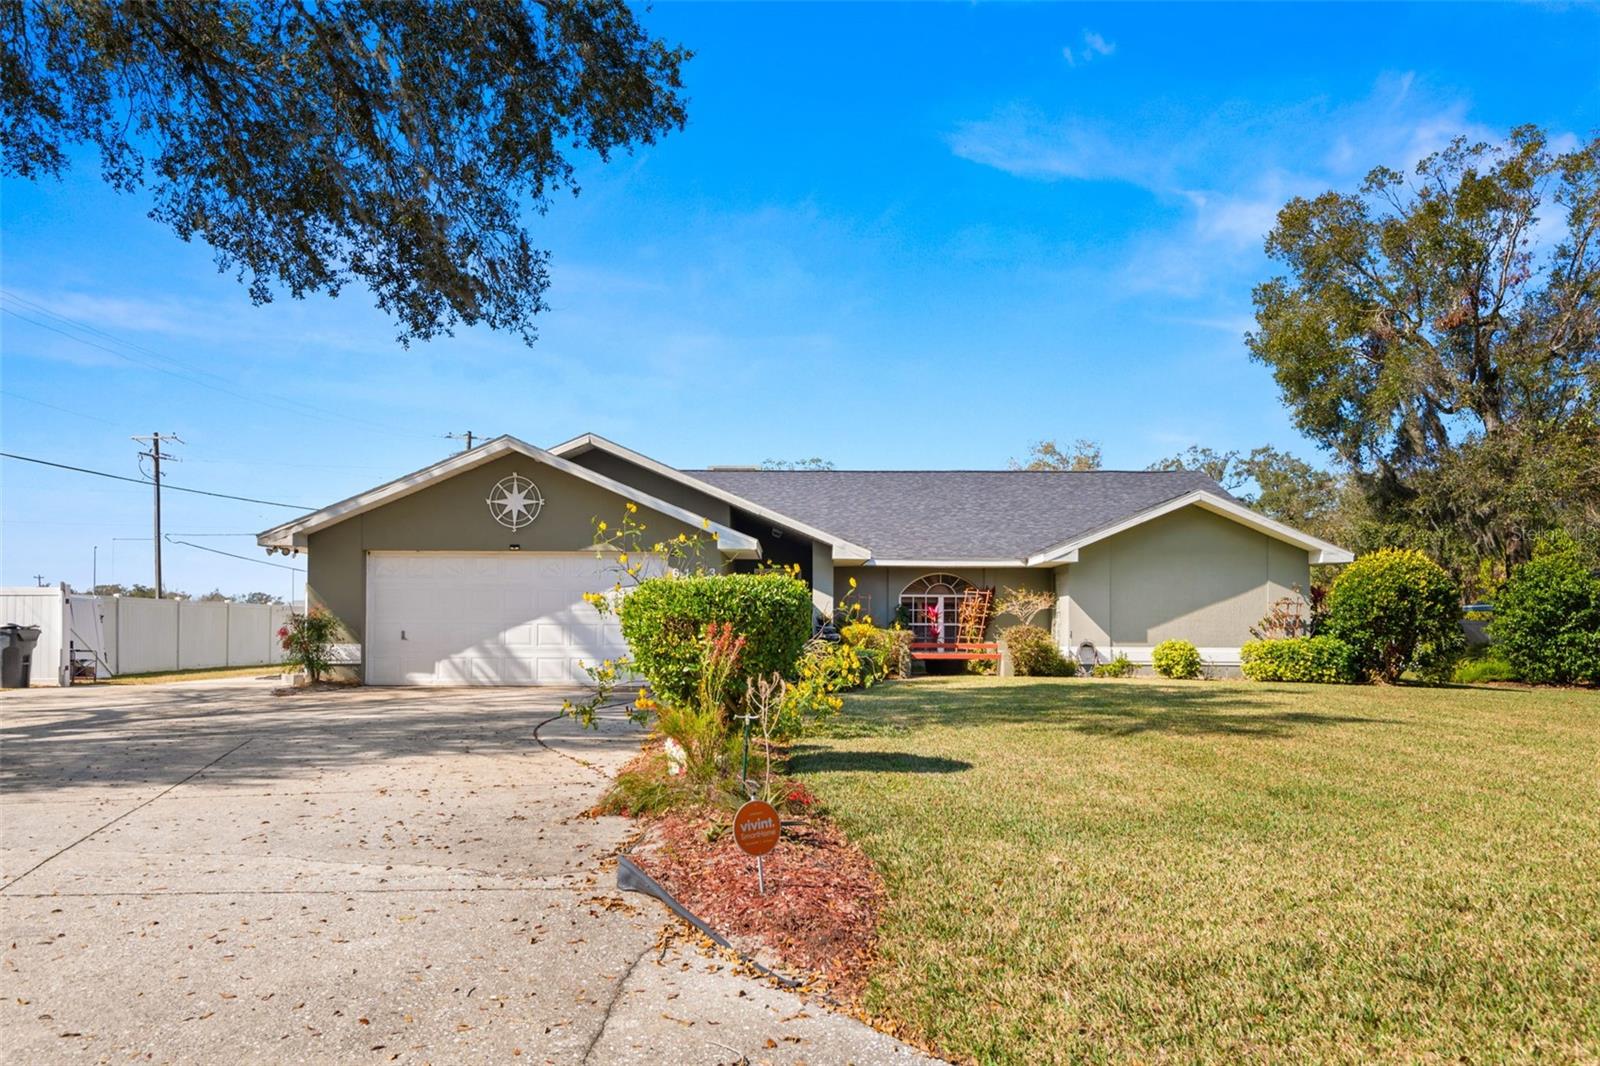
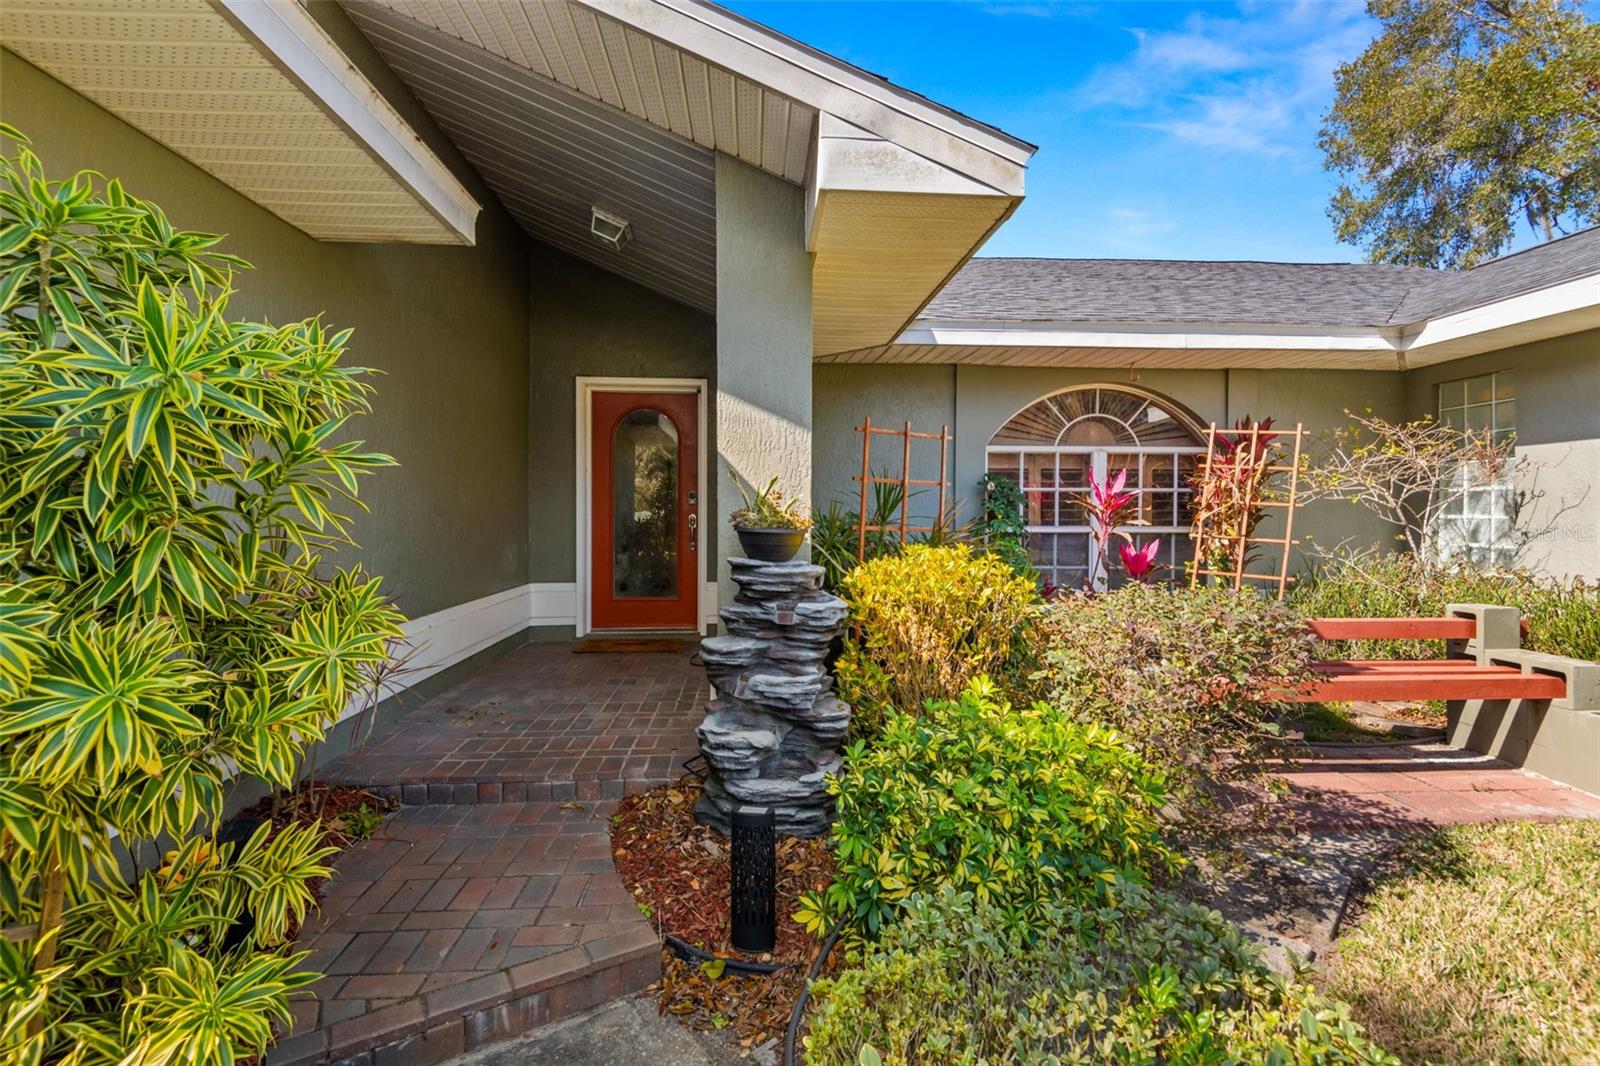
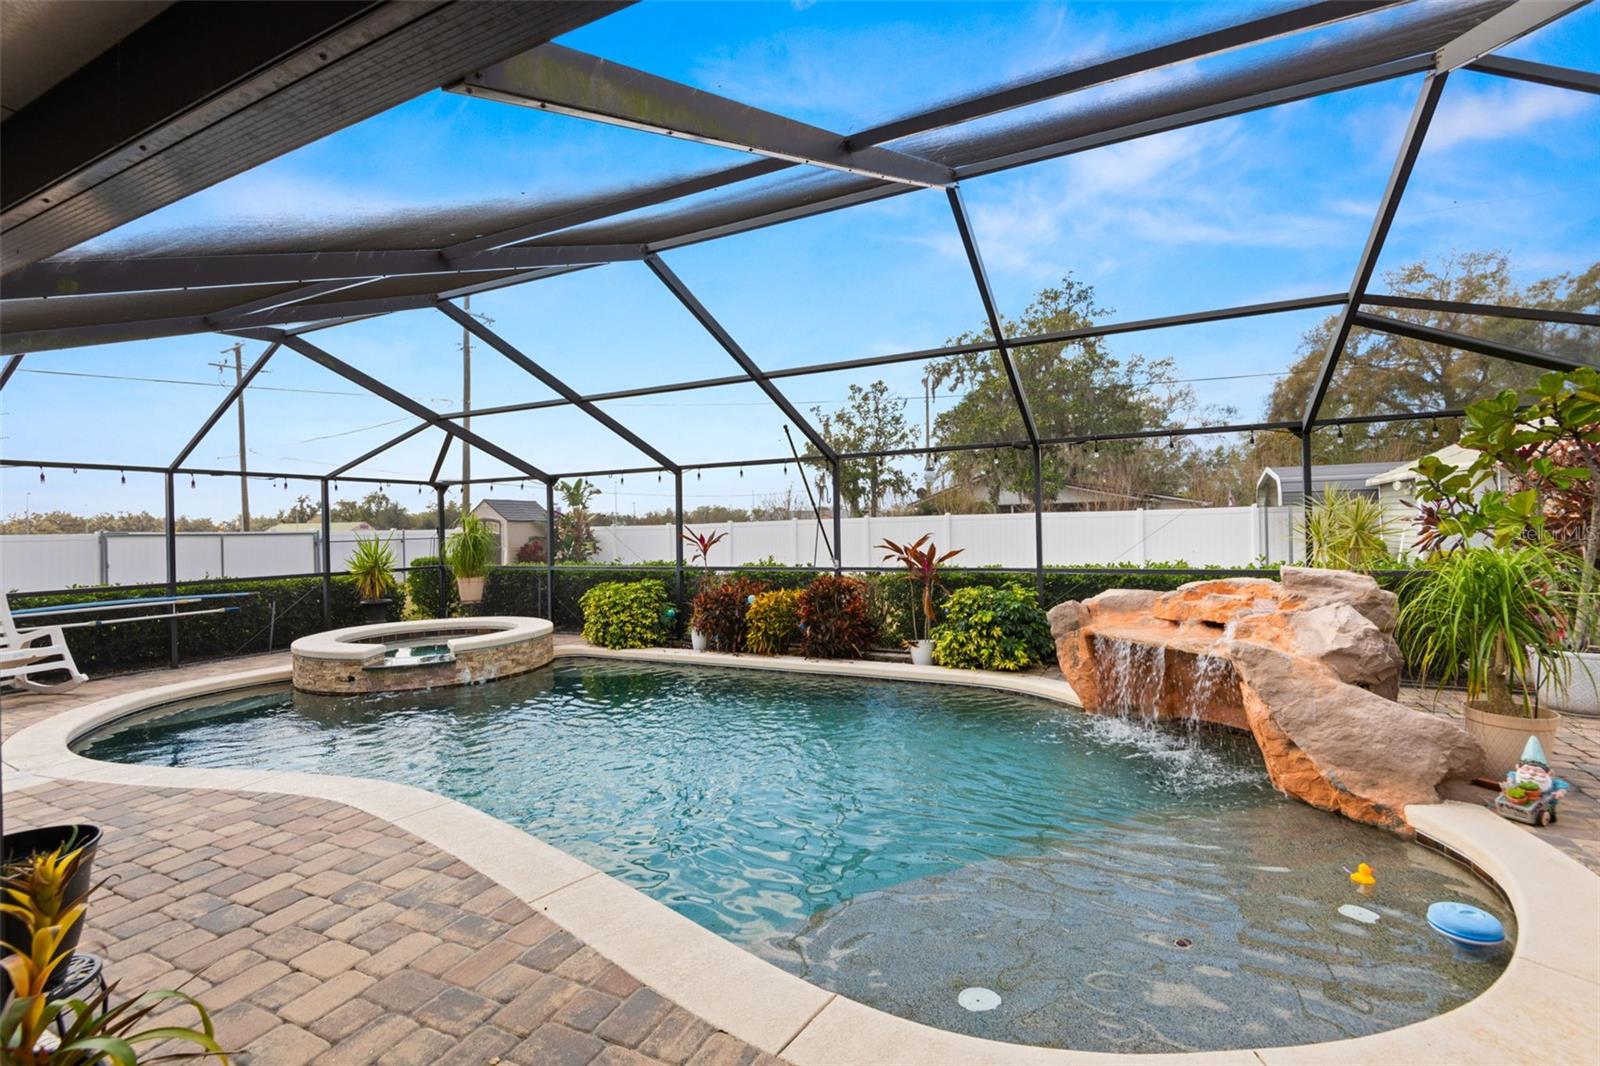
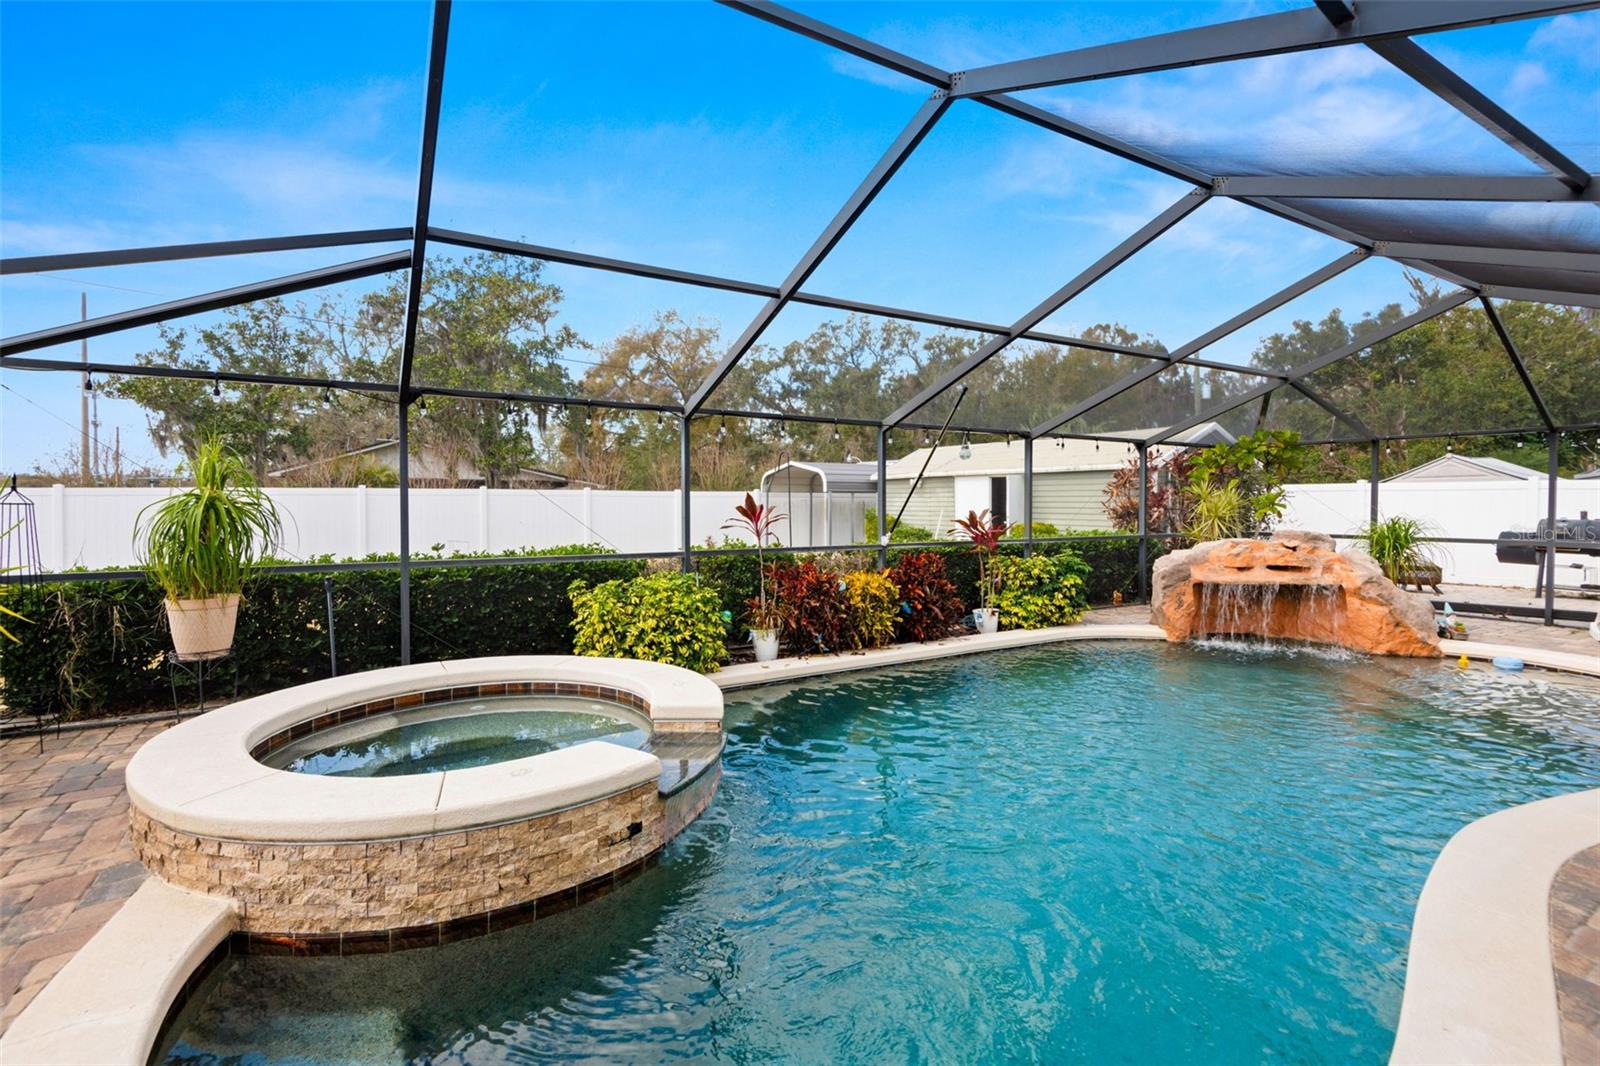
Multple Offers**Highest & Best** By Noon Monday October 13th. Listed BELOW APPRAISED VALUE! Sellers are ready to MOVE! Sitting between Tampa and Orlando, this Lakeland / Bartow area home offers the best of everything for your #FloridaLife. Private 17,000+ square foot FENCED lot with BOAT parking and a detached WORKSHOP space is home to a large, welcoming 3 bedroom, 2 FULL bathroom home complete with an attached 2 car garage (tons of STORAGE) and offers a breathtaking RESORT STYLE POOL, with HEATED SPA and relaxing WATER FALL feature. Garage is a generous space for TWO cars PLUS storage. The workshop is 10’ x 24’ with electricity. This rare opportunity comes with ADDITIONAL PARKING, plus covered parking for your BOAT or jet ski. Stepping inside, this home hits that much sought-after sweet spot. Exactly the right amount of space to live, love and laugh. Open and light-filled, with cathedral ceilings and an abundance of storage space. Finally, a place for everything! Open kitchen with breakfast bar makes for easy entertaining. All stainless steel appliances. Split plan 3/2 with enclosed Florida room and a flex space, perfect for your new home office, or maybe an oversized walk-in pantry? Formal dining area, living room, family room and a fireplace. This home has it all - and then some! Newer appliances, with a 2024 stainless refrigerator. Zoned climate comfort delivered by two Trane HVAC units, new in 2021. Power outage? No problem...your new home is hardwired to allow an easy conversion to run by generator - generator included! Architectural shingle ROOF 2021. Yard is fully fenced. Salt water pool is heated by dedicated solar panels. Irrigation is via your own deep water well. The Waterwood neighborhood offers a private TENNIS & BASKETBALL COURT for residents. Life is sweeter here, but you'll see that Waterwood is far from "cookie-cutter". This home is located in an “X” flood zone and sits on almost half an acre yet it’s just minutes away from all the conveniences we have come to expect. Publix is 5 minutes away AND a it’s a 5 minute ride to the boat ramp at Lake Hancock. POLK STATE COLLEGE is a 6 miniute drive. The Fort Fraser Trail is steps away and is a multi-use 7/75 mile trail offering picnic shelters and three trestle bridges and a connector to Circle B Bar Reserve & Polk's Nature Discovery Center. If you are looking for a more “themed” adventure, Disney is just 50 miles away. Looking to getaway? You’ll be 12 miles from Lakeland Linder International Airport. *City of Lakeland Water and Bartow's sweet, laid back vibe. A serene oasis which lets you forget about the hustle and bustle of the daily grind, and still allows you to jump back on major thoroughfares in a matter of minutes, this home is everything.
Build Your Team
Quickly find investor-friendly professionals who can help you succeed in real estate investing at any stage of the investing journey.


Agents
Match with investor-friendly agents who can help you find, analyze, and close your next deal


Lenders
Get the best funding…find investor-friendly lenders who specialize in your deal strategy


Property Managers
Transition to passive investing. Find a trusted property management partnership that lasts.


Tax Pros & Accountants
Taxes and financial reporting made easy—find experts to create tax savings strategies, file taxes, and more
Location
Property Details
Parking
- Description: Driveway, Off Street
- Details: Driveway, Off Street, Attached
- Garage Spaces: 2
- Spaces Total: 0
Bedroom Information
- # of Bedrooms: 3
Bathroom Information
- # of Baths (Full): 2
- # of Baths (Total): 2.0
Interior Features
- # of Rooms: 3
- # of Stories: 1
- Fireplace: Yes
Exterior Features
- Exterior Walls Materials: Stucco
- Foundation: Slab
- Roof Type: Gable
- Roof Material: Shingle
- Pool: Yes
HOA
- Has HOA: Yes
- Association: Waterwood II
- HOA Fee: $250/annually
Land Information
- Land Use: Residential
- Land Use Subtype: Single Family Residential
Lot Information
- Parcel ID: 242913282020000840
- Lot Size: 17346 sqft
Property Information
- Property Type: Single Family Residence
- Year Built: 1990
Tax Information
- Annual Tax: $4,505
Utilities
- Water & Sewer: Public
- Heating: Central
- Cooling: Central Air, Zoned
Location
- County: Polk
Listing Details
Investment Summary
- Monthly Cash Flow
- -$417
- Cap Rate
- 5.0%
- Cash-on-Cash Return
- -5.0%
- Debt Coverage Ratio
- 0.81
- Internal Rate of Return (5 years)
- -0.9%
Cash Flow
Net Operating Income (NOI) minus mortgage payments.
Calculation:
NOI - Mortgage Payments
Cap Rate (Market Value)
Capitalization Rate is a rate of return that compares the yearly Net Operating Income (NOI) to the market value.
Calculation:
NOI / Market Value
Cash-on-Cash Return (CoC)
Annual Cash Flow / Cash Invested
Calculation:
Annual cash flow divided by initial cash invested.
Debt Coverage Ratio (DCR)
Net Operating Income (NOI) divided by total debt payments.
Calculation:
NOI / Total Debt Payments
Internal Rate of Return (IRR)
A metric for assessing profitability over time. IRR is the discount rate at which the net present value (NPV) of all future cash flows (positive and negative) from an investment equals zero — including both periodic cash flow (such as rent) and a projected sale at the end of the holding period. It represents the expected annualized return, accounting for income, expenses, and the recovery of capital through a future sale.
Purchase Details
Purchase PriceThe price paid for the property. Purchase price:
| $435,000 |
|---|---|
Amount FinancedThe amount of the purchase financed through a loan. Amount financed:
| -$348,000 |
Down paymentThe initial payment made towards the purchase. Down payment:
| $87,000 |
Closing CostsFees and expenses associated with purchasing a property, typically ranging from 2% to 5% of the home’s purchase price, paid at the end of a home purchase to cover services like lending, title transfer, and taxes. Closing costs:
| $13,050 |
Rehab CostsCosts incurred to repair or improve the property, including: roof, flooring, exterior siding, kitchen, exterior paint, bathrooms, etc. Rehab costs:
| $0 |
Initial Cash InvestedThe total initial cash invested in the property. Calculation:Down payment + Buying costs + Rehab costs Initial cash invested:
| $100,050 |
Square Feet (SQFT)The total square footage of the property. Square feet:
| 2,583 |
Cost Per Square FootCost per square foot of the property. Calculation:Purchase Price / Square Feet Cost per square foot:
| $168 |
Monthly Rent Per Square FootMonthly rent divided by the number of square feet. This ratio helps investors compare rental income efficiency across properties, markets, and unit sizes Calculation:Monthly Rent / Square Feet Monthly rent per square foot:
| $1.24 |
Financing Details
Loan AmountThe total sum of money borrowed from a lender to finance a property purchase. Calculation:Purchase Price - Down Payment
Loan amount:
| $348,000 |
|---|---|
Loan to Value Ratio (LTV)Loan amount divided by the market value of the property. Calculation:Loan Amount / Market Value
Loan to value ratio:
| 80.0% |
Loan TypeThe type of loan (e.g., fixed, adjustable).
Loan type:
| Amortizing |
TermThe loan repayment period in years.
Term:
| 30 years |
Interest RateThe percentage a lender charges on the borrowed amount of a loan, determining the cost of borrowing money.
Interest rate:
| 6.625% |
Principal & Interest (PI)The principal is the portion of the loan payment that reduces the loan balance. The interest is the lender's charge for borrowing money. Calculation:(P * r * (1 + r) ** n) / ((1 + r) ** n - 1) Where:
P = Loan amount (principal)
Principal & interest:
| $2,228 |
Property TaxesAnnual taxes levied by local governments on real estate properties. These taxes fund public services like schools, roads, and emergency services.
Property tax:
| $376 |
InsuranceThe costs for insurance coverage to protect against financial losses due to risks like fire, natural disasters, theft, liability, or tenant-related damages. Calculation:Assumes 7% of gross rental income, unless insurance rates are specified.
Insurance:
| $224 |
Private Mortgage Insurance (PMI)A fee that borrowers pay when they take out a conventional loan with a loan-to-value (LTV) ratio above 80%.
Private mortgage insurance (PMI):
| $0 |
Monthly PaymentThe fixed amount a borrower pays each month to repay a loan. It typically includes principal and interest (P&I) and may also cover property taxes, insurance, HOA fees, and PMI if escrowed. Monthly payment:
| $2,828 |
Operating Income
| % Rent | Monthly | Yearly | |
|---|---|---|---|
Gross RentThe total rental income received from tenants before deducting any expenses. Includes base rent, late fees, pet fees, parking fees, and other recurring charges.
Gross rent:
| $3,200 | $38,400 | |
Vacancy LossExpected loss of rent due to vacancies.
Vacancy loss:
(6%)
| 6% | -$192 | -$2,304 |
Operating IncomeGross rental income minus vacancy loss. Calculation:Gross rent - Vacancy loss
Operating income:
| $3,008 | $36,096 |
Operating Expenses
| % Rent | Monthly | Yearly | |
|---|---|---|---|
Property TaxesAnnual taxes levied by local governments on real estate properties. These taxes fund public services like schools, roads, and emergency services. | 12% | -$376 | -$4,506 |
InsuranceThe costs for insurance coverage to protect against financial losses due to risks like fire, natural disasters, theft, liability, or tenant-related damages. Calculation:Assumes 7% of gross rental income, unless insurance rates are specified. | 7% | -$224 | -$2,688 |
Property ManagementThe costs associated with hiring a property manager to handle the day-to-day operations of a rental property. Includes management fees, leasing fes, eviction fees, etc. Calculation:Assumes 8% of gross rental income. | 8% | -$256 | -$3,072 |
Repairs & MaintenanceOngoing costs for routine upkeep and minor fixes needed to keep a property in good working condition. Calculation:Assumes 5% of gross rental income. Varies by property age and condition. | 5% | -$160 | -$1,920 |
Capital ExpensesLarge, infrequent costs for major improvements or replacements, like a new roof, HVAC system, or appliances. Calculation:Assumes 5% of gross rental income. Varies by property age. | 5% | -$160 | -$1,920 |
HOA FeesRegular dues paid to a Homeowners Association for community maintenance, amenities, and management. Similar fees include: Condo Association Fees, Co-op Maintenance Fees, etc. | 1% | -$21 | -$252 |
Operating ExpensesRecurring costs required to maintain and manage a rental property, including property taxes, insurance, maintenance, repairs, utilities (if paid by the owner), property management fees, and other day-to-day expenses. Calculation:Insurance + Property Taxes + Property Management + Repairs & Maintenance + Capital Expenditures + HOA Fees | 37% | -$1,197 | -$14,358 |
Cash Flow
| Monthly | Yearly | |
|---|---|---|
Net Operating Income (NOI)The income generated from a property after deducting all operating expenses but before deducting mortgage payments, taxes, and capital expenditures. Calculation:Gross Operating Income - Operating Expenses
Net operating income:
| $1,811 | $21,732 |
Mortgage PaymentThe fixed amount a borrower pays each month to repay a loan. It typically includes principal and interest (P&I) and may also cover property taxes, insurance, HOA fees, and PMI if escrowed. | -$2,228 | -$26,736 |
Cash FlowNet Operating Income (NOI) minus mortgage payments. Calculation:NOI - Mortgage Payments | -$417 | -$5,004 |