
$645,000
Investment Summary
- Monthly Cash Flow
- -$1,402
- Cap Rate
- 3.5%
- Cash-on-Cash Return
- -11.3%
- Debt Coverage Ratio
- 0.58
- Internal Rate of Return (5 years)
- -7.0%
Cash Flow
Net Operating Income (NOI) minus mortgage payments.
Calculation:
NOI - Mortgage Payments
Cap Rate (Market Value)
Capitalization Rate is a rate of return that compares the yearly Net Operating Income (NOI) to the market value.
Calculation:
NOI / Market Value
Cash-on-Cash Return (CoC)
Annual Cash Flow / Cash Invested
Calculation:
Annual cash flow divided by initial cash invested.
Debt Coverage Ratio (DCR)
Net Operating Income (NOI) divided by total debt payments.
Calculation:
NOI / Total Debt Payments
Internal Rate of Return (IRR)
A metric for assessing profitability over time. IRR is the discount rate at which the net present value (NPV) of all future cash flows (positive and negative) from an investment equals zero — including both periodic cash flow (such as rent) and a projected sale at the end of the holding period. It represents the expected annualized return, accounting for income, expenses, and the recovery of capital through a future sale.
Property Description
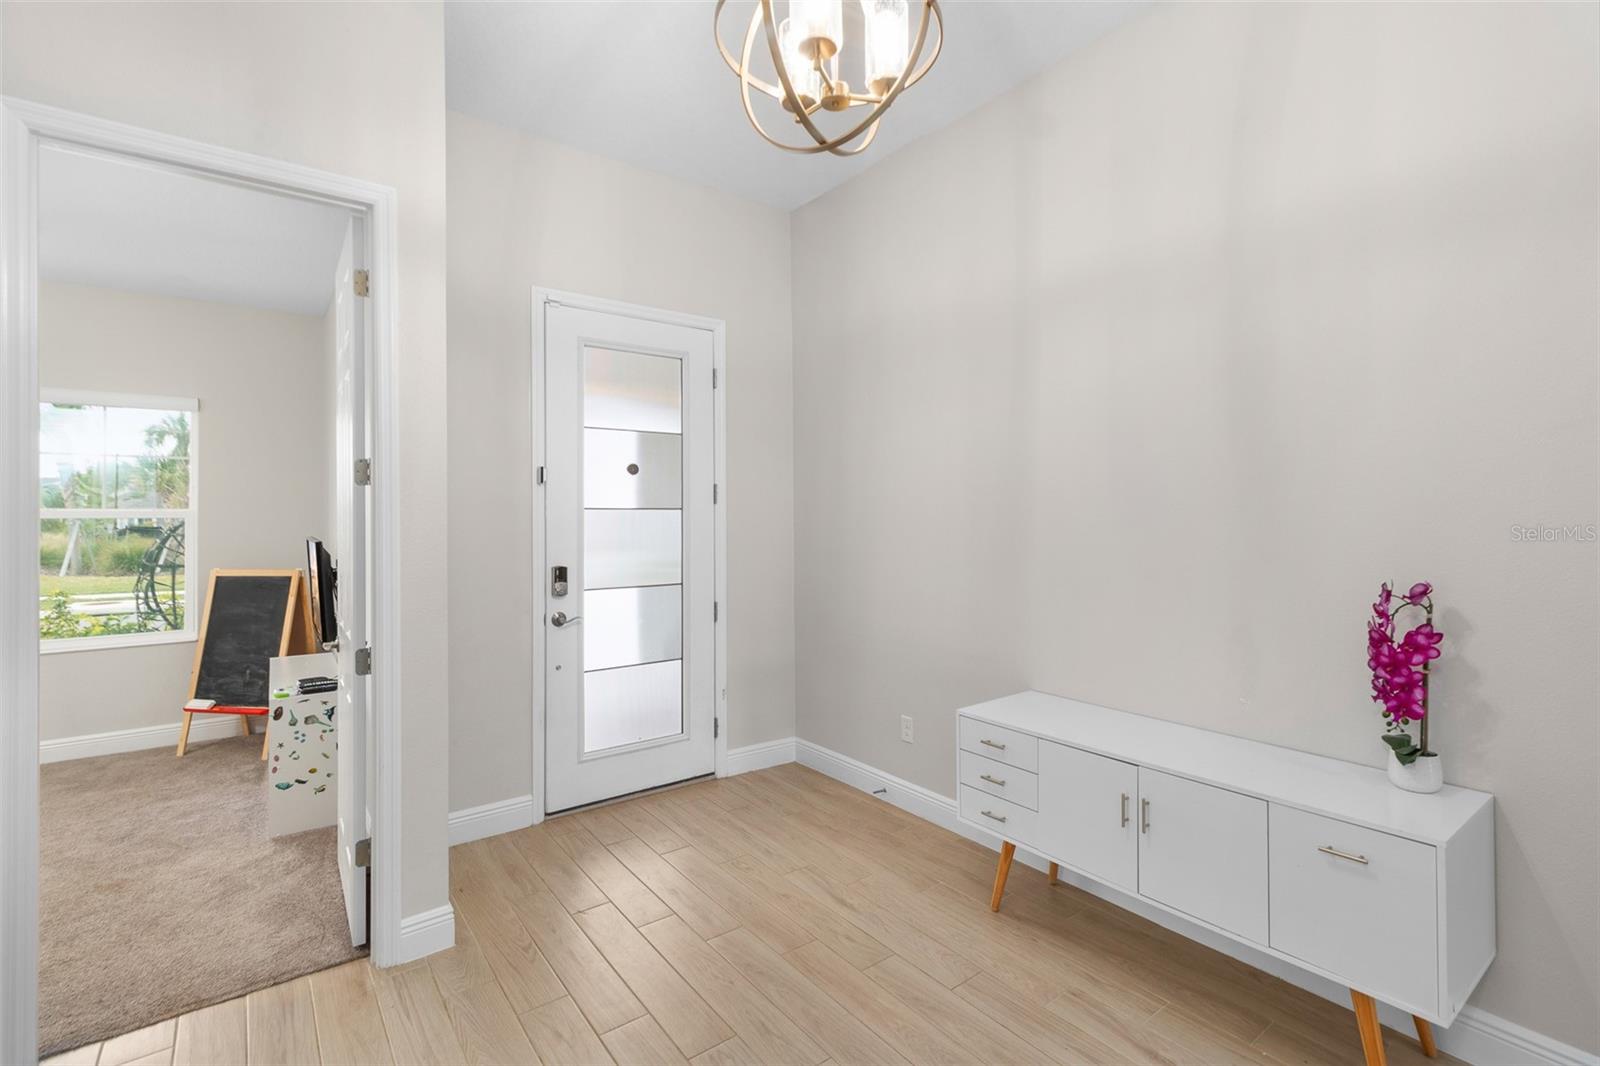
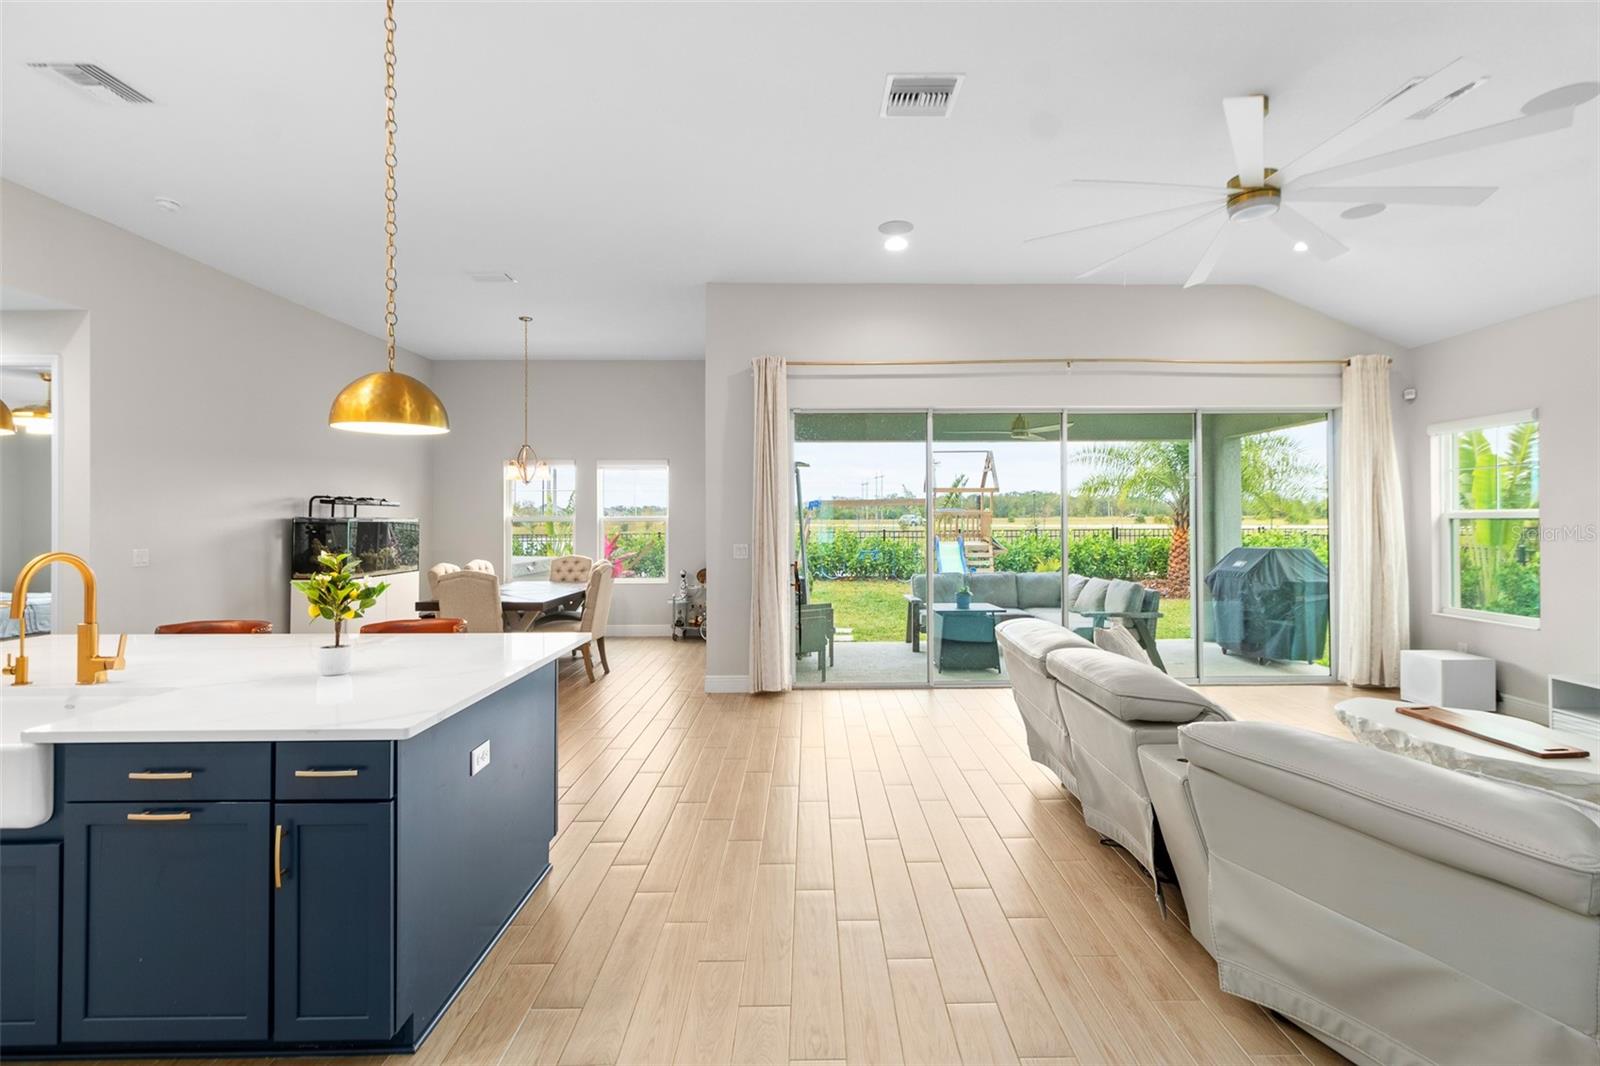
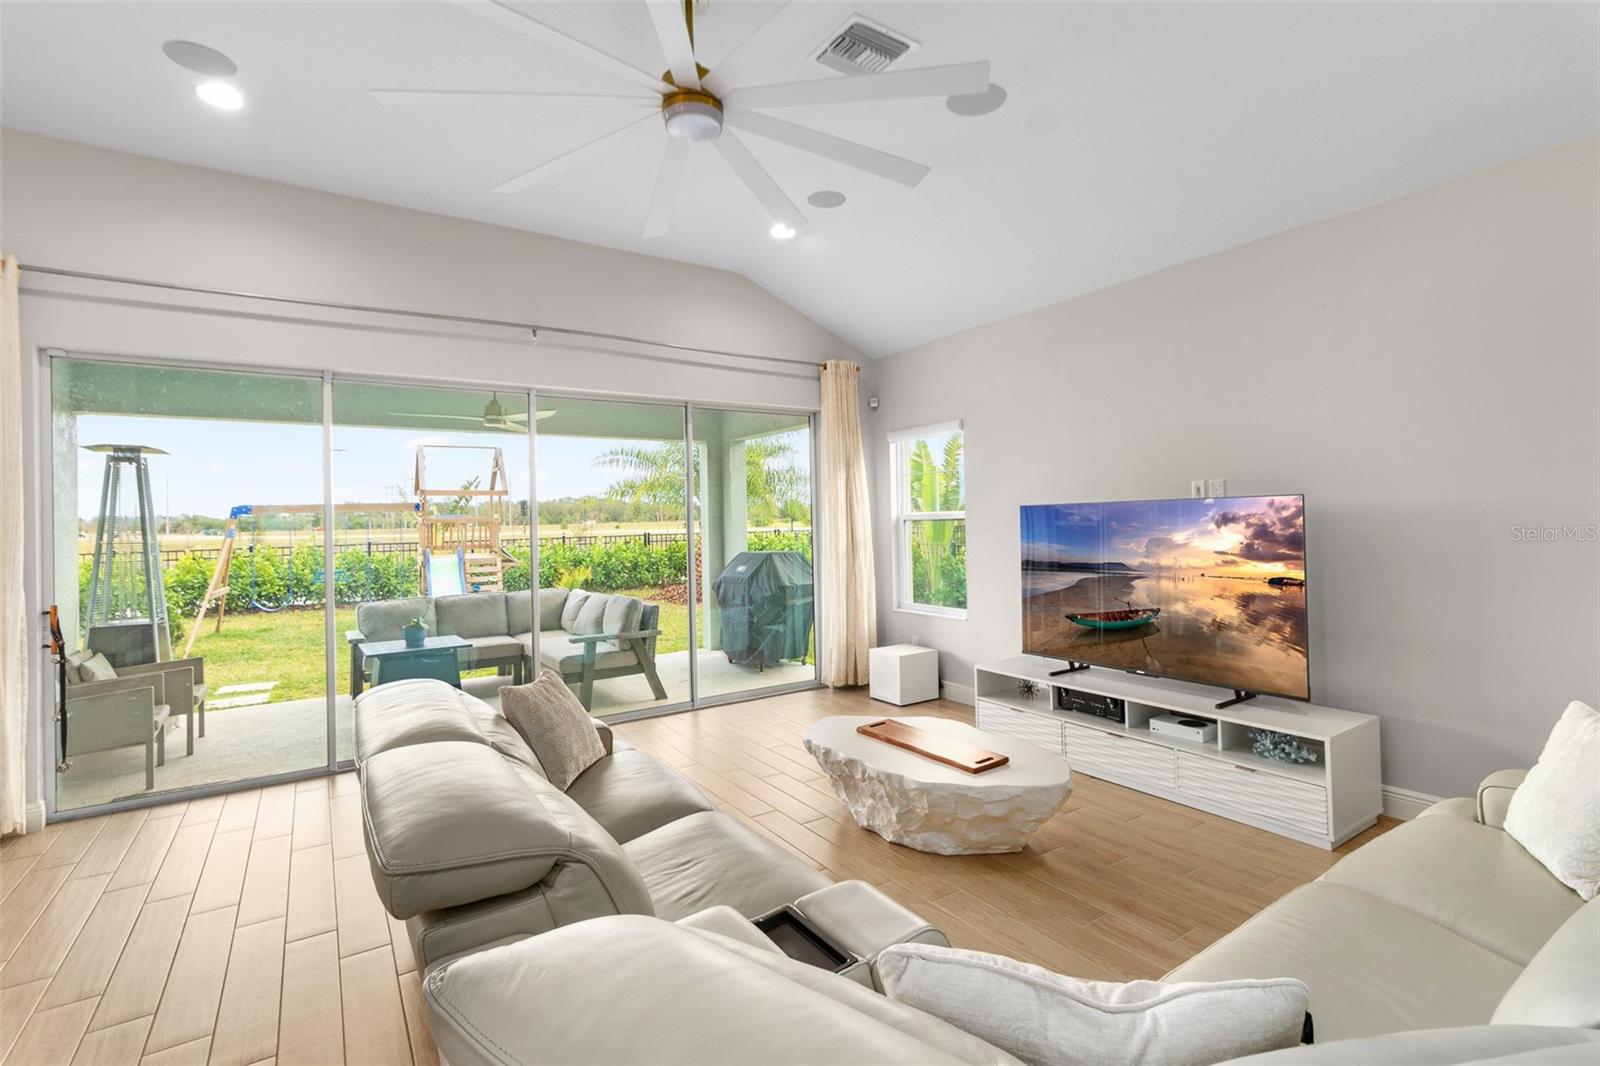
Short Sale. ***Seller's Motivated! AMAZING New Price*** Welcome to the stunning Swann IV, a beautifully designed two-story residence that perfectly balances luxury and functionality. This thoughtfully crafted home features dramatic ceilings and elegant 8' doors throughout, creating an immediate sense of grandeur and spaciousness. The heart of the home is the expansive center island in the kitchen, providing the ideal gathering spot for family and friends to connect over meals and memories. The Swann IV offers an open-concept floor plan with most of the living spaces conveniently located on the first floor, making everyday living seamless. The owner’s suite is a serene retreat, thoughtfully tucked away from the main living areas for privacy. The spa-like master bath boasts a luxurious soaking tub, a walk-in shower with a rainfall showerhead, double vanities, and an oversized walk-in closet with custom built-ins to keep everything beautifully organized. This home also features a spacious upstairs bonus room with a private bathroom, perfect for a game room, media center, or guest suite. The oversized den with dramatic French doors offers a flexible space that can be used as a home office, library, or formal sitting room. Additionally, a private fourth bedroom and third full bath provide an ideal space for guests or extended family. Step outside to a tranquil backyard oasis overlooking a serene pond and lush conservation area. This private outdoor space is perfect for enjoying Florida's beautiful weather, whether you're sipping your morning coffee or hosting an evening gathering. Practicality meets luxury with a spacious three-car garage and an extended driveway, providing ample storage and parking options for vehicles, recreational gear, and more. Nestled in the heart of the award-winning Waterset community, this home offers a lifestyle that's second to none. Residents enjoy access to four resort-style pools, including a lap pool, state-of-the-art fitness centers, pickleball, basketball, and volleyball courts. The community features numerous nature trails for walking and biking, playgrounds, a splash pad, and two dog parks, ensuring there’s something for everyone. Waterset’s vibrant community life includes regular social events, concerts, food truck rallies, car shows, and clubs, creating a welcoming and lively atmosphere. Conveniently located within biking distance to brand-new retail centers, you'll find everything you need within a two-mile radius—including restaurants, coffee shops, juice bars, nail salons, doggy daycare and grooming services, grocery stores, medical offices, and more. For those seeking adventure, this home is just minutes from Tampa Bay’s boating and fishing opportunities. World-class beaches, perfect for sunbathing and snorkeling, are less than an hour away, and you can reach the magic of Disney World and other popular theme parks in under two hours. Don’t miss your chance to call this stunning property home. Experience the best of Florida living with luxury, convenience, and community right at your doorstep!
Build Your Team
Quickly find investor-friendly professionals who can help you succeed in real estate investing at any stage of the investing journey.


Agents
Match with investor-friendly agents who can help you find, analyze, and close your next deal


Lenders
Get the best funding…find investor-friendly lenders who specialize in your deal strategy


Property Managers
Transition to passive investing. Find a trusted property management partnership that lasts.


Tax Pros & Accountants
Taxes and financial reporting made easy—find experts to create tax savings strategies, file taxes, and more
Location
Property Details
Parking
- Description: Garage
- Details: Attached
- Garage Spaces: 3
- Spaces Total: 0
Bedroom Information
- # of Bedrooms: 4
Bathroom Information
- # of Baths (Full): 4
- # of Baths (Total): 4.0
Interior Features
- # of Rooms: 10
- # of Stories: 2
Exterior Features
- Exterior Walls Materials: Stucco
- Foundation: Slab
- Roof Type: Gable or Hip
- Roof Material: Shingle
HOA
- Has HOA: Yes
- Association: Castle Group
- HOA Fee: $141/annually
Land Information
- Land Use: Residential
- Land Use Subtype: Single Family Residential
Lot Information
- Parcel ID: U273119C9O000008000800
- Lot Size: 8561 sqft
Property Information
- Property Type: Single Family Residence
- Style: Craftsman
- Year Built: 2023
Tax Information
- Annual Tax: $14,290
Utilities
- Water & Sewer: Public
- Heating: Central
- Cooling: Central Air
Location
- County: Hillsborough
Listing Details
Investment Summary
- Monthly Cash Flow
- -$1,402
- Cap Rate
- 3.5%
- Cash-on-Cash Return
- -11.3%
- Debt Coverage Ratio
- 0.58
- Internal Rate of Return (5 years)
- -7.0%
Cash Flow
Net Operating Income (NOI) minus mortgage payments.
Calculation:
NOI - Mortgage Payments
Cap Rate (Market Value)
Capitalization Rate is a rate of return that compares the yearly Net Operating Income (NOI) to the market value.
Calculation:
NOI / Market Value
Cash-on-Cash Return (CoC)
Annual Cash Flow / Cash Invested
Calculation:
Annual cash flow divided by initial cash invested.
Debt Coverage Ratio (DCR)
Net Operating Income (NOI) divided by total debt payments.
Calculation:
NOI / Total Debt Payments
Internal Rate of Return (IRR)
A metric for assessing profitability over time. IRR is the discount rate at which the net present value (NPV) of all future cash flows (positive and negative) from an investment equals zero — including both periodic cash flow (such as rent) and a projected sale at the end of the holding period. It represents the expected annualized return, accounting for income, expenses, and the recovery of capital through a future sale.
Purchase Details
Purchase PriceThe price paid for the property. Purchase price:
| $645,000 |
|---|---|
Amount FinancedThe amount of the purchase financed through a loan. Amount financed:
| -$516,000 |
Down paymentThe initial payment made towards the purchase. Down payment:
| $129,000 |
Closing CostsFees and expenses associated with purchasing a property, typically ranging from 2% to 5% of the home’s purchase price, paid at the end of a home purchase to cover services like lending, title transfer, and taxes. Closing costs:
| $19,350 |
Rehab CostsCosts incurred to repair or improve the property, including: roof, flooring, exterior siding, kitchen, exterior paint, bathrooms, etc. Rehab costs:
| $0 |
Initial Cash InvestedThe total initial cash invested in the property. Calculation:Down payment + Buying costs + Rehab costs Initial cash invested:
| $148,350 |
Square Feet (SQFT)The total square footage of the property. Square feet:
| 3,219 |
Cost Per Square FootCost per square foot of the property. Calculation:Purchase Price / Square Feet Cost per square foot:
| $200 |
Monthly Rent Per Square FootMonthly rent divided by the number of square feet. This ratio helps investors compare rental income efficiency across properties, markets, and unit sizes Calculation:Monthly Rent / Square Feet Monthly rent per square foot:
| $1.40 |
Financing Details
Loan AmountThe total sum of money borrowed from a lender to finance a property purchase. Calculation:Purchase Price - Down Payment
Loan amount:
| $516,000 |
|---|---|
Loan to Value Ratio (LTV)Loan amount divided by the market value of the property. Calculation:Loan Amount / Market Value
Loan to value ratio:
| 80.0% |
Loan TypeThe type of loan (e.g., fixed, adjustable).
Loan type:
| Amortizing |
TermThe loan repayment period in years.
Term:
| 30 years |
Interest RateThe percentage a lender charges on the borrowed amount of a loan, determining the cost of borrowing money.
Interest rate:
| 6.625% |
Principal & Interest (PI)The principal is the portion of the loan payment that reduces the loan balance. The interest is the lender's charge for borrowing money. Calculation:(P * r * (1 + r) ** n) / ((1 + r) ** n - 1) Where:
P = Loan amount (principal)
Principal & interest:
| $3,304 |
Property TaxesAnnual taxes levied by local governments on real estate properties. These taxes fund public services like schools, roads, and emergency services.
Property tax:
| $1,191 |
InsuranceThe costs for insurance coverage to protect against financial losses due to risks like fire, natural disasters, theft, liability, or tenant-related damages. Calculation:Assumes 7% of gross rental income, unless insurance rates are specified.
Insurance:
| $315 |
Private Mortgage Insurance (PMI)A fee that borrowers pay when they take out a conventional loan with a loan-to-value (LTV) ratio above 80%.
Private mortgage insurance (PMI):
| $0 |
Monthly PaymentThe fixed amount a borrower pays each month to repay a loan. It typically includes principal and interest (P&I) and may also cover property taxes, insurance, HOA fees, and PMI if escrowed. Monthly payment:
| $4,810 |
Operating Income
| % Rent | Monthly | Yearly | |
|---|---|---|---|
Gross RentThe total rental income received from tenants before deducting any expenses. Includes base rent, late fees, pet fees, parking fees, and other recurring charges.
Gross rent:
| $4,500 | $54,000 | |
Vacancy LossExpected loss of rent due to vacancies.
Vacancy loss:
(6%)
| 6% | -$270 | -$3,240 |
Operating IncomeGross rental income minus vacancy loss. Calculation:Gross rent - Vacancy loss
Operating income:
| $4,230 | $50,760 |
Operating Expenses
| % Rent | Monthly | Yearly | |
|---|---|---|---|
Property TaxesAnnual taxes levied by local governments on real estate properties. These taxes fund public services like schools, roads, and emergency services. | 26% | -$1,191 | -$14,291 |
InsuranceThe costs for insurance coverage to protect against financial losses due to risks like fire, natural disasters, theft, liability, or tenant-related damages. Calculation:Assumes 7% of gross rental income, unless insurance rates are specified. | 7% | -$315 | -$3,780 |
Property ManagementThe costs associated with hiring a property manager to handle the day-to-day operations of a rental property. Includes management fees, leasing fes, eviction fees, etc. Calculation:Assumes 8% of gross rental income. | 8% | -$360 | -$4,320 |
Repairs & MaintenanceOngoing costs for routine upkeep and minor fixes needed to keep a property in good working condition. Calculation:Assumes 5% of gross rental income. Varies by property age and condition. | 5% | -$225 | -$2,700 |
Capital ExpensesLarge, infrequent costs for major improvements or replacements, like a new roof, HVAC system, or appliances. Calculation:Assumes 5% of gross rental income. Varies by property age. | 5% | -$225 | -$2,700 |
HOA FeesRegular dues paid to a Homeowners Association for community maintenance, amenities, and management. Similar fees include: Condo Association Fees, Co-op Maintenance Fees, etc. | 0% | -$12 | -$144 |
Operating ExpensesRecurring costs required to maintain and manage a rental property, including property taxes, insurance, maintenance, repairs, utilities (if paid by the owner), property management fees, and other day-to-day expenses. Calculation:Insurance + Property Taxes + Property Management + Repairs & Maintenance + Capital Expenditures + HOA Fees | 52% | -$2,328 | -$27,935 |
Cash Flow
| Monthly | Yearly | |
|---|---|---|
Net Operating Income (NOI)The income generated from a property after deducting all operating expenses but before deducting mortgage payments, taxes, and capital expenditures. Calculation:Gross Operating Income - Operating Expenses
Net operating income:
| $1,902 | $22,824 |
Mortgage PaymentThe fixed amount a borrower pays each month to repay a loan. It typically includes principal and interest (P&I) and may also cover property taxes, insurance, HOA fees, and PMI if escrowed. | -$3,304 | -$39,648 |
Cash FlowNet Operating Income (NOI) minus mortgage payments. Calculation:NOI - Mortgage Payments | $1,402 | $16,824 |