Apollo Beach, FL Investment Properties for Sale
Browse homes for sale and investment properties in Apollo Beach, FL. Refine your search by price, property type, or more.
Best cash flowing properties in Apollo Beach, FL
Active
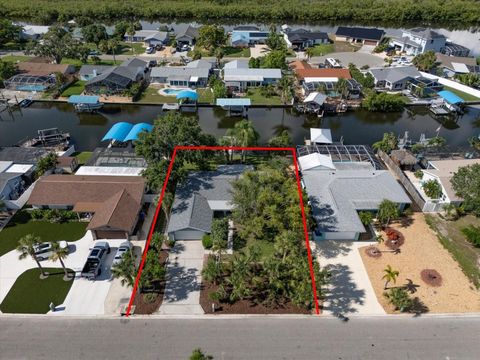
$575,000
3
bds
|
2
ba
|
1,602
sqft
|
built
1989
917 Shagos Dr, Apollo Beach, FL 33572
$138
Cash flow
1.3%
Cash-on-Cash Return
6.4%
Cap rate
1.0%
Rent to Value Ratio
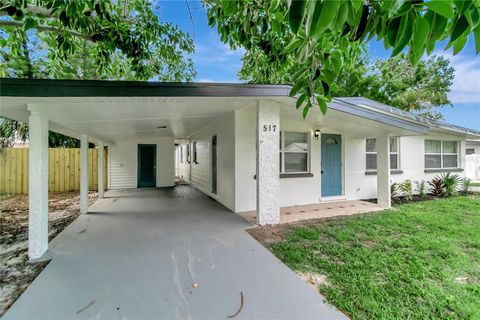
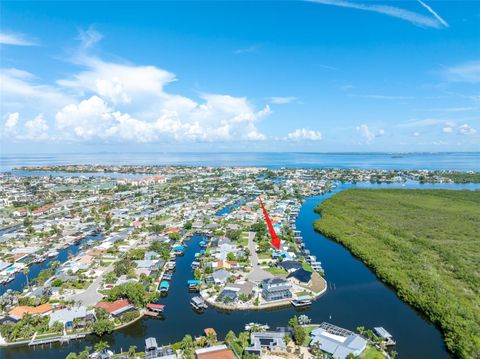
Active
$259,900
3
bds
|
2
ba
|
1,168
sqft
|
built
1960
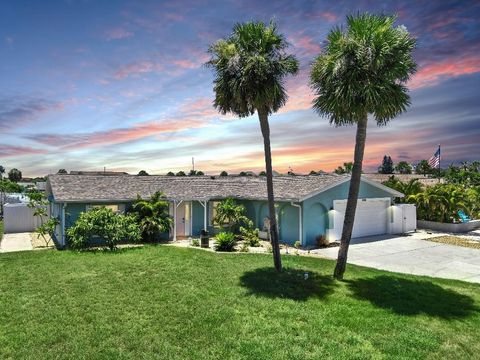
517 Fairhope Dr, Apollo Beach, FL 33572
$-252
Cash flow
-5.1%
Cash-on-Cash Return
5.0%
Cap rate
0.8%
Rent to Value Ratio
111 out of 112 properties for sale in Apollo Beach, FL
Limited Results Shown
Create a free account, or log in to reveal all property listings and enjoy the complete experience.
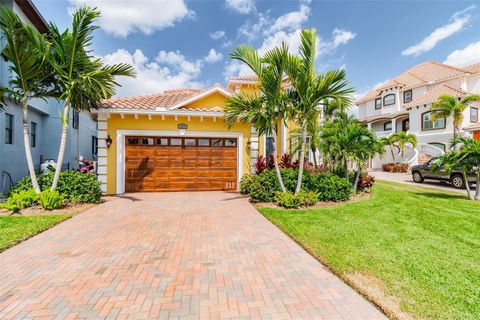
Active
$1,100,000
4
bds
|
4
ba
|
2,948
sqft
|
built
2006
5711 Tortoise Pl, Apollo Beach, FL 33572
$-3,454
Cash flow
-16.4%
Cash-on-Cash Return
2.4%
Cap rate
0.5%
Rent to Value Ratio
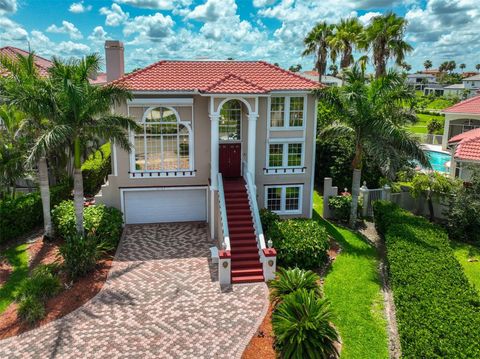
Active
$279,500
3
bds
|
2
ba
|
1,356
sqft
|
built
1981
6341 Flamingo Dr, Apollo Beach, FL 33572
$-286
Cash flow
-5.3%
Cash-on-Cash Return
4.9%
Cap rate
0.8%
Rent to Value Ratio
Active
$499,000
3
bds
|
3
ba
|
2,160
sqft
|
built
2013
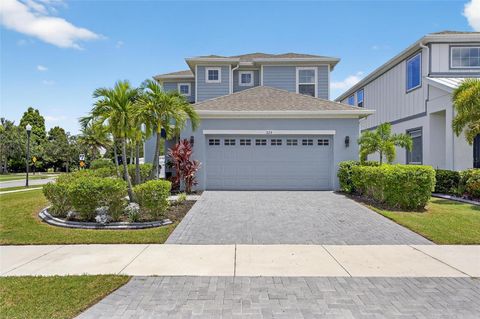
7304 Milestone Dr, Apollo Beach, FL 33572
$-360
Cash flow
-3.8%
Cash-on-Cash Return
5.3%
Cap rate
0.6%
Rent to Value Ratio
Active
$410,000
3
bds
|
3
ba
|
2,147
sqft
|
built
2015
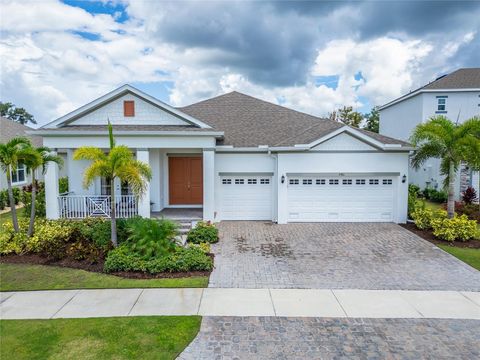
6909 Old Benton Dr, Apollo Beach, FL 33572
$-694
Cash flow
-8.8%
Cash-on-Cash Return
4.1%
Cap rate
0.7%
Rent to Value Ratio
Active
$1,100,000
3
bds
|
2
ba
|
3,850
sqft
|
built
1988
929 Symphony Isles Blvd, Apollo Beach, FL 33572
$-3,196
Cash flow
-15.2%
Cash-on-Cash Return
2.7%
Cap rate
0.4%
Rent to Value Ratio
Active
$1,500,000
6
bds
|
7
ba
|
5,861
sqft
|
built
2021
832 Manns Harbor Dr, Apollo Beach, FL 33572
$-4,696
Cash flow
-16.3%
Cash-on-Cash Return
2.4%
Cap rate
0.5%
Rent to Value Ratio
Active
$659,900
4
bds
|
4
ba
|
2,532
sqft
|
built
2022
325 Shore Crab Way, Apollo Beach, FL 33572
$-2,097
Cash flow
-16.6%
Cash-on-Cash Return
2.3%
Cap rate
0.5%
Rent to Value Ratio
Active
$299,000
2
bds
|
2
ba
|
1,546
sqft
|
built
2004
208 Oceania Ct, Apollo Beach, FL 33572
$-1,072
Cash flow
-18.7%
Cash-on-Cash Return
1.8%
Cap rate
0.8%
Rent to Value Ratio
Active
$1,690,000
4
bds
|
4
ba
|
2,911
sqft
|
built
1998
1024 Sonata Ln, Apollo Beach, FL 33572
$-5,210
Cash flow
-16.1%
Cash-on-Cash Return
2.4%
Cap rate
0.5%
Rent to Value Ratio
Active
$1,190,000
4
bds
|
3
ba
|
2,625
sqft
|
built
2023
5961 Blakeney Loop, Apollo Beach, FL 33572
$-4,062
Cash flow
-17.8%
Cash-on-Cash Return
2.1%
Cap rate
0.4%
Rent to Value Ratio
Active
$615,000
3
bds
|
4
ba
|
2,763
sqft
|
built
2008
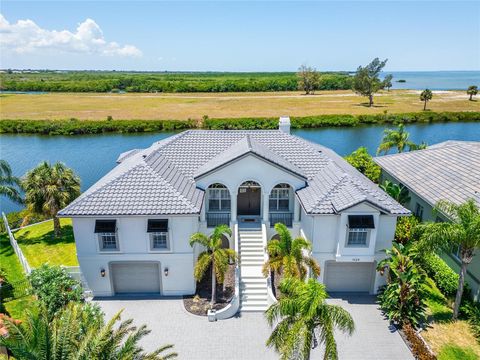
6413 Mayra Shores Ln, Apollo Beach, FL 33572
$-1,807
Cash flow
-15.3%
Cash-on-Cash Return
2.6%
Cap rate
0.5%
Rent to Value Ratio
Active
$799,000
4
bds
|
2
ba
|
1,677
sqft
|
built
1975
1004 Sago Palm Way, Apollo Beach, FL 33572
$-1,910
Cash flow
-12.5%
Cash-on-Cash Return
3.3%
Cap rate
0.6%
Rent to Value Ratio
Active
$375,000
3
bds
|
3
ba
|
2,154
sqft
|
built
2006
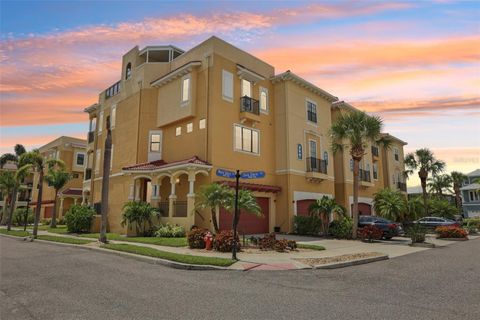
515 Villa Treviso Ct, Apollo Beach, FL 33572
$-400
Cash flow
-5.6%
Cash-on-Cash Return
4.9%
Cap rate
0.7%
Rent to Value Ratio
Active
$834,900
3
bds
|
2
ba
|
1,953
sqft
|
built
1976
6516 Bimini Ct, Apollo Beach, FL 33572
$-2,407
Cash flow
-15.0%
Cash-on-Cash Return
2.7%
Cap rate
0.4%
Rent to Value Ratio
Active
$469,900
4
bds
|
2
ba
|
2,105
sqft
|
built
2003
6608 Clair Shore Dr, Apollo Beach, FL 33572
$-1,097
Cash flow
-12.2%
Cash-on-Cash Return
3.3%
Cap rate
0.6%
Rent to Value Ratio
Active
$339,000
3
bds
|
2
ba
|
1,948
sqft
|
built
2002
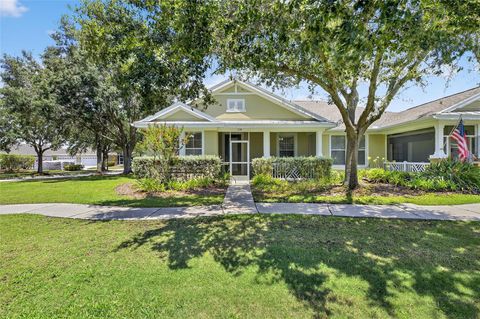
7601 Wiltshire Park Pl, Apollo Beach, FL 33572
$-344
Cash flow
-5.3%
Cash-on-Cash Return
4.9%
Cap rate
0.7%
Rent to Value Ratio
Active
$440,000
4
bds
|
3
ba
|
2,073
sqft
|
built
2023
5528 Summer Sunset Dr, Apollo Beach, FL 33572
$-917
Cash flow
-10.9%
Cash-on-Cash Return
3.6%
Cap rate
0.7%
Rent to Value Ratio
Active
$574,900
4
bds
|
4
ba
|
3,427
sqft
|
built
2006
5212 Brighton Shore Dr, Apollo Beach, FL 33572
$-791
Cash flow
-7.2%
Cash-on-Cash Return
4.5%
Cap rate
0.7%
Rent to Value Ratio
Active
$579,000
4
bds
|
3
ba
|
2,326
sqft
|
built
2007
557 Bimini Bay Blvd, Apollo Beach, FL 33572
$-1,384
Cash flow
-12.5%
Cash-on-Cash Return
3.3%
Cap rate
0.6%
Rent to Value Ratio
Active
$549,900
3
bds
|
3
ba
|
2,140
sqft
|
built
2023
6394 Roadstead Ct, Apollo Beach, FL 33572
$-1,350
Cash flow
-12.8%
Cash-on-Cash Return
3.2%
Cap rate
0.6%
Rent to Value Ratio
Active
$610,000
3
bds
|
3
ba
|
2,558
sqft
|
built
2014
624 Winterside Dr, Apollo Beach, FL 33572
$-1,556
Cash flow
-13.3%
Cash-on-Cash Return
3.1%
Cap rate
0.6%
Rent to Value Ratio
Active
$298,500
2
bds
|
2
ba
|
1,084
sqft
|
built
1977
1028 Apollo Beach Blvd, Apollo Beach, FL 33572
$-777
Cash flow
-13.6%
Cash-on-Cash Return
3.0%
Cap rate
0.8%
Rent to Value Ratio
Active
$269,500
3
bds
|
3
ba
|
1,677
sqft
|
built
2020
6354 Camino Dr, Apollo Beach, FL 33572
$-488
Cash flow
-9.4%
Cash-on-Cash Return
4.0%
Cap rate
0.9%
Rent to Value Ratio
Active
$750,000
4
bds
|
3
ba
|
3,325
sqft
|
built
2015
6927 Crestpoint Dr, Apollo Beach, FL 33572
$-2,162
Cash flow
-15.0%
Cash-on-Cash Return
2.7%
Cap rate
0.5%
Rent to Value Ratio
Active
$595,000
4
bds
|
3
ba
|
2,921
sqft
|
built
2014
7017 Artesian Ct, Apollo Beach, FL 33572
$-1,407
Cash flow
-12.3%
Cash-on-Cash Return
3.3%
Cap rate
0.7%
Rent to Value Ratio
Active
$1,495,000
4
bds
|
3
ba
|
3,486
sqft
|
built
1999
6002 Adagio Ln, Apollo Beach, FL 33572
$-5,341
Cash flow
-18.6%
Cash-on-Cash Return
1.9%
Cap rate
0.3%
Rent to Value Ratio
Active
$730,000
5
bds
|
4
ba
|
3,199
sqft
|
built
2020
7401 Paradiso Dr, Apollo Beach, FL 33572
$-949
Cash flow
-6.8%
Cash-on-Cash Return
4.6%
Cap rate
0.6%
Rent to Value Ratio
Active
$740,000
3
bds
|
3
ba
|
2,094
sqft
|
built
1974
1006 Sago Palm Way, Apollo Beach, FL 33572
$-1,295
Cash flow
-9.1%
Cash-on-Cash Return
4.0%
Cap rate
0.7%
Rent to Value Ratio
Active
$349,000
2
bds
|
2
ba
|
1,584
sqft
|
built
2021
6352 Mooring Line Cir, Apollo Beach, FL 33572
$-1,130
Cash flow
-16.9%
Cash-on-Cash Return
2.3%
Cap rate
0.7%
Rent to Value Ratio
Active
$890,000
5
bds
|
4
ba
|
3,217
sqft
|
built
2023
5426 Wayfarer Ave, Apollo Beach, FL 33572
$-2,934
Cash flow
-17.2%
Cash-on-Cash Return
2.2%
Cap rate
0.4%
Rent to Value Ratio
Active
$960,000
3
bds
|
3
ba
|
2,815
sqft
|
built
2005
5720 Tortoise Pl, Apollo Beach, FL 33572
$-3,153
Cash flow
-17.1%
Cash-on-Cash Return
2.2%
Cap rate
0.5%
Rent to Value Ratio
Active
$529,000
4
bds
|
3
ba
|
3,104
sqft
|
built
2004
7711 Nottinghill Sky Dr, Apollo Beach, FL 33572
$-1,104
Cash flow
-10.9%
Cash-on-Cash Return
3.6%
Cap rate
0.6%
Rent to Value Ratio
Active
$339,900
3
bds
|
2
ba
|
1,750
sqft
|
built
2011
221 Sunset Crest Ct, Apollo Beach, FL 33572
$-1,283
Cash flow
-19.7%
Cash-on-Cash Return
1.6%
Cap rate
0.7%
Rent to Value Ratio
Active
$479,000
4
bds
|
2
ba
|
2,172
sqft
|
built
2019
5434 Silver Sun Dr, Apollo Beach, FL 33572
$-400
Cash flow
-4.4%
Cash-on-Cash Return
5.1%
Cap rate
0.7%
Rent to Value Ratio
Active
$499,000
3
bds
|
2
ba
|
1,590
sqft
|
built
1973
911 Sago Palm Way, Apollo Beach, FL 33572
$-830
Cash flow
-8.7%
Cash-on-Cash Return
4.2%
Cap rate
0.6%
Rent to Value Ratio
Active
$1,150,000
4
bds
|
3
ba
|
2,721
sqft
|
built
2004
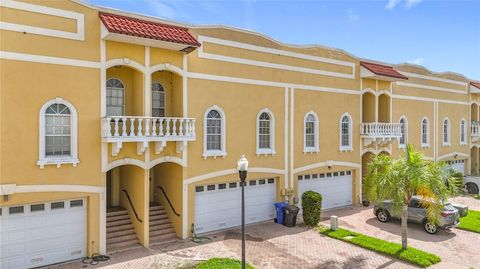
539 Treviso Dr, Apollo Beach, FL 33572
$-1,840
Cash flow
-8.3%
Cash-on-Cash Return
4.2%
Cap rate
0.7%
Rent to Value Ratio
Active
$815,000
3
bds
|
3
ba
|
2,113
sqft
|
built
1984
909 Silver Palm Way, Apollo Beach, FL 33572
$-2,350
Cash flow
-15.0%
Cash-on-Cash Return
2.7%
Cap rate
0.4%
Rent to Value Ratio
Active
$1,325,000
4
bds
|
5
ba
|
5,206
sqft
|
built
1993
6107 Marbella Blvd, Apollo Beach, FL 33572
$-4,824
Cash flow
-19.0%
Cash-on-Cash Return
1.8%
Cap rate
0.3%
Rent to Value Ratio