
$474,900
Investment Summary
- Monthly Cash Flow
- -$1,532
- Cap Rate
- 2.3%
- Cash-on-Cash Return
- -16.8%
- Debt Coverage Ratio
- 0.37
- Internal Rate of Return (5 years)
- -12.3%
Cash Flow
Net Operating Income (NOI) minus mortgage payments.
Calculation:
NOI - Mortgage Payments
Cap Rate (Market Value)
Capitalization Rate is a rate of return that compares the yearly Net Operating Income (NOI) to the market value.
Calculation:
NOI / Market Value
Cash-on-Cash Return (CoC)
Annual Cash Flow / Cash Invested
Calculation:
Annual cash flow divided by initial cash invested.
Debt Coverage Ratio (DCR)
Net Operating Income (NOI) divided by total debt payments.
Calculation:
NOI / Total Debt Payments
Internal Rate of Return (IRR)
A metric for assessing profitability over time. IRR is the discount rate at which the net present value (NPV) of all future cash flows (positive and negative) from an investment equals zero — including both periodic cash flow (such as rent) and a projected sale at the end of the holding period. It represents the expected annualized return, accounting for income, expenses, and the recovery of capital through a future sale.
Property Description
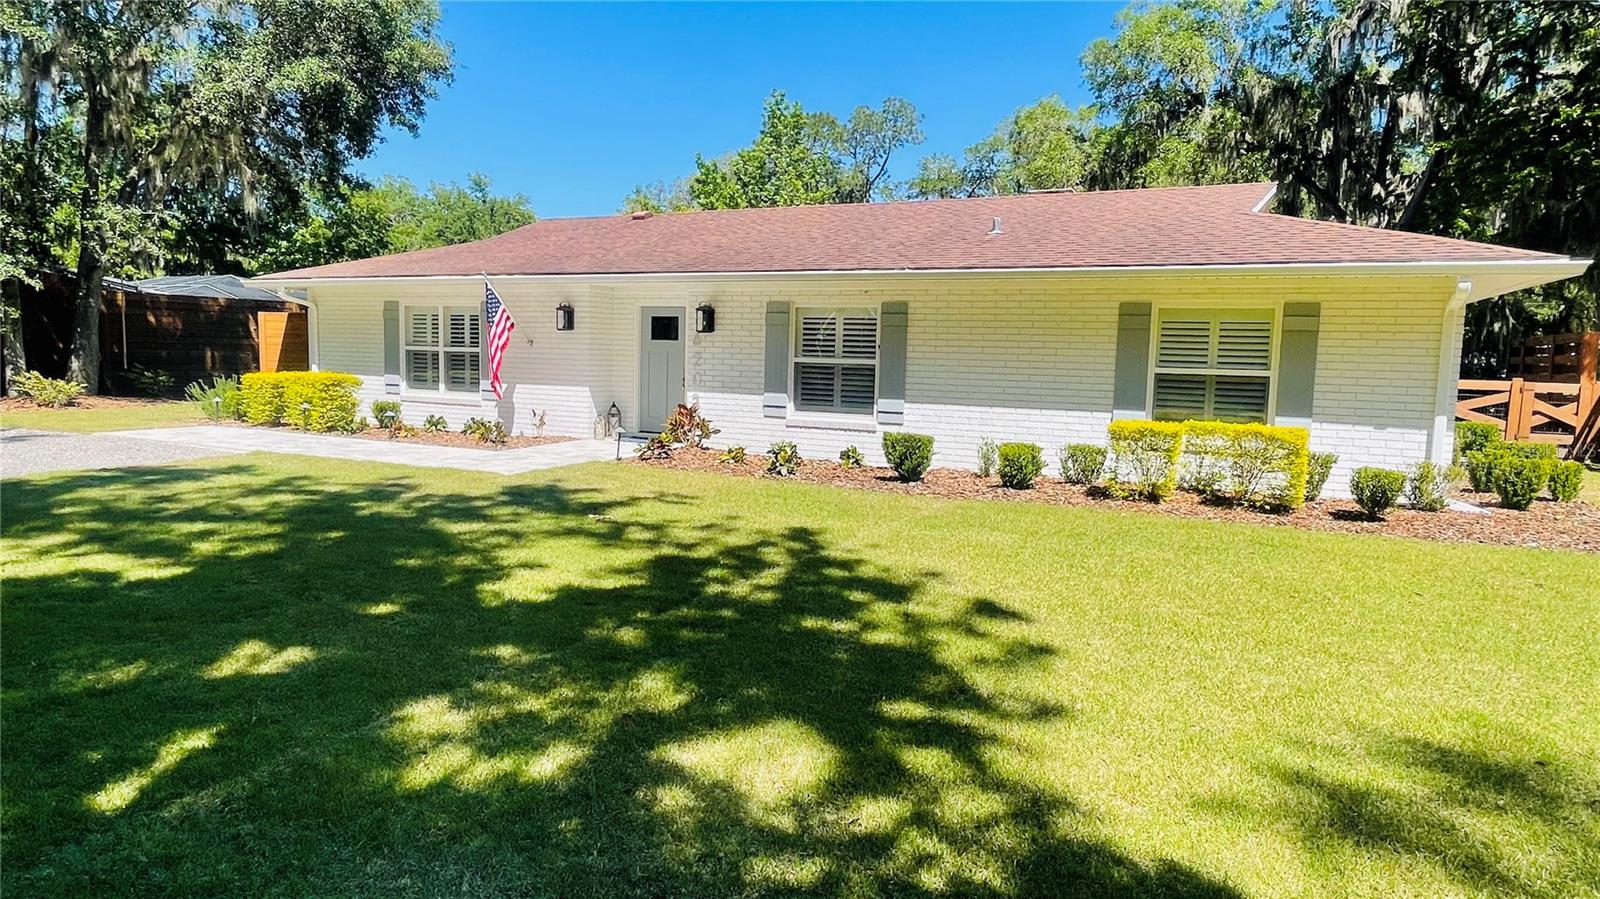
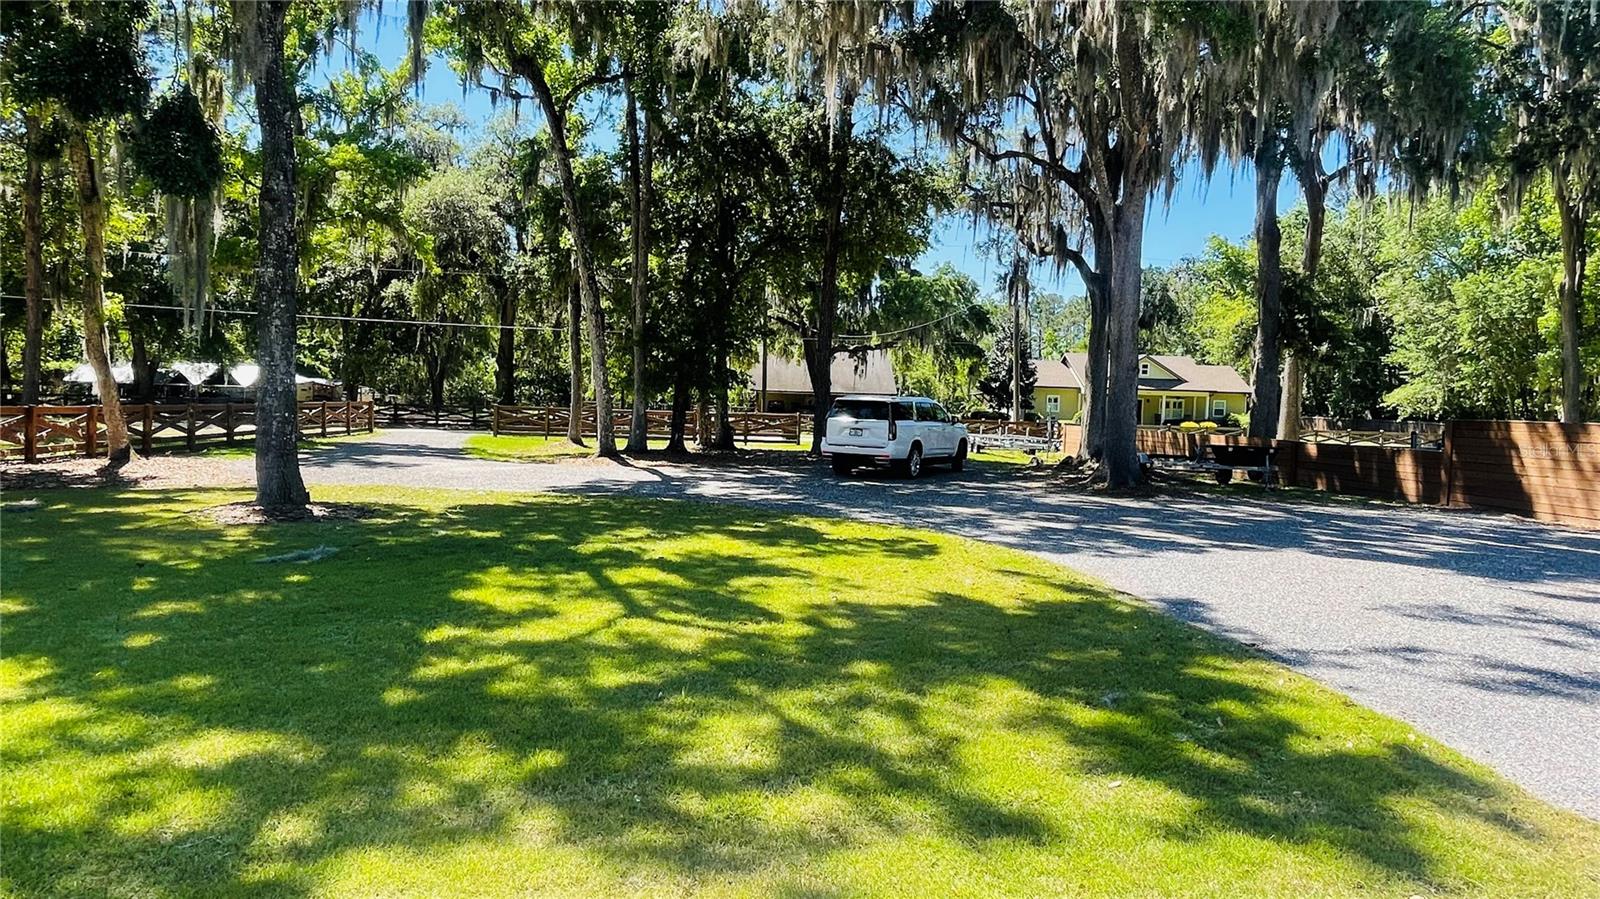
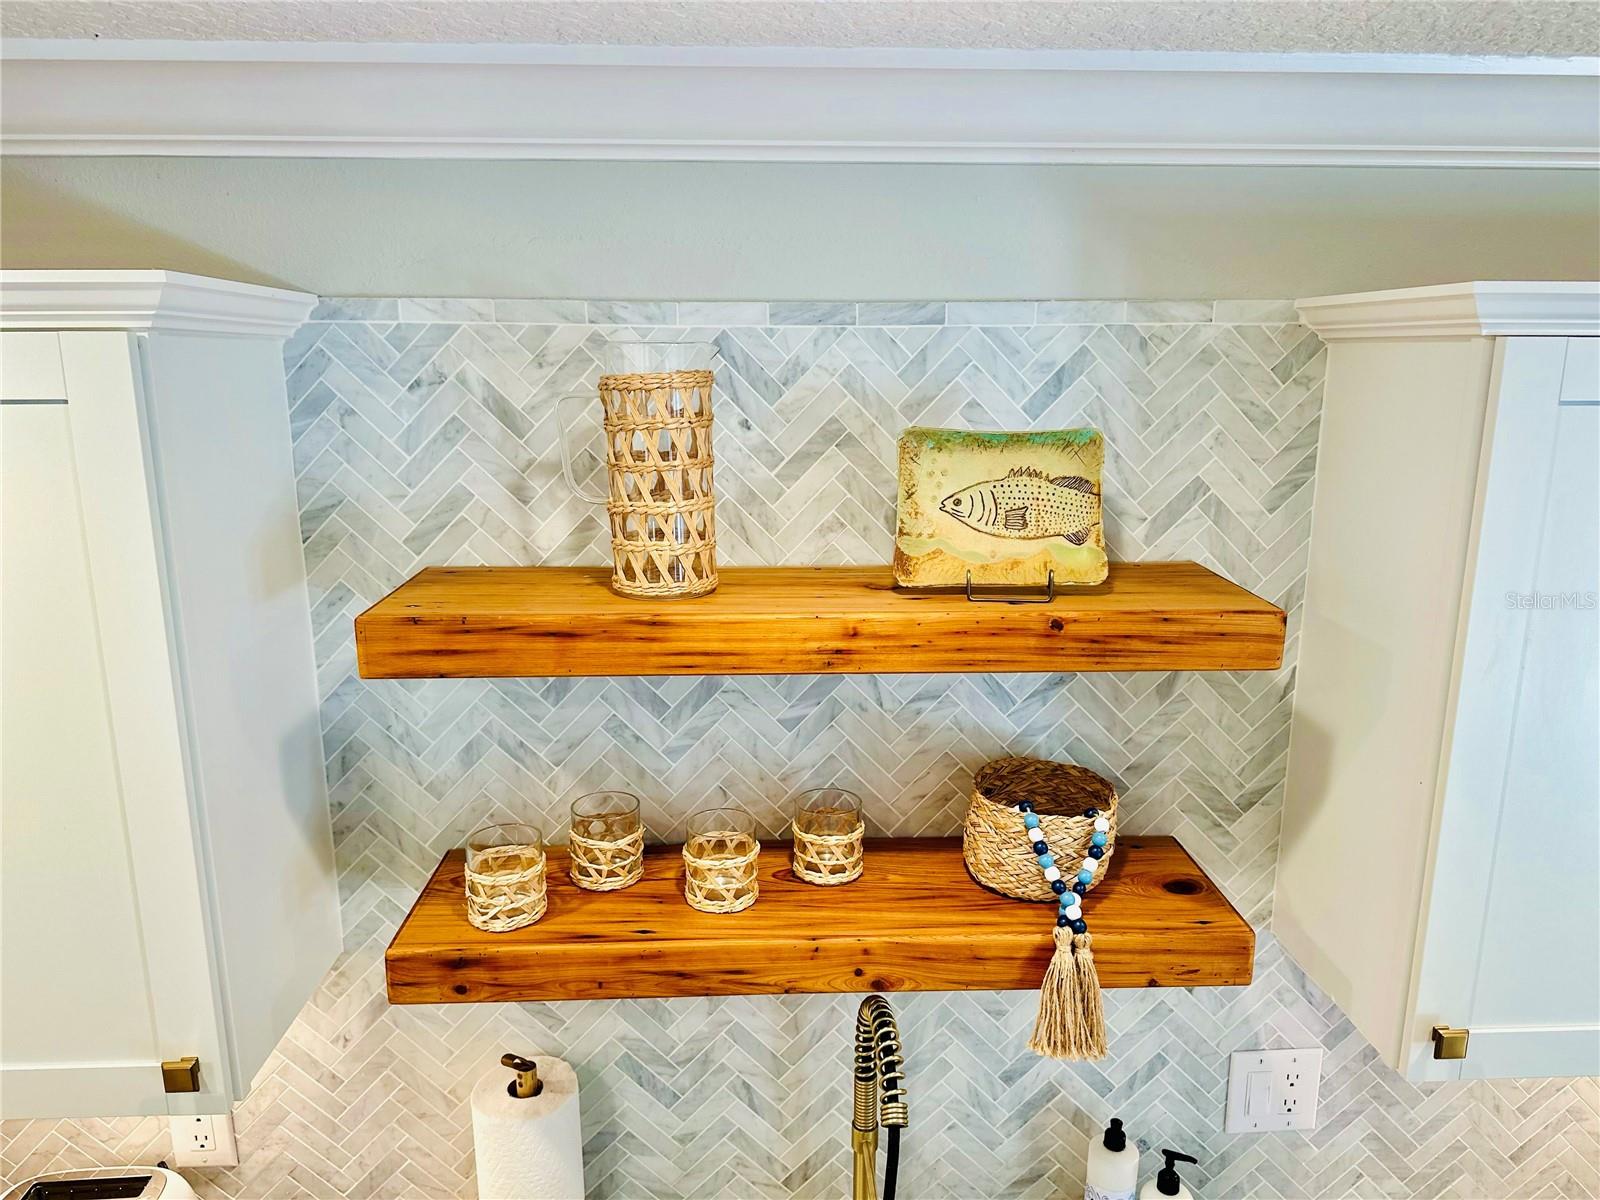
Welcome to this beautiful 3-bedroom, 2-bathroom Pridgen built brick home nestled along the serene waters of Lake Santa Fe Canal Shores. With 1,594 sq. ft. of heated and cooled space, this fully renovated gem is a true showcase of modern living and timeless charm. Every detail has been thoughtfully designed, from the brand-new flooring and cabinetry to the exquisite crown molding and heart pine accents throughout. Interior Features: · Spacious, open floor plan with a separate dining room, bar room, and TV room. · Stunning new kitchen featuring granite counters, island, custom herringbone marble backsplash, under cabinet lighting and stainless-steel appliances. · A custom bar room with navy cabinetry, wine rack, sink, and stainless-steel drink refrigerator perfect for entertaining. · Primary suite with closet built-ins and en-suite bathroom and a luxurious full shower, while the second bathroom offers a tub with shower. · In-ceiling speakers throughout, custom doors, and shiplap detailing add both functionality and style. · Cozy fireplace and custom lighting with dimmers create the perfect ambiance for any occasion. · The laundry room, with a charming sliding barn door, adds an extra touch of character. · New double-insulated windows ensure energy efficiency and comfort year-round. · Custom Plantation Shutters on all Windows Outdoor Living: · Step outside to a stunning paver patio and large fire pit area surrounded by a beautiful sitting wall, perfect for outdoor gatherings. · Just two to three minutes via boat to Lake Santa Fe after leaving your new dock, equipped with durable Trex decking, complete with separate floating dock — the ideal spot for a relaxing day or fishing adventure. Excellent fishing for largemouth bass, crappie, and bluegill right off your dock. · Professionally landscaped grounds with zoysia sod, tropical plants including palm trees, banana trees, ginger, snake plant, croton’s, viburnum's and more, a multi zone irrigation system, exterior uplighting on the home and majestic oak trees create a magical ambiance, a fully fenced property with 5-board cross board fencing and wire for privacy and security. Location: One street over from Santa Fe Lake Park and boat ramp. Just minutes from downtown Melrose, this home offers easy access to local restaurants, farmers markets, grocery stores, schools, and more. Experience the perfect balance of peaceful lakeside living with the convenience of nearby amenities. 20 Minutes from Gainesville. Don't miss out on the chance to own this incredible Lake Santa Fe waterfront home — a rare opportunity to live in a fully renovated, custom-designed, turn key retreat in a prime location. Priced to sell quick!
Build Your Team
Quickly find investor-friendly professionals who can help you succeed in real estate investing at any stage of the investing journey.


Agents
Match with investor-friendly agents who can help you find, analyze, and close your next deal


Lenders
Get the best funding…find investor-friendly lenders who specialize in your deal strategy


Property Managers
Transition to passive investing. Find a trusted property management partnership that lasts.


Tax Pros & Accountants
Taxes and financial reporting made easy—find experts to create tax savings strategies, file taxes, and more
Location
Property Details
Parking
- Description: Garage
- Details: Boat, Circular Driveway, Driveway, Guest, Off Street, RV Access/Parking
- Garage Spaces: 0
- Spaces Total: 0
Bedroom Information
- # of Bedrooms: 3
Bathroom Information
- # of Baths (Full): 2
- # of Baths (Total): 2.0
Interior Features
- # of Rooms: 3
- # of Stories: 1
- Fireplace: Yes
Exterior Features
- Exterior Walls Materials: Brick
- Foundation: Slab
- Roof Type: Gable or Hip
- Roof Material: Shingle
Land Information
- Land Use: Residential
- Land Use Subtype: Single Family Residential
Lot Information
- Parcel ID: 18772022000
- Lot Size: 22651 sqft
Property Information
- Property Type: Single Family Residence
- Style: Coastal, Traditional
- Year Built: 1975
Tax Information
- Annual Tax: $4,093
Utilities
- Water & Sewer: Public
- Heating: Central, Electric, Heat Pump
- Cooling: Central Air
Location
- County: Alachua
Listing Details
Investment Summary
- Monthly Cash Flow
- -$1,532
- Cap Rate
- 2.3%
- Cash-on-Cash Return
- -16.8%
- Debt Coverage Ratio
- 0.37
- Internal Rate of Return (5 years)
- -12.3%
Cash Flow
Net Operating Income (NOI) minus mortgage payments.
Calculation:
NOI - Mortgage Payments
Cap Rate (Market Value)
Capitalization Rate is a rate of return that compares the yearly Net Operating Income (NOI) to the market value.
Calculation:
NOI / Market Value
Cash-on-Cash Return (CoC)
Annual Cash Flow / Cash Invested
Calculation:
Annual cash flow divided by initial cash invested.
Debt Coverage Ratio (DCR)
Net Operating Income (NOI) divided by total debt payments.
Calculation:
NOI / Total Debt Payments
Internal Rate of Return (IRR)
A metric for assessing profitability over time. IRR is the discount rate at which the net present value (NPV) of all future cash flows (positive and negative) from an investment equals zero — including both periodic cash flow (such as rent) and a projected sale at the end of the holding period. It represents the expected annualized return, accounting for income, expenses, and the recovery of capital through a future sale.
Purchase Details
Purchase PriceThe price paid for the property. Purchase price:
| $474,900 |
|---|---|
Amount FinancedThe amount of the purchase financed through a loan. Amount financed:
| -$379,920 |
Down paymentThe initial payment made towards the purchase. Down payment:
| $94,980 |
Closing CostsFees and expenses associated with purchasing a property, typically ranging from 2% to 5% of the home’s purchase price, paid at the end of a home purchase to cover services like lending, title transfer, and taxes. Closing costs:
| $14,247 |
Rehab CostsCosts incurred to repair or improve the property, including: roof, flooring, exterior siding, kitchen, exterior paint, bathrooms, etc. Rehab costs:
| $0 |
Initial Cash InvestedThe total initial cash invested in the property. Calculation:Down payment + Buying costs + Rehab costs Initial cash invested:
| $109,227 |
Square Feet (SQFT)The total square footage of the property. Square feet:
| 1,594 |
Cost Per Square FootCost per square foot of the property. Calculation:Purchase Price / Square Feet Cost per square foot:
| $298 |
Monthly Rent Per Square FootMonthly rent divided by the number of square feet. This ratio helps investors compare rental income efficiency across properties, markets, and unit sizes Calculation:Monthly Rent / Square Feet Monthly rent per square foot:
| $1.13 |
Financing Details
Loan AmountThe total sum of money borrowed from a lender to finance a property purchase. Calculation:Purchase Price - Down Payment
Loan amount:
| $379,920 |
|---|---|
Loan to Value Ratio (LTV)Loan amount divided by the market value of the property. Calculation:Loan Amount / Market Value
Loan to value ratio:
| 80.0% |
Loan TypeThe type of loan (e.g., fixed, adjustable).
Loan type:
| Amortizing |
TermThe loan repayment period in years.
Term:
| 30 years |
Interest RateThe percentage a lender charges on the borrowed amount of a loan, determining the cost of borrowing money.
Interest rate:
| 6.625% |
Principal & Interest (PI)The principal is the portion of the loan payment that reduces the loan balance. The interest is the lender's charge for borrowing money. Calculation:(P * r * (1 + r) ** n) / ((1 + r) ** n - 1) Where:
P = Loan amount (principal)
Principal & interest:
| $2,433 |
Property TaxesAnnual taxes levied by local governments on real estate properties. These taxes fund public services like schools, roads, and emergency services.
Property tax:
| $341 |
InsuranceThe costs for insurance coverage to protect against financial losses due to risks like fire, natural disasters, theft, liability, or tenant-related damages. Calculation:Assumes 7% of gross rental income, unless insurance rates are specified.
Insurance:
| $126 |
Private Mortgage Insurance (PMI)A fee that borrowers pay when they take out a conventional loan with a loan-to-value (LTV) ratio above 80%.
Private mortgage insurance (PMI):
| $0 |
Monthly PaymentThe fixed amount a borrower pays each month to repay a loan. It typically includes principal and interest (P&I) and may also cover property taxes, insurance, HOA fees, and PMI if escrowed. Monthly payment:
| $2,900 |
Operating Income
| % Rent | Monthly | Yearly | |
|---|---|---|---|
Gross RentThe total rental income received from tenants before deducting any expenses. Includes base rent, late fees, pet fees, parking fees, and other recurring charges.
Gross rent:
| $1,800 | $21,600 | |
Vacancy LossExpected loss of rent due to vacancies.
Vacancy loss:
(6%)
| 6% | -$108 | -$1,296 |
Operating IncomeGross rental income minus vacancy loss. Calculation:Gross rent - Vacancy loss
Operating income:
| $1,692 | $20,304 |
Operating Expenses
| % Rent | Monthly | Yearly | |
|---|---|---|---|
Property TaxesAnnual taxes levied by local governments on real estate properties. These taxes fund public services like schools, roads, and emergency services. | 19% | -$341 | -$4,093 |
InsuranceThe costs for insurance coverage to protect against financial losses due to risks like fire, natural disasters, theft, liability, or tenant-related damages. Calculation:Assumes 7% of gross rental income, unless insurance rates are specified. | 7% | -$126 | -$1,512 |
Property ManagementThe costs associated with hiring a property manager to handle the day-to-day operations of a rental property. Includes management fees, leasing fes, eviction fees, etc. Calculation:Assumes 8% of gross rental income. | 8% | -$144 | -$1,728 |
Repairs & MaintenanceOngoing costs for routine upkeep and minor fixes needed to keep a property in good working condition. Calculation:Assumes 5% of gross rental income. Varies by property age and condition. | 5% | -$90 | -$1,080 |
Capital ExpensesLarge, infrequent costs for major improvements or replacements, like a new roof, HVAC system, or appliances. Calculation:Assumes 5% of gross rental income. Varies by property age. | 5% | -$90 | -$1,080 |
HOA FeesRegular dues paid to a Homeowners Association for community maintenance, amenities, and management. Similar fees include: Condo Association Fees, Co-op Maintenance Fees, etc. | n/a | n/a | n/a |
Operating ExpensesRecurring costs required to maintain and manage a rental property, including property taxes, insurance, maintenance, repairs, utilities (if paid by the owner), property management fees, and other day-to-day expenses. Calculation:Insurance + Property Taxes + Property Management + Repairs & Maintenance + Capital Expenditures + HOA Fees | 44% | -$791 | -$9,493 |
Cash Flow
| Monthly | Yearly | |
|---|---|---|
Net Operating Income (NOI)The income generated from a property after deducting all operating expenses but before deducting mortgage payments, taxes, and capital expenditures. Calculation:Gross Operating Income - Operating Expenses
Net operating income:
| $901 | $10,812 |
Mortgage PaymentThe fixed amount a borrower pays each month to repay a loan. It typically includes principal and interest (P&I) and may also cover property taxes, insurance, HOA fees, and PMI if escrowed. | -$2,433 | -$29,196 |
Cash FlowNet Operating Income (NOI) minus mortgage payments. Calculation:NOI - Mortgage Payments | $1,532 | $18,384 |