$990,000
Investment Summary
- Monthly Cash Flow
- -$1,675
- Cap Rate
- 3.6%
- Cash-on-Cash Return
- -8.8%
- Debt Coverage Ratio
- 0.64
- Internal Rate of Return (5 years)
- -4.6%
Cash Flow
Net Operating Income (NOI) minus mortgage payments.
Calculation:
NOI - Mortgage Payments
Cap Rate (Market Value)
Capitalization Rate is a rate of return that compares the yearly Net Operating Income (NOI) to the market value.
Calculation:
NOI / Market Value
Cash-on-Cash Return (CoC)
Annual Cash Flow / Cash Invested
Calculation:
Annual cash flow divided by initial cash invested.
Debt Coverage Ratio (DCR)
Net Operating Income (NOI) divided by total debt payments.
Calculation:
NOI / Total Debt Payments
Internal Rate of Return (IRR)
A metric for assessing profitability over time. IRR is the discount rate at which the net present value (NPV) of all future cash flows (positive and negative) from an investment equals zero — including both periodic cash flow (such as rent) and a projected sale at the end of the holding period. It represents the expected annualized return, accounting for income, expenses, and the recovery of capital through a future sale.
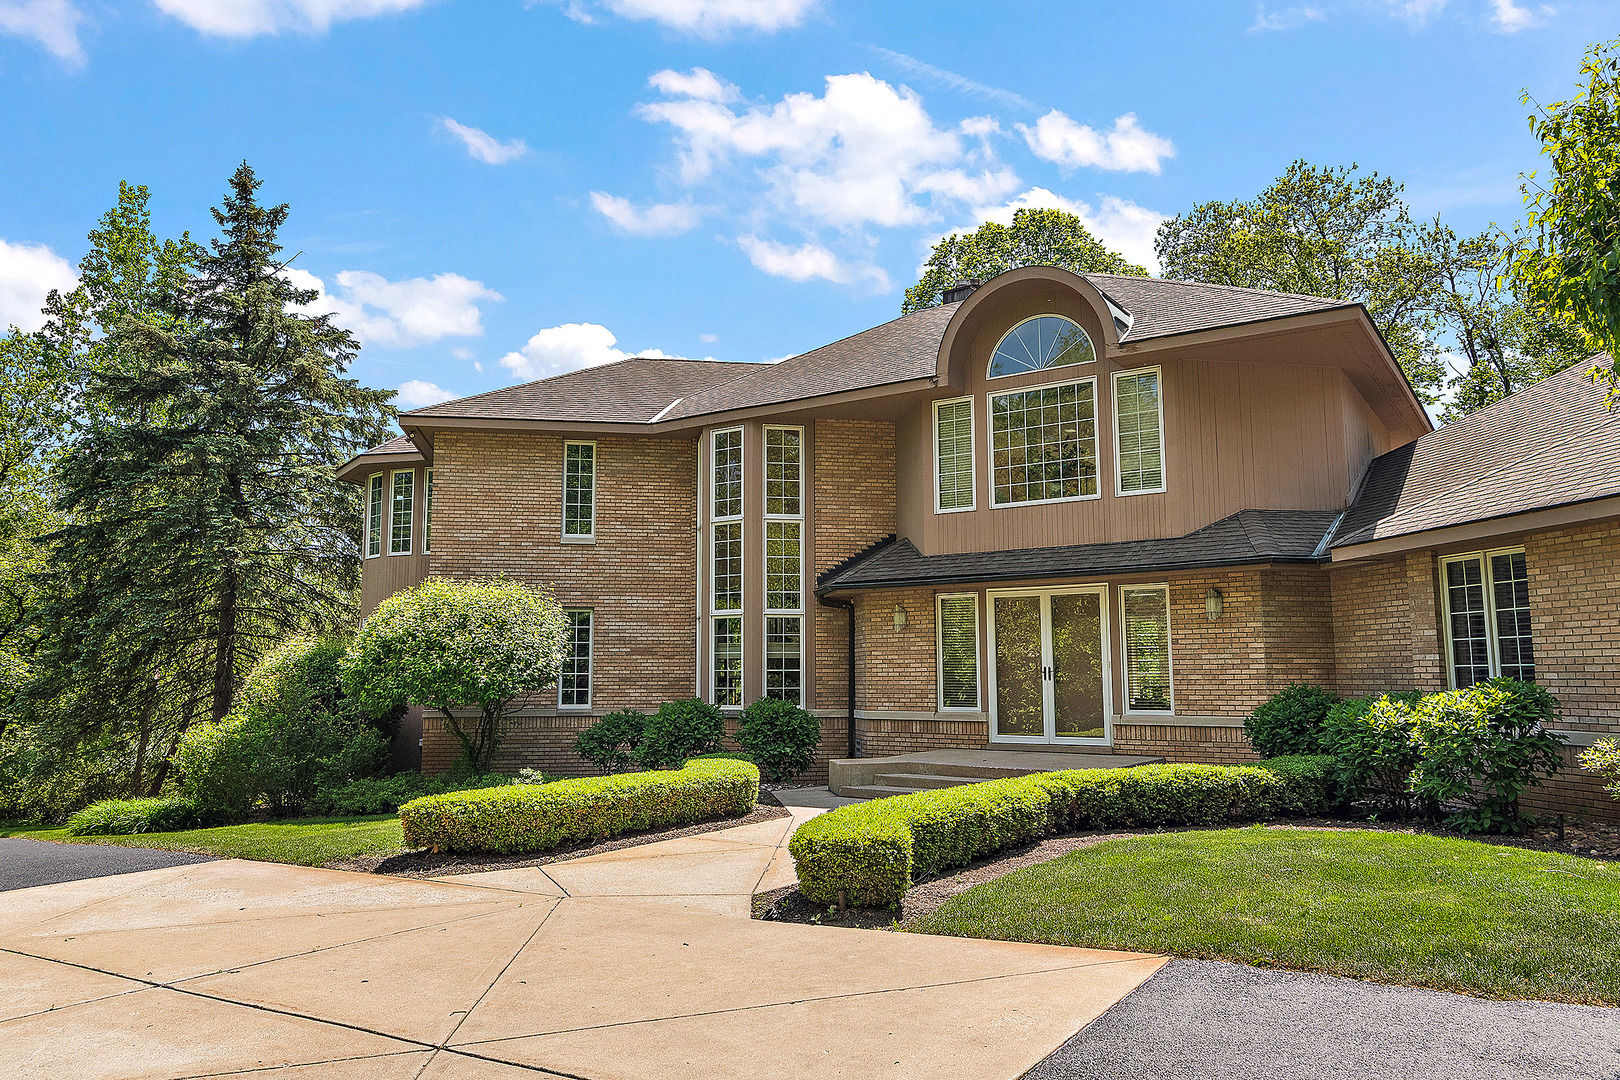
Property Description
OPPORTUNITY AWAITS IN CHARTWELL DOWNS! This amazing home situated on over 1.5 Acres is carved into one of South Chicagoland most prestigious, wooded communities. This structurally sound, one of a kind custom home with open floor plan was designed with the car enthusiast in mind as well as the owner seeking the function of flex space ideal for au pair or related living. Welcoming you into this truly one -of -a -kind estate is an incredible expansive foyer that opens into a sun filled family room with soaring ceilings, 3 sided fireplace and floor to ceiling windows providing panoramic views. Stunning limestone flooring flows through-out the main level and into a chefs dream gourmet kitchen featuring a with walk in pantry, high end built in appliances, 2 double ovens and warming drawers, enormous center island with ample seating, beautiful custom cabinetry, buffet and wine bar. The spacious dining area blends nicely into the kitchen allowing for the perfect setting for hosting large social gatherings. Main level provides a full ensuite with a private living room and private entrance. Also on the main level is a 3rd bedroom that has been converted to office space. Dramatic open staircase surrounded by floor to ceiling windows leads to upper level primary suite with true focus on privacy. This retreat offers fireplace, separate dressing areas, jacuzzi tub and an area for private work out space. Take advantage of a private screened in porch off the primary bedroom to enjoy all of natures finest views and wildlife. Upper level also includes a loft for reading and relaxing overlooking the family room and more stunning views. This lovely home continues to impress as you progress to the walk out lower level where you encounter a sitting area, gaming room, flex area with potential for wine cellar. Lower level also provides a 4th bedroom currently being used as an office, plus an additional room perfect for home theater with wet bar and a private exterior entrance. This custom home was built with uncompromising quality and highest attention to detail inside and out! Approximately 7000 sf of living space. Exterior details include a 38x18 heated inground pool, expansive patio areas, professionally landscaped grounds and circular drive. UPGRADES INCLUDE:5/8 drywall with 1 hour fire rating, 3 HVAC for comfort plus zone control, 400 amp electrical service, radiant heat flooring, 2 screened porches, lawn sprinkler system, concrete balcony, oversized solid core doors, 5+ car garage with radiant heat and floor drains ( 3 car on main level and 2.5 on lower level), wet bar rough in, custom cabinetry, Cavitat system and so much more! Priced below replacement value. Conveniently located just minutes from shopping, dining, METRA, expressway access, golf courses, parks, and schools.
Build Your Team
Quickly find investor-friendly professionals who can help you succeed in real estate investing at any stage of the investing journey.


Agents
Match with investor-friendly agents who can help you find, analyze, and close your next deal


Lenders
Get the best funding…find investor-friendly lenders who specialize in your deal strategy


Property Managers
Transition to passive investing. Find a trusted property management partnership that lasts.


Tax Pros & Accountants
Taxes and financial reporting made easy—find experts to create tax savings strategies, file taxes, and more
Location
Property Details
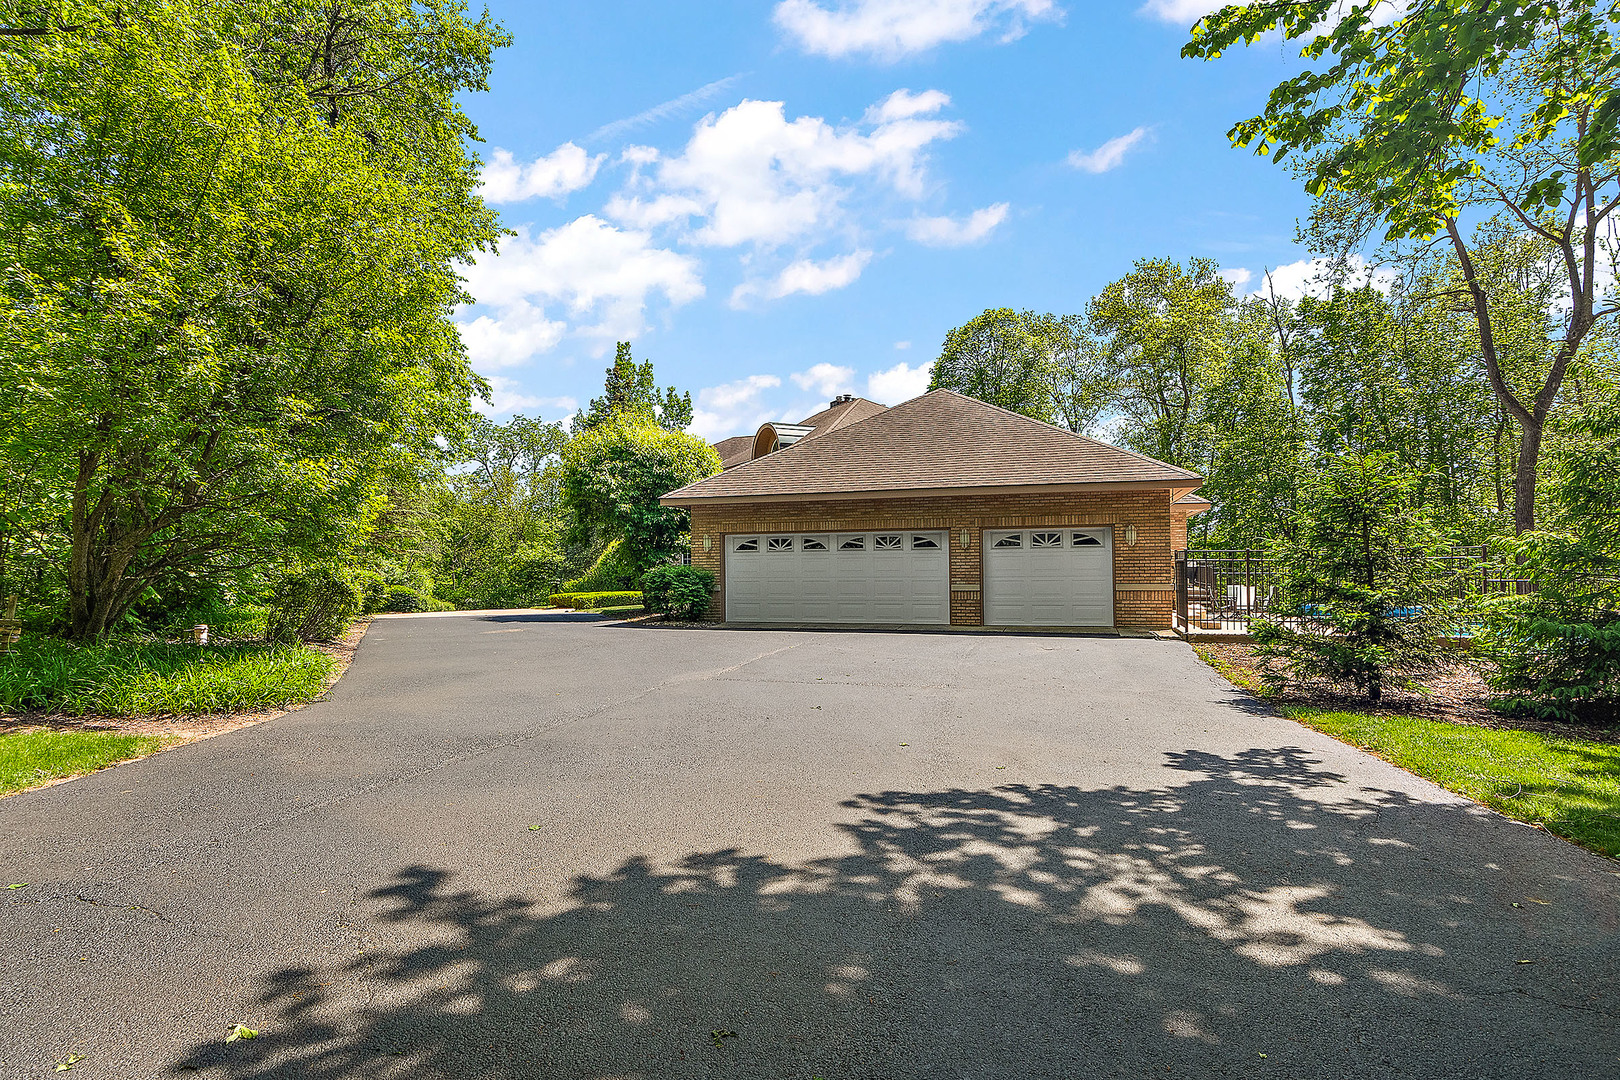
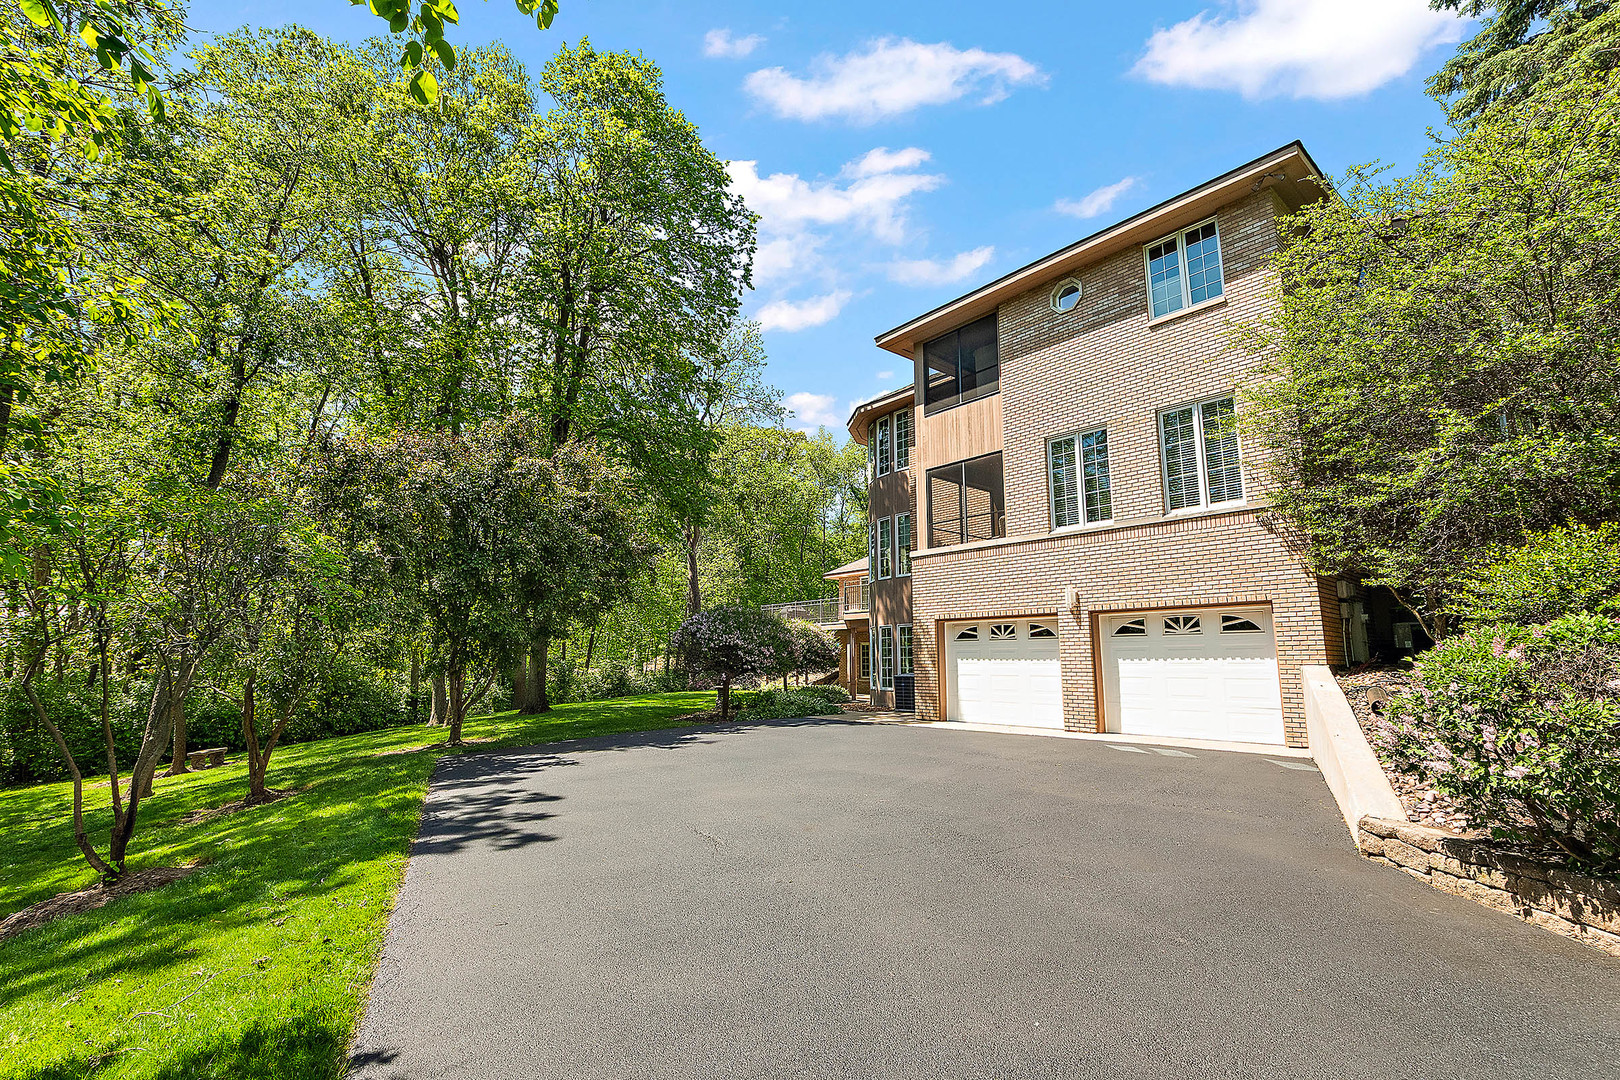
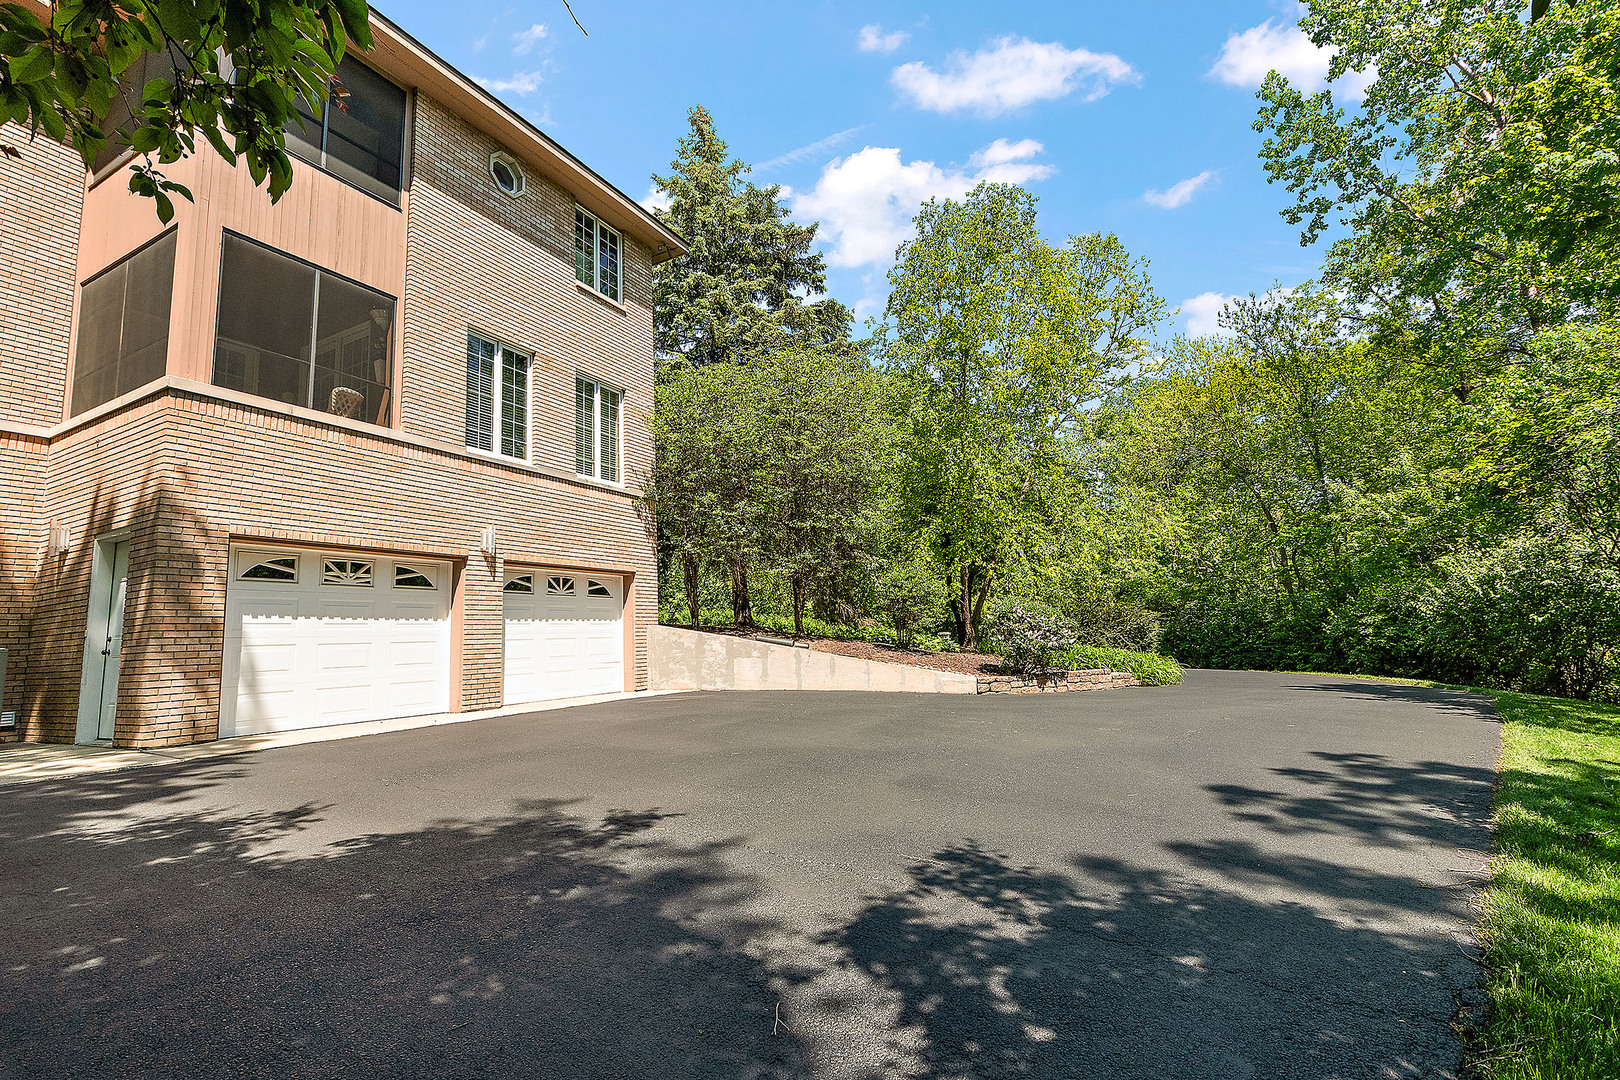
Parking
- Details: Asphalt, Garage Door Opener, Heated Garage, On Site, Attached, Garage
- Garage Spaces: 5
- Spaces Total: 5
Bedroom Information
- # of Bedrooms: 4
Bathroom Information
- # of Baths (Full): 3
- # of Baths (Total): 5.0
Interior Features
- # of Rooms: 14
- Basement: Yes
- Basement Description: Finished, Exterior Entry, Full, Walk-Out Access
- Fireplace: Yes
Exterior Features
- Foundation: Concrete Perimeter
- Roof Material: Asphalt
HOA
- Has HOA: Yes
- HOA Fee: $200/annually
Land Information
- Land Use: Residential
- Land Use Subtype: General - Single
Lot Information
- Parcel ID: 150814201007
- Lot Size: 0 sqft
Property Information
- Property Type: Single Family Residence
- Style: Traditional
- Year Built: 1992
Tax Information
- Annual Tax: $28,254
Utilities
- Water & Sewer: Well
- Heating: Natural Gas, Forced Air, Zoned
- Cooling: Central Air, Zoned
Location
- County: Will
Listing Details
Investment Summary
- Monthly Cash Flow
- -$1,675
- Cap Rate
- 3.6%
- Cash-on-Cash Return
- -8.8%
- Debt Coverage Ratio
- 0.64
- Internal Rate of Return (5 years)
- -4.6%
Cash Flow
Net Operating Income (NOI) minus mortgage payments.
Calculation:
NOI - Mortgage Payments
Cap Rate (Market Value)
Capitalization Rate is a rate of return that compares the yearly Net Operating Income (NOI) to the market value.
Calculation:
NOI / Market Value
Cash-on-Cash Return (CoC)
Annual Cash Flow / Cash Invested
Calculation:
Annual cash flow divided by initial cash invested.
Debt Coverage Ratio (DCR)
Net Operating Income (NOI) divided by total debt payments.
Calculation:
NOI / Total Debt Payments
Internal Rate of Return (IRR)
A metric for assessing profitability over time. IRR is the discount rate at which the net present value (NPV) of all future cash flows (positive and negative) from an investment equals zero — including both periodic cash flow (such as rent) and a projected sale at the end of the holding period. It represents the expected annualized return, accounting for income, expenses, and the recovery of capital through a future sale.
Purchase Details
Purchase PriceThe price paid for the property. Purchase price:
| $990,000 |
|---|---|
Amount FinancedThe amount of the purchase financed through a loan. Amount financed:
| -$792,000 |
Down paymentThe initial payment made towards the purchase. Down payment:
| $198,000 |
Closing CostsFees and expenses associated with purchasing a property, typically ranging from 2% to 5% of the home’s purchase price, paid at the end of a home purchase to cover services like lending, title transfer, and taxes. Closing costs:
| $29,700 |
Rehab CostsCosts incurred to repair or improve the property, including: roof, flooring, exterior siding, kitchen, exterior paint, bathrooms, etc. Rehab costs:
| $0 |
Initial Cash InvestedThe total initial cash invested in the property. Calculation:Down payment + Buying costs + Rehab costs Initial cash invested:
| $227,700 |
Square Feet (SQFT)The total square footage of the property. Square feet:
| 7,000 |
Cost Per Square FootCost per square foot of the property. Calculation:Purchase Price / Square Feet Cost per square foot:
| $141 |
Monthly Rent Per Square FootMonthly rent divided by the number of square feet. This ratio helps investors compare rental income efficiency across properties, markets, and unit sizes Calculation:Monthly Rent / Square Feet Monthly rent per square foot:
| $1.11 |
Financing Details
Loan AmountThe total sum of money borrowed from a lender to finance a property purchase. Calculation:Purchase Price - Down Payment
Loan amount:
| $792,000 |
|---|---|
Loan to Value Ratio (LTV)Loan amount divided by the market value of the property. Calculation:Loan Amount / Market Value
Loan to value ratio:
| 80.0% |
Loan TypeThe type of loan (e.g., fixed, adjustable).
Loan type:
| Amortizing |
TermThe loan repayment period in years.
Term:
| 30 years |
Interest RateThe percentage a lender charges on the borrowed amount of a loan, determining the cost of borrowing money.
Interest rate:
| 5.875% |
Principal & Interest (PI)The principal is the portion of the loan payment that reduces the loan balance. The interest is the lender's charge for borrowing money. Calculation:(P * r * (1 + r) ** n) / ((1 + r) ** n - 1) Where:
P = Loan amount (principal)
Principal & interest:
| $4,685 |
Property TaxesAnnual taxes levied by local governments on real estate properties. These taxes fund public services like schools, roads, and emergency services.
Property tax:
| $2,355 |
InsuranceThe costs for insurance coverage to protect against financial losses due to risks like fire, natural disasters, theft, liability, or tenant-related damages. Calculation:Assumes 7% of gross rental income, unless insurance rates are specified.
Insurance:
| $546 |
Private Mortgage Insurance (PMI)A fee that borrowers pay when they take out a conventional loan with a loan-to-value (LTV) ratio above 80%.
Private mortgage insurance (PMI):
| $0 |
Monthly PaymentThe fixed amount a borrower pays each month to repay a loan. It typically includes principal and interest (P&I) and may also cover property taxes, insurance, HOA fees, and PMI if escrowed. Monthly payment:
| $7,586 |
Operating Income
| % Rent | Monthly | Yearly | |
|---|---|---|---|
Gross RentThe total rental income received from tenants before deducting any expenses. Includes base rent, late fees, pet fees, parking fees, and other recurring charges.
Gross rent:
| $7,800 | $93,600 | |
Vacancy LossExpected loss of rent due to vacancies.
Vacancy loss:
(6%)
| 6% | -$468 | -$5,616 |
Operating IncomeGross rental income minus vacancy loss. Calculation:Gross rent - Vacancy loss
Operating income:
| $7,332 | $87,984 |
Operating Expenses
| % Rent | Monthly | Yearly | |
|---|---|---|---|
Property TaxesAnnual taxes levied by local governments on real estate properties. These taxes fund public services like schools, roads, and emergency services. | 30% | -$2,355 | -$28,254 |
InsuranceThe costs for insurance coverage to protect against financial losses due to risks like fire, natural disasters, theft, liability, or tenant-related damages. Calculation:Assumes 7% of gross rental income, unless insurance rates are specified. | 7% | -$546 | -$6,552 |
Property ManagementThe costs associated with hiring a property manager to handle the day-to-day operations of a rental property. Includes management fees, leasing fes, eviction fees, etc. Calculation:Assumes 8% of gross rental income. | 8% | -$624 | -$7,488 |
Repairs & MaintenanceOngoing costs for routine upkeep and minor fixes needed to keep a property in good working condition. Calculation:Assumes 5% of gross rental income. Varies by property age and condition. | 5% | -$390 | -$4,680 |
Capital ExpensesLarge, infrequent costs for major improvements or replacements, like a new roof, HVAC system, or appliances. Calculation:Assumes 5% of gross rental income. Varies by property age. | 5% | -$390 | -$4,680 |
HOA FeesRegular dues paid to a Homeowners Association for community maintenance, amenities, and management. Similar fees include: Condo Association Fees, Co-op Maintenance Fees, etc. | 0% | -$17 | -$204 |
Operating ExpensesRecurring costs required to maintain and manage a rental property, including property taxes, insurance, maintenance, repairs, utilities (if paid by the owner), property management fees, and other day-to-day expenses. Calculation:Insurance + Property Taxes + Property Management + Repairs & Maintenance + Capital Expenditures + HOA Fees | 55% | -$4,322 | -$51,858 |
Cash Flow
| Monthly | Yearly | |
|---|---|---|
Net Operating Income (NOI)The income generated from a property after deducting all operating expenses but before deducting mortgage payments, taxes, and capital expenditures. Calculation:Gross Operating Income - Operating Expenses
Net operating income:
| $3,010 | $36,120 |
Mortgage PaymentThe fixed amount a borrower pays each month to repay a loan. It typically includes principal and interest (P&I) and may also cover property taxes, insurance, HOA fees, and PMI if escrowed. | -$4,685 | -$56,220 |
Cash FlowNet Operating Income (NOI) minus mortgage payments. Calculation:NOI - Mortgage Payments | $1,675 | $20,100 |