
$995,000
Investment Summary
We noticed that HOA fees are missing—this is a standard expense and should be considered in your estimate.
- Monthly Cash Flow
- -$2,472
- Cap Rate
- 3.2%
- Cash-on-Cash Return
- -13.0%
- Debt Coverage Ratio
- 0.52
- Internal Rate of Return (5 years)
- -8.5%
Cash Flow
Net Operating Income (NOI) minus mortgage payments.
Calculation:
NOI - Mortgage Payments
Cap Rate (Market Value)
Capitalization Rate is a rate of return that compares the yearly Net Operating Income (NOI) to the market value.
Calculation:
NOI / Market Value
Cash-on-Cash Return (CoC)
Annual Cash Flow / Cash Invested
Calculation:
Annual cash flow divided by initial cash invested.
Debt Coverage Ratio (DCR)
Net Operating Income (NOI) divided by total debt payments.
Calculation:
NOI / Total Debt Payments
Internal Rate of Return (IRR)
A metric for assessing profitability over time. IRR is the discount rate at which the net present value (NPV) of all future cash flows (positive and negative) from an investment equals zero — including both periodic cash flow (such as rent) and a projected sale at the end of the holding period. It represents the expected annualized return, accounting for income, expenses, and the recovery of capital through a future sale.
Property Description
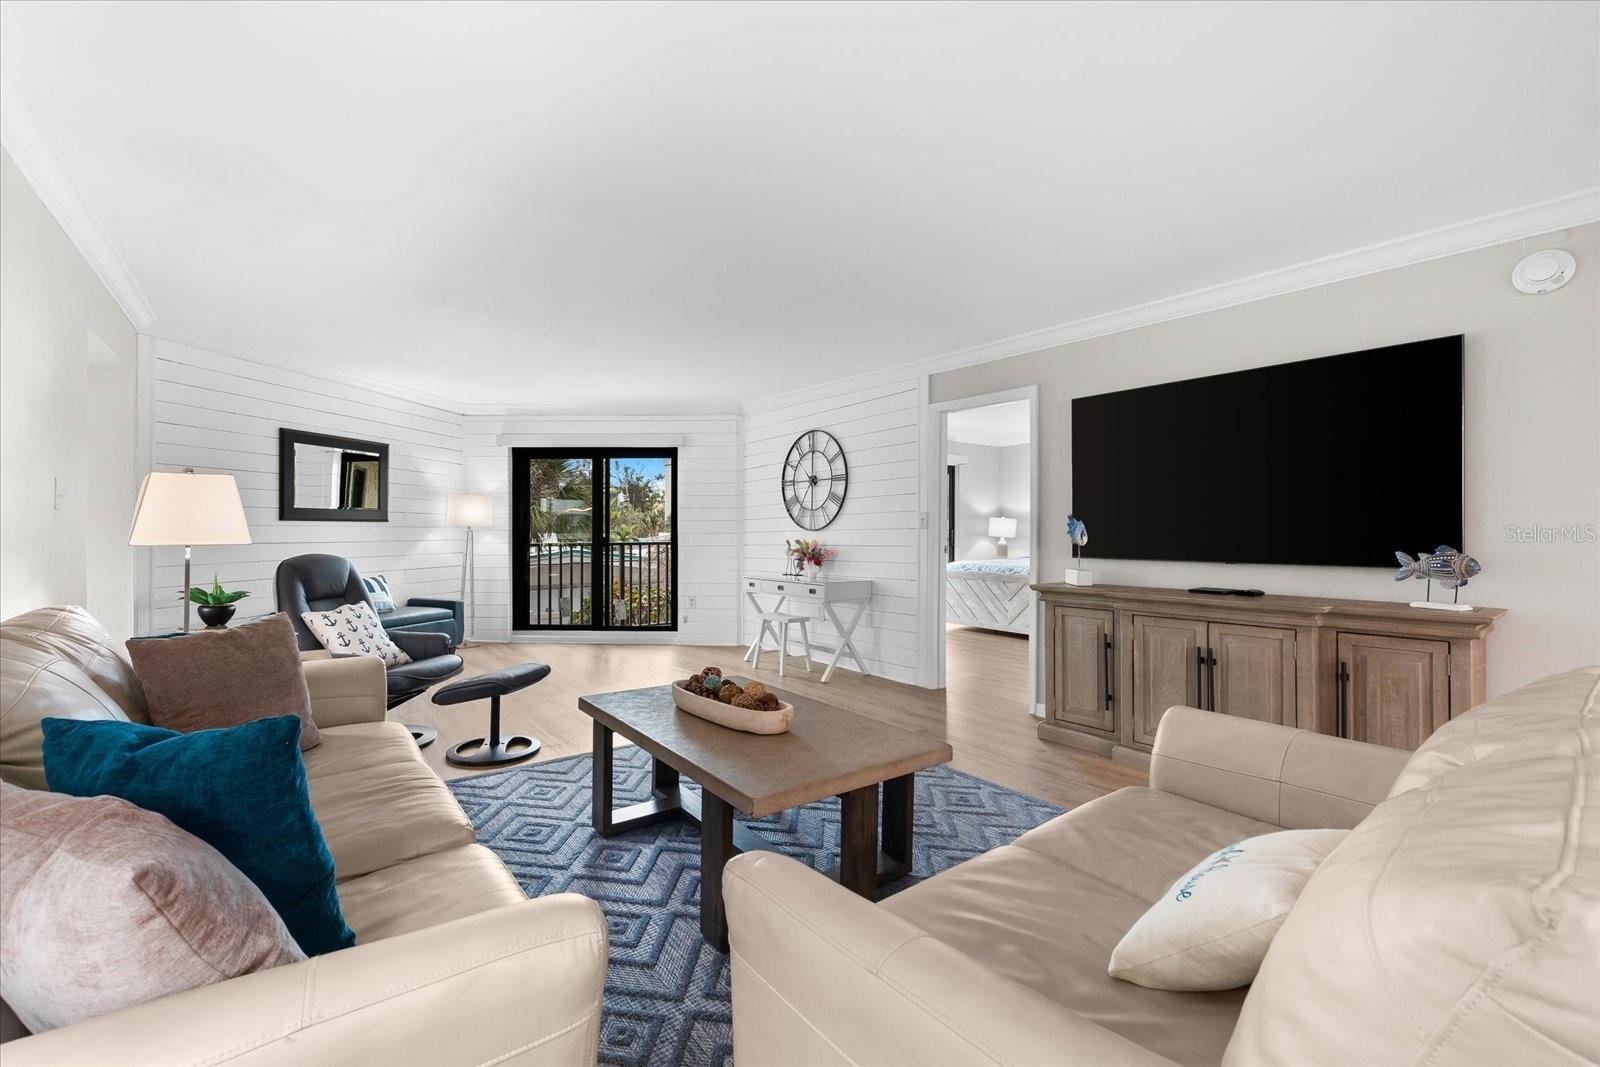
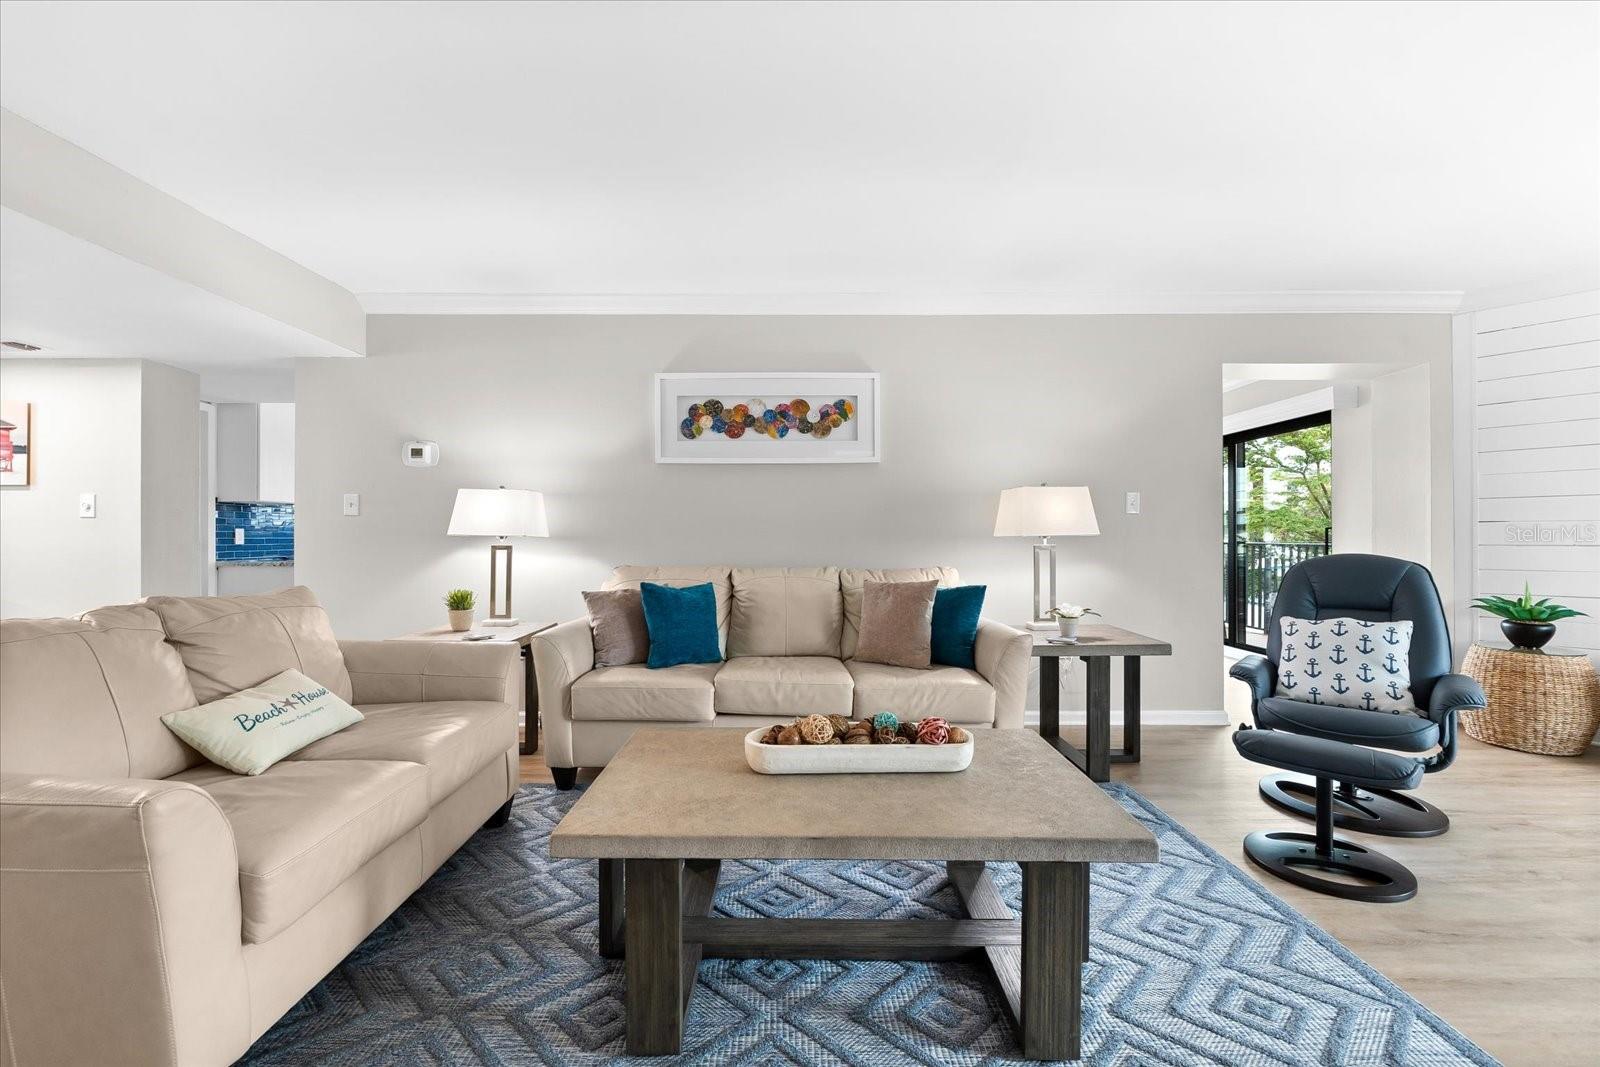
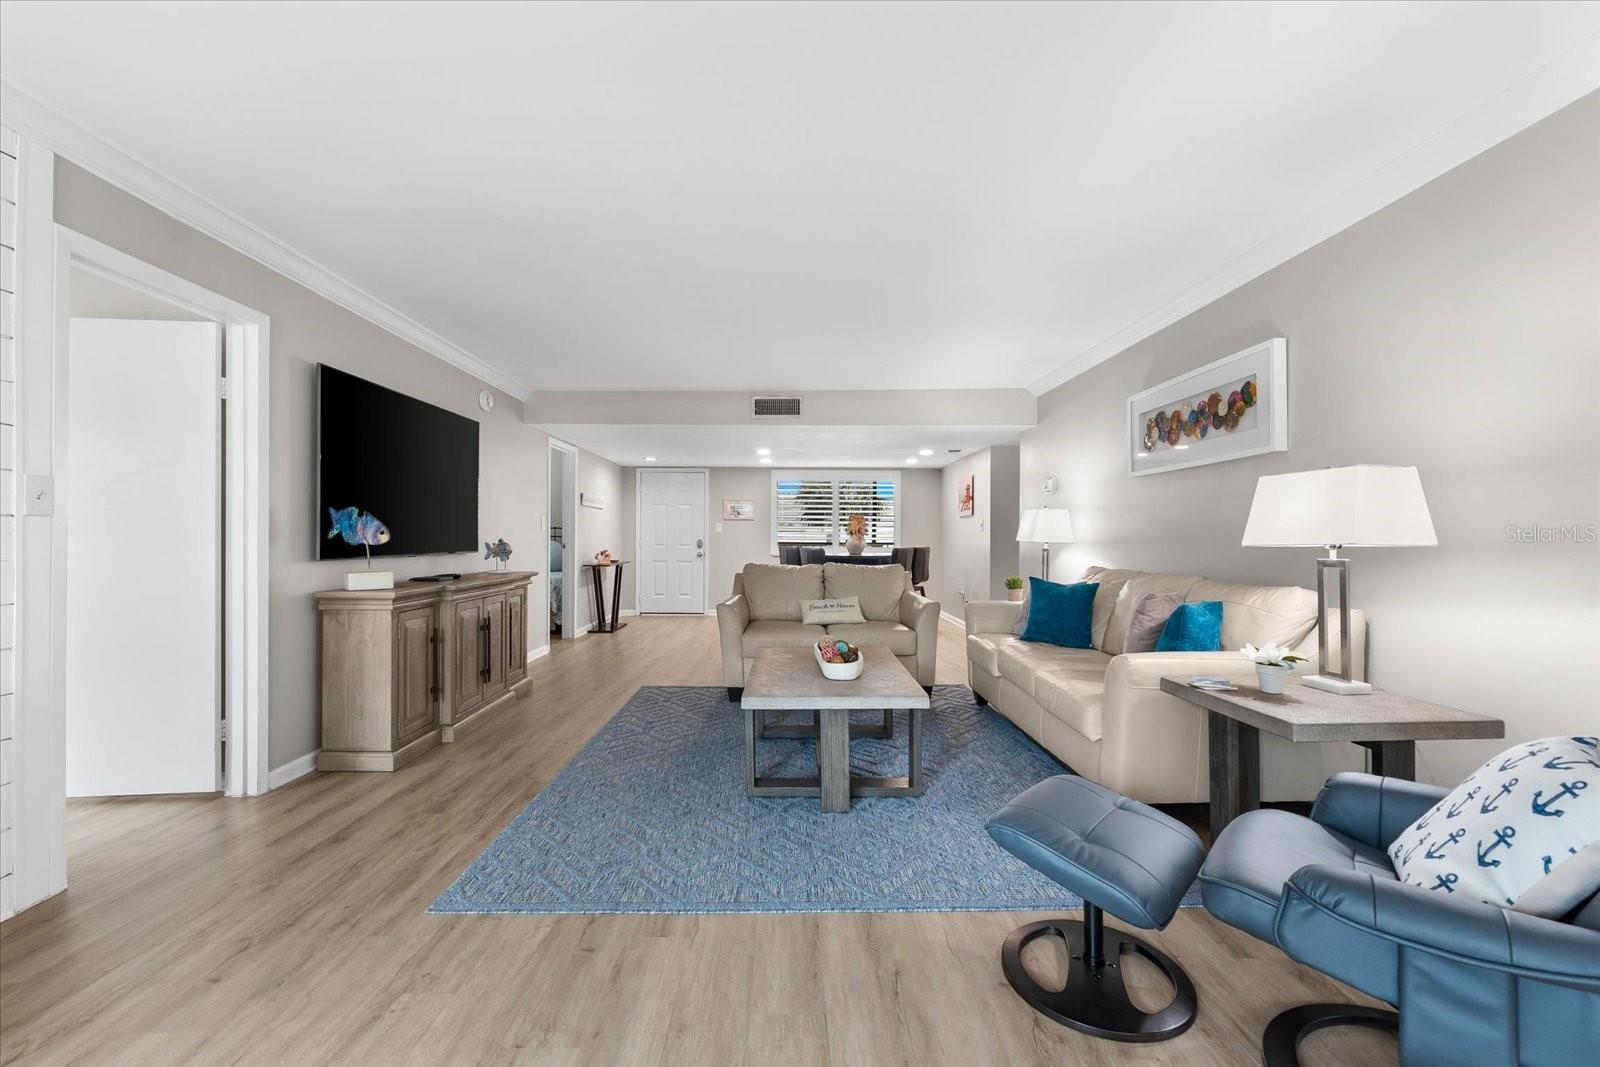
Beachfront Luxury Awaits at 101, El Presidente, Siesta Key located directly on the pristine silicon sand of Crescent Beach in the prestigious El Presidente complex. Step into coastal elegance and direct access with this beautifully remodeled two-bedroom, two-bathroom condo, 1766 sq ft gross living area, one of only 5 “Diplomat” models in this 48-unit Condominium. Considered a first-floor unit, 101 sits atop the dedicated parking area at ground level. A single short flight of stairs to your front door or elevator access. Perfect for families and guests, the dedicated raised walkways provide safe and secure access to the gulf side pool and beach access. The perfect beachfront retreat or investment property. El President features exclusive gulf coast living, resort-style amenities: heated pool, tennis court, pickleball area, and a owner fitness center. The gated complex with professional on-site management, allowing weekly rentals for exceptional rental income potential. Remodeled over the past 18 months in a contemporary, yet comfortable modern vibe, 101 updates feature a beautiful and large new kitchen, new appliances, granite countertops and an open attached private dining area for those special family and entertainment meals! Other updates include an upgraded electric panel service, new water heater (2022), all new furniture and large 85” TV in the main living room area. New master bedroom and Lanai furniture (2025). Unit 101 experienced no damage not even a drop of water, from the recent storms. Following the storms, a new highly efficient HVAC system and air handling system was installed in December 2024. magnificent HURRICAINE WINDOWS AND GLASS DOORS (4 sets) WERE INSTALLED January 2025! Safe Efficient and Quiet peace – wow ! Location Location Location ! Conveniently located near the south bridge for easy and fast access on and off the Key, and a short 5-minute walk to grocery, dining options, and cup or bowl of the famous clam chowder at Captain Curts. Free trolly services are available to Siesta Key Village and it’s lively dining and shopping scene at the north end of the Key. Downtown Sarasota’s cultural attractions are only minutes away, featuring the Ringling Museum of Art and the Sarasota Opera House to name a few. A partial assessment to support storm clean up efforts has already been paid, and the balance will be paid by the seller. A Milestone project has been underway well prior to the storms of 2024. Information and an update are available upon request. Whether you are searching for a luxurious vacation home or a high-performing rental investment, Unit 101 at El Presidente offers the best of Siesta Key living. Own a slice of paradise on the Gulf Coast! Call today for your private showing and experience this remarkable beachfront property firsthand!
Build Your Team
Quickly find investor-friendly professionals who can help you succeed in real estate investing at any stage of the investing journey.


Agents
Match with investor-friendly agents who can help you find, analyze, and close your next deal


Lenders
Get the best funding…find investor-friendly lenders who specialize in your deal strategy


Property Managers
Transition to passive investing. Find a trusted property management partnership that lasts.


Tax Pros & Accountants
Taxes and financial reporting made easy—find experts to create tax savings strategies, file taxes, and more
Location
Property Details
Parking
- Description: Assigned
- Details: Assigned
- Garage Spaces: 0
- Spaces Total: 0
Bedroom Information
- # of Bedrooms: 2
Bathroom Information
- # of Baths (Full): 2
- # of Baths (Total): 2.0
Interior Features
- # of Rooms: 5
- # of Stories: 1
Exterior Features
- Exterior Walls Materials: Stucco
- Foundation: Block, Concrete Perimeter
- Roof Type: Flat
- Roof Material: Concrete, Membrane
HOA
- Association: Peter Mazza
Land Information
- Land Use: Residential
- Land Use Subtype: Condominium Unit
Lot Information
- Parcel ID: 0108012001
- Lot Size: 0 sqft
Property Information
- Property Type: Condominium
- Year Built: 1975
Tax Information
- Annual Tax: $10,721
Utilities
- Water & Sewer: Public
- Heating: Central, Electric
- Cooling: Central Air
Location
- County: Sarasota
Listing Details
Investment Summary
We noticed that HOA fees are missing—this is a standard expense and should be considered in your estimate.
- Monthly Cash Flow
- -$2,472
- Cap Rate
- 3.2%
- Cash-on-Cash Return
- -13.0%
- Debt Coverage Ratio
- 0.52
- Internal Rate of Return (5 years)
- -8.5%
Cash Flow
Net Operating Income (NOI) minus mortgage payments.
Calculation:
NOI - Mortgage Payments
Cap Rate (Market Value)
Capitalization Rate is a rate of return that compares the yearly Net Operating Income (NOI) to the market value.
Calculation:
NOI / Market Value
Cash-on-Cash Return (CoC)
Annual Cash Flow / Cash Invested
Calculation:
Annual cash flow divided by initial cash invested.
Debt Coverage Ratio (DCR)
Net Operating Income (NOI) divided by total debt payments.
Calculation:
NOI / Total Debt Payments
Internal Rate of Return (IRR)
A metric for assessing profitability over time. IRR is the discount rate at which the net present value (NPV) of all future cash flows (positive and negative) from an investment equals zero — including both periodic cash flow (such as rent) and a projected sale at the end of the holding period. It represents the expected annualized return, accounting for income, expenses, and the recovery of capital through a future sale.
Purchase Details
Purchase PriceThe price paid for the property. Purchase price:
| $995,000 |
|---|---|
Amount FinancedThe amount of the purchase financed through a loan. Amount financed:
| -$796,000 |
Down paymentThe initial payment made towards the purchase. Down payment:
| $199,000 |
Closing CostsFees and expenses associated with purchasing a property, typically ranging from 2% to 5% of the home’s purchase price, paid at the end of a home purchase to cover services like lending, title transfer, and taxes. Closing costs:
| $29,850 |
Rehab CostsCosts incurred to repair or improve the property, including: roof, flooring, exterior siding, kitchen, exterior paint, bathrooms, etc. Rehab costs:
| $0 |
Initial Cash InvestedThe total initial cash invested in the property. Calculation:Down payment + Buying costs + Rehab costs Initial cash invested:
| $228,850 |
Square Feet (SQFT)The total square footage of the property. Square feet:
| 1,496 |
Cost Per Square FootCost per square foot of the property. Calculation:Purchase Price / Square Feet Cost per square foot:
| $665 |
Monthly Rent Per Square FootMonthly rent divided by the number of square feet. This ratio helps investors compare rental income efficiency across properties, markets, and unit sizes Calculation:Monthly Rent / Square Feet Monthly rent per square foot:
| $3.41 |
Financing Details
Loan AmountThe total sum of money borrowed from a lender to finance a property purchase. Calculation:Purchase Price - Down Payment
Loan amount:
| $796,000 |
|---|---|
Loan to Value Ratio (LTV)Loan amount divided by the market value of the property. Calculation:Loan Amount / Market Value
Loan to value ratio:
| 80.0% |
Loan TypeThe type of loan (e.g., fixed, adjustable).
Loan type:
| Amortizing |
TermThe loan repayment period in years.
Term:
| 30 years |
Interest RateThe percentage a lender charges on the borrowed amount of a loan, determining the cost of borrowing money.
Interest rate:
| 6.625% |
Principal & Interest (PI)The principal is the portion of the loan payment that reduces the loan balance. The interest is the lender's charge for borrowing money. Calculation:(P * r * (1 + r) ** n) / ((1 + r) ** n - 1) Where:
P = Loan amount (principal)
Principal & interest:
| $5,097 |
Property TaxesAnnual taxes levied by local governments on real estate properties. These taxes fund public services like schools, roads, and emergency services.
Property tax:
| $894 |
InsuranceThe costs for insurance coverage to protect against financial losses due to risks like fire, natural disasters, theft, liability, or tenant-related damages. Calculation:Assumes 7% of gross rental income, unless insurance rates are specified.
Insurance:
| $357 |
Private Mortgage Insurance (PMI)A fee that borrowers pay when they take out a conventional loan with a loan-to-value (LTV) ratio above 80%.
Private mortgage insurance (PMI):
| $0 |
Monthly PaymentThe fixed amount a borrower pays each month to repay a loan. It typically includes principal and interest (P&I) and may also cover property taxes, insurance, HOA fees, and PMI if escrowed. Monthly payment:
| $6,348 |
Operating Income
| % Rent | Monthly | Yearly | |
|---|---|---|---|
Gross RentThe total rental income received from tenants before deducting any expenses. Includes base rent, late fees, pet fees, parking fees, and other recurring charges.
Gross rent:
| $5,100 | $61,200 | |
Vacancy LossExpected loss of rent due to vacancies.
Vacancy loss:
(6%)
| 6% | -$306 | -$3,672 |
Operating IncomeGross rental income minus vacancy loss. Calculation:Gross rent - Vacancy loss
Operating income:
| $4,794 | $57,528 |
Operating Expenses
| % Rent | Monthly | Yearly | |
|---|---|---|---|
Property TaxesAnnual taxes levied by local governments on real estate properties. These taxes fund public services like schools, roads, and emergency services. | 18% | -$894 | -$10,722 |
InsuranceThe costs for insurance coverage to protect against financial losses due to risks like fire, natural disasters, theft, liability, or tenant-related damages. Calculation:Assumes 7% of gross rental income, unless insurance rates are specified. | 7% | -$357 | -$4,284 |
Property ManagementThe costs associated with hiring a property manager to handle the day-to-day operations of a rental property. Includes management fees, leasing fes, eviction fees, etc. Calculation:Assumes 8% of gross rental income. | 8% | -$408 | -$4,896 |
Repairs & MaintenanceOngoing costs for routine upkeep and minor fixes needed to keep a property in good working condition. Calculation:Assumes 5% of gross rental income. Varies by property age and condition. | 5% | -$255 | -$3,060 |
Capital ExpensesLarge, infrequent costs for major improvements or replacements, like a new roof, HVAC system, or appliances. Calculation:Assumes 5% of gross rental income. Varies by property age. | 5% | -$255 | -$3,060 |
HOA FeesRegular dues paid to a Homeowners Association for community maintenance, amenities, and management. Similar fees include: Condo Association Fees, Co-op Maintenance Fees, etc. | n/a | n/a | n/a |
Operating ExpensesRecurring costs required to maintain and manage a rental property, including property taxes, insurance, maintenance, repairs, utilities (if paid by the owner), property management fees, and other day-to-day expenses. Calculation:Insurance + Property Taxes + Property Management + Repairs & Maintenance + Capital Expenditures + HOA Fees | 43% | -$2,169 | -$26,022 |
Cash Flow
| Monthly | Yearly | |
|---|---|---|
Net Operating Income (NOI)The income generated from a property after deducting all operating expenses but before deducting mortgage payments, taxes, and capital expenditures. Calculation:Gross Operating Income - Operating Expenses
Net operating income:
| $2,625 | $31,500 |
Mortgage PaymentThe fixed amount a borrower pays each month to repay a loan. It typically includes principal and interest (P&I) and may also cover property taxes, insurance, HOA fees, and PMI if escrowed. | -$5,097 | -$61,164 |
Cash FlowNet Operating Income (NOI) minus mortgage payments. Calculation:NOI - Mortgage Payments | $2,472 | $29,664 |