$445,000
Investment Summary
- Monthly Cash Flow
- -$1,434
- Cap Rate
- 2.3%
- Cash-on-Cash Return
- -16.8%
- Debt Coverage Ratio
- 0.37
- Internal Rate of Return (5 years)
- -12.3%
Cash Flow
Net Operating Income (NOI) minus mortgage payments.
Calculation:
NOI - Mortgage Payments
Cap Rate (Market Value)
Capitalization Rate is a rate of return that compares the yearly Net Operating Income (NOI) to the market value.
Calculation:
NOI / Market Value
Cash-on-Cash Return (CoC)
Annual Cash Flow / Cash Invested
Calculation:
Annual cash flow divided by initial cash invested.
Debt Coverage Ratio (DCR)
Net Operating Income (NOI) divided by total debt payments.
Calculation:
NOI / Total Debt Payments
Internal Rate of Return (IRR)
A metric for assessing profitability over time. IRR is the discount rate at which the net present value (NPV) of all future cash flows (positive and negative) from an investment equals zero — including both periodic cash flow (such as rent) and a projected sale at the end of the holding period. It represents the expected annualized return, accounting for income, expenses, and the recovery of capital through a future sale.
Property Description
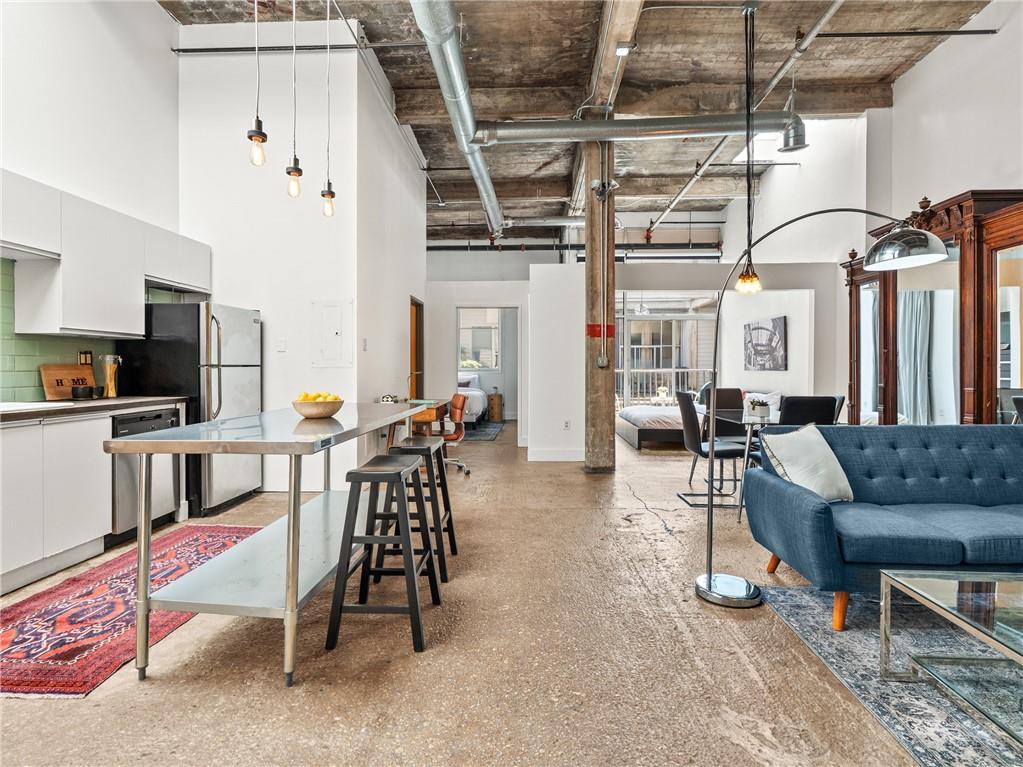
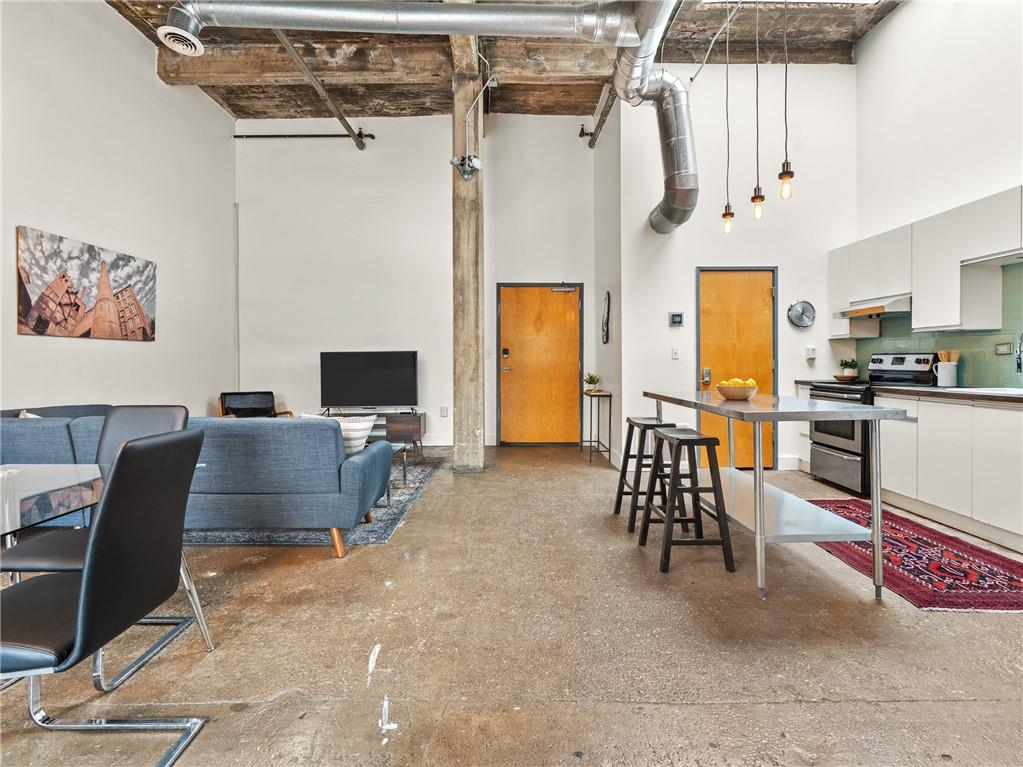
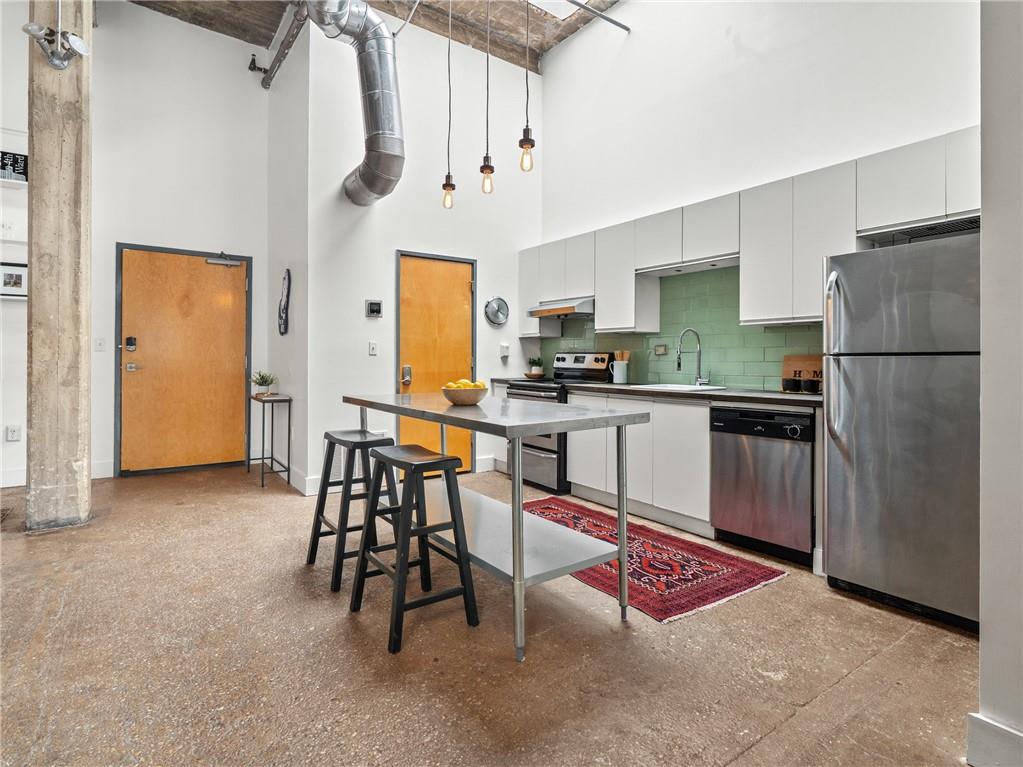
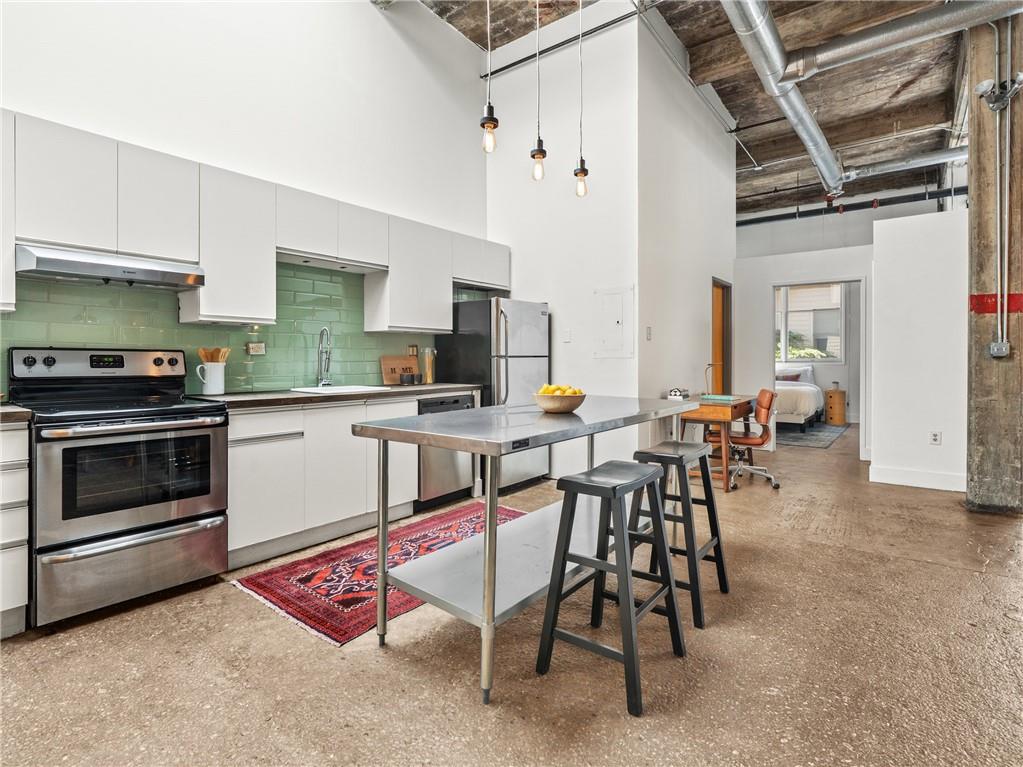
Welcome to Studioplex! This is the rare opportunity you've been looking for to experience the ultimate in life on the Atlanta Beltline along its highly coveted Eastside Trail. The best part? It's all right outside your door. Located in Old Fourth Ward, the Studioplex building was built in the early 1900s as the Southeastern Cotton Warehouse. Studioplex is a historic building and registered on the National Register of Historic Places ((NRHP). The iconic space has been reimagined into a dynamic blend of architecture, community, and contemporary lifestyle. Studioplex offers direct community access to the Eastside Trail and all it has to offer with SPX Alley - The James Room, Shake Shack, Jeni’s Ice Cream and Bell Street Burritos to name just a few. Cross the street to Krog Market (rated the number one food market in the US in Newsweek) for endless dining options, such as the nationally ranked Gu’s and Fred’s Meat and Bread (Michelin Star) along with many other choices. Head on down the Beltline to Inman Park and choose from nationally ranked Rathbun Steak, Ladybird and Painted Park. Highland Avenue and all its fine dining and shopping options are all also right there – mere minutes away. No driving, no parking and no hassle. As you continue down the Eastside trail, you'll have access to a full-size Kroger and Ponce City Market, ranked number 3 by Newsweek for America's top food markets. Here you'll find countless dining opportunities where James Beard award winning chefs like Anne Quatrano and Linton Hopkins fill the stalls. And that's not all - Atlanta's hallmark Piedmont Park is just ?down the trail. Studioplex is not just another loft - it is your city retreat. It’s the ultimate creative work-meets-life space that represents the quintessential urban Atlanta lifestyle. This upper-level unit embraces its industrial roots with soaring 20' concrete ceilings, polished floors, and striking pillars, creating a dramatic yet inviting living space flooded with natural light. The open-concept kitchen features a full wall of cabinetry and seamlessly connects to the spacious living and flexible dining areas—perfect for both everyday living and entertaining. Both bedrooms overlook the central courtyard of one of Atlanta’s most iconic loft communities. A generously sized laundry room offers added functionality with floor to ceiling storage and upper shelving. You'll have your own assigned parking space next to the building entrance from the parking garage, but with the BeltLine just outside your door, you don't need a car to have fun. You’re always just m?inutes away from top dining, shopping, and all the O4W and Inman Park neighborhoods have to offe?r, right at your doorstep. At Studioplex, the ultimate Beltline experience on the vibrant Eastside Trail is always at your fingertips.
Build Your Team
Quickly find investor-friendly professionals who can help you succeed in real estate investing at any stage of the investing journey.


Agents
Match with investor-friendly agents who can help you find, analyze, and close your next deal


Lenders
Get the best funding…find investor-friendly lenders who specialize in your deal strategy


Property Managers
Transition to passive investing. Find a trusted property management partnership that lasts.


Tax Pros & Accountants
Taxes and financial reporting made easy—find experts to create tax savings strategies, file taxes, and more
Location
Property Details
Parking
- Description: Assigned
- Details: Assigned
- Garage Spaces: 0
- Spaces Total: 1
Bedroom Information
- # of Bedrooms: 2
Bathroom Information
- # of Baths (Full): 1
- # of Baths (Total): 1.0
Interior Features
- # of Rooms: 3
- # of Stories: 1
- Basement Description: None
Exterior Features
- Exterior Walls Materials: Rock, Stone
- Foundation: Slab
- Roof Material: Other
HOA
- Has HOA: Yes
- HOA Fee: $283/monthly
Land Information
- Land Use: Residential
- Land Use Subtype: Condominium Unit
Lot Information
- Parcel ID: 14001900101832
- Lot Size: 0 sqft
Property Information
- Property Type: Condominium
- Style: Other
- Year Built: 1925
Tax Information
- Annual Tax: $7,146
Utilities
- Water & Sewer: Public
- Heating: Central
- Cooling: Central Air
Location
- County: Fulton
Listing Details
Investment Summary
- Monthly Cash Flow
- -$1,434
- Cap Rate
- 2.3%
- Cash-on-Cash Return
- -16.8%
- Debt Coverage Ratio
- 0.37
- Internal Rate of Return (5 years)
- -12.3%
Cash Flow
Net Operating Income (NOI) minus mortgage payments.
Calculation:
NOI - Mortgage Payments
Cap Rate (Market Value)
Capitalization Rate is a rate of return that compares the yearly Net Operating Income (NOI) to the market value.
Calculation:
NOI / Market Value
Cash-on-Cash Return (CoC)
Annual Cash Flow / Cash Invested
Calculation:
Annual cash flow divided by initial cash invested.
Debt Coverage Ratio (DCR)
Net Operating Income (NOI) divided by total debt payments.
Calculation:
NOI / Total Debt Payments
Internal Rate of Return (IRR)
A metric for assessing profitability over time. IRR is the discount rate at which the net present value (NPV) of all future cash flows (positive and negative) from an investment equals zero — including both periodic cash flow (such as rent) and a projected sale at the end of the holding period. It represents the expected annualized return, accounting for income, expenses, and the recovery of capital through a future sale.
Purchase Details
Purchase PriceThe price paid for the property. Purchase price:
| $445,000 |
|---|---|
Amount FinancedThe amount of the purchase financed through a loan. Amount financed:
| -$356,000 |
Down paymentThe initial payment made towards the purchase. Down payment:
| $89,000 |
Closing CostsFees and expenses associated with purchasing a property, typically ranging from 2% to 5% of the home’s purchase price, paid at the end of a home purchase to cover services like lending, title transfer, and taxes. Closing costs:
| $13,350 |
Rehab CostsCosts incurred to repair or improve the property, including: roof, flooring, exterior siding, kitchen, exterior paint, bathrooms, etc. Rehab costs:
| $0 |
Initial Cash InvestedThe total initial cash invested in the property. Calculation:Down payment + Buying costs + Rehab costs Initial cash invested:
| $102,350 |
Square Feet (SQFT)The total square footage of the property. Square feet:
| 985 |
Cost Per Square FootCost per square foot of the property. Calculation:Purchase Price / Square Feet Cost per square foot:
| $452 |
Monthly Rent Per Square FootMonthly rent divided by the number of square feet. This ratio helps investors compare rental income efficiency across properties, markets, and unit sizes Calculation:Monthly Rent / Square Feet Monthly rent per square foot:
| $2.54 |
Financing Details
Loan AmountThe total sum of money borrowed from a lender to finance a property purchase. Calculation:Purchase Price - Down Payment
Loan amount:
| $356,000 |
|---|---|
Loan to Value Ratio (LTV)Loan amount divided by the market value of the property. Calculation:Loan Amount / Market Value
Loan to value ratio:
| 80.0% |
Loan TypeThe type of loan (e.g., fixed, adjustable).
Loan type:
| Amortizing |
TermThe loan repayment period in years.
Term:
| 30 years |
Interest RateThe percentage a lender charges on the borrowed amount of a loan, determining the cost of borrowing money.
Interest rate:
| 6.625% |
Principal & Interest (PI)The principal is the portion of the loan payment that reduces the loan balance. The interest is the lender's charge for borrowing money. Calculation:(P * r * (1 + r) ** n) / ((1 + r) ** n - 1) Where:
P = Loan amount (principal)
Principal & interest:
| $2,280 |
Property TaxesAnnual taxes levied by local governments on real estate properties. These taxes fund public services like schools, roads, and emergency services.
Property tax:
| $596 |
InsuranceThe costs for insurance coverage to protect against financial losses due to risks like fire, natural disasters, theft, liability, or tenant-related damages. Calculation:Assumes 7% of gross rental income, unless insurance rates are specified.
Insurance:
| $175 |
Private Mortgage Insurance (PMI)A fee that borrowers pay when they take out a conventional loan with a loan-to-value (LTV) ratio above 80%.
Private mortgage insurance (PMI):
| $0 |
Monthly PaymentThe fixed amount a borrower pays each month to repay a loan. It typically includes principal and interest (P&I) and may also cover property taxes, insurance, HOA fees, and PMI if escrowed. Monthly payment:
| $3,051 |
Operating Income
| % Rent | Monthly | Yearly | |
|---|---|---|---|
Gross RentThe total rental income received from tenants before deducting any expenses. Includes base rent, late fees, pet fees, parking fees, and other recurring charges.
Gross rent:
| $2,500 | $30,000 | |
Vacancy LossExpected loss of rent due to vacancies.
Vacancy loss:
(6%)
| 6% | -$150 | -$1,800 |
Operating IncomeGross rental income minus vacancy loss. Calculation:Gross rent - Vacancy loss
Operating income:
| $2,350 | $28,200 |
Operating Expenses
| % Rent | Monthly | Yearly | |
|---|---|---|---|
Property TaxesAnnual taxes levied by local governments on real estate properties. These taxes fund public services like schools, roads, and emergency services. | 24% | -$596 | -$7,146 |
InsuranceThe costs for insurance coverage to protect against financial losses due to risks like fire, natural disasters, theft, liability, or tenant-related damages. Calculation:Assumes 7% of gross rental income, unless insurance rates are specified. | 7% | -$175 | -$2,100 |
Property ManagementThe costs associated with hiring a property manager to handle the day-to-day operations of a rental property. Includes management fees, leasing fes, eviction fees, etc. Calculation:Assumes 8% of gross rental income. | 8% | -$200 | -$2,400 |
Repairs & MaintenanceOngoing costs for routine upkeep and minor fixes needed to keep a property in good working condition. Calculation:Assumes 5% of gross rental income. Varies by property age and condition. | 5% | -$125 | -$1,500 |
Capital ExpensesLarge, infrequent costs for major improvements or replacements, like a new roof, HVAC system, or appliances. Calculation:Assumes 5% of gross rental income. Varies by property age. | 5% | -$125 | -$1,500 |
HOA FeesRegular dues paid to a Homeowners Association for community maintenance, amenities, and management. Similar fees include: Condo Association Fees, Co-op Maintenance Fees, etc. | 11% | -$283 | -$3,396 |
Operating ExpensesRecurring costs required to maintain and manage a rental property, including property taxes, insurance, maintenance, repairs, utilities (if paid by the owner), property management fees, and other day-to-day expenses. Calculation:Insurance + Property Taxes + Property Management + Repairs & Maintenance + Capital Expenditures + HOA Fees | 60% | -$1,504 | -$18,042 |
Cash Flow
| Monthly | Yearly | |
|---|---|---|
Net Operating Income (NOI)The income generated from a property after deducting all operating expenses but before deducting mortgage payments, taxes, and capital expenditures. Calculation:Gross Operating Income - Operating Expenses
Net operating income:
| $846 | $10,152 |
Mortgage PaymentThe fixed amount a borrower pays each month to repay a loan. It typically includes principal and interest (P&I) and may also cover property taxes, insurance, HOA fees, and PMI if escrowed. | -$2,280 | -$27,360 |
Cash FlowNet Operating Income (NOI) minus mortgage payments. Calculation:NOI - Mortgage Payments | -$1,434 | -$17,208 |