
$1,015,000
Investment Summary
- Monthly Cash Flow
- -$2,597
- Cap Rate
- 3.2%
- Cash-on-Cash Return
- -13.3%
- Debt Coverage Ratio
- 0.51
- Internal Rate of Return (5 years)
- -8.9%
Cash Flow
Net Operating Income (NOI) minus mortgage payments.
Calculation:
NOI - Mortgage Payments
Cap Rate (Market Value)
Capitalization Rate is a rate of return that compares the yearly Net Operating Income (NOI) to the market value.
Calculation:
NOI / Market Value
Cash-on-Cash Return (CoC)
Annual Cash Flow / Cash Invested
Calculation:
Annual cash flow divided by initial cash invested.
Debt Coverage Ratio (DCR)
Net Operating Income (NOI) divided by total debt payments.
Calculation:
NOI / Total Debt Payments
Internal Rate of Return (IRR)
A metric for assessing profitability over time. IRR is the discount rate at which the net present value (NPV) of all future cash flows (positive and negative) from an investment equals zero — including both periodic cash flow (such as rent) and a projected sale at the end of the holding period. It represents the expected annualized return, accounting for income, expenses, and the recovery of capital through a future sale.
Property Description
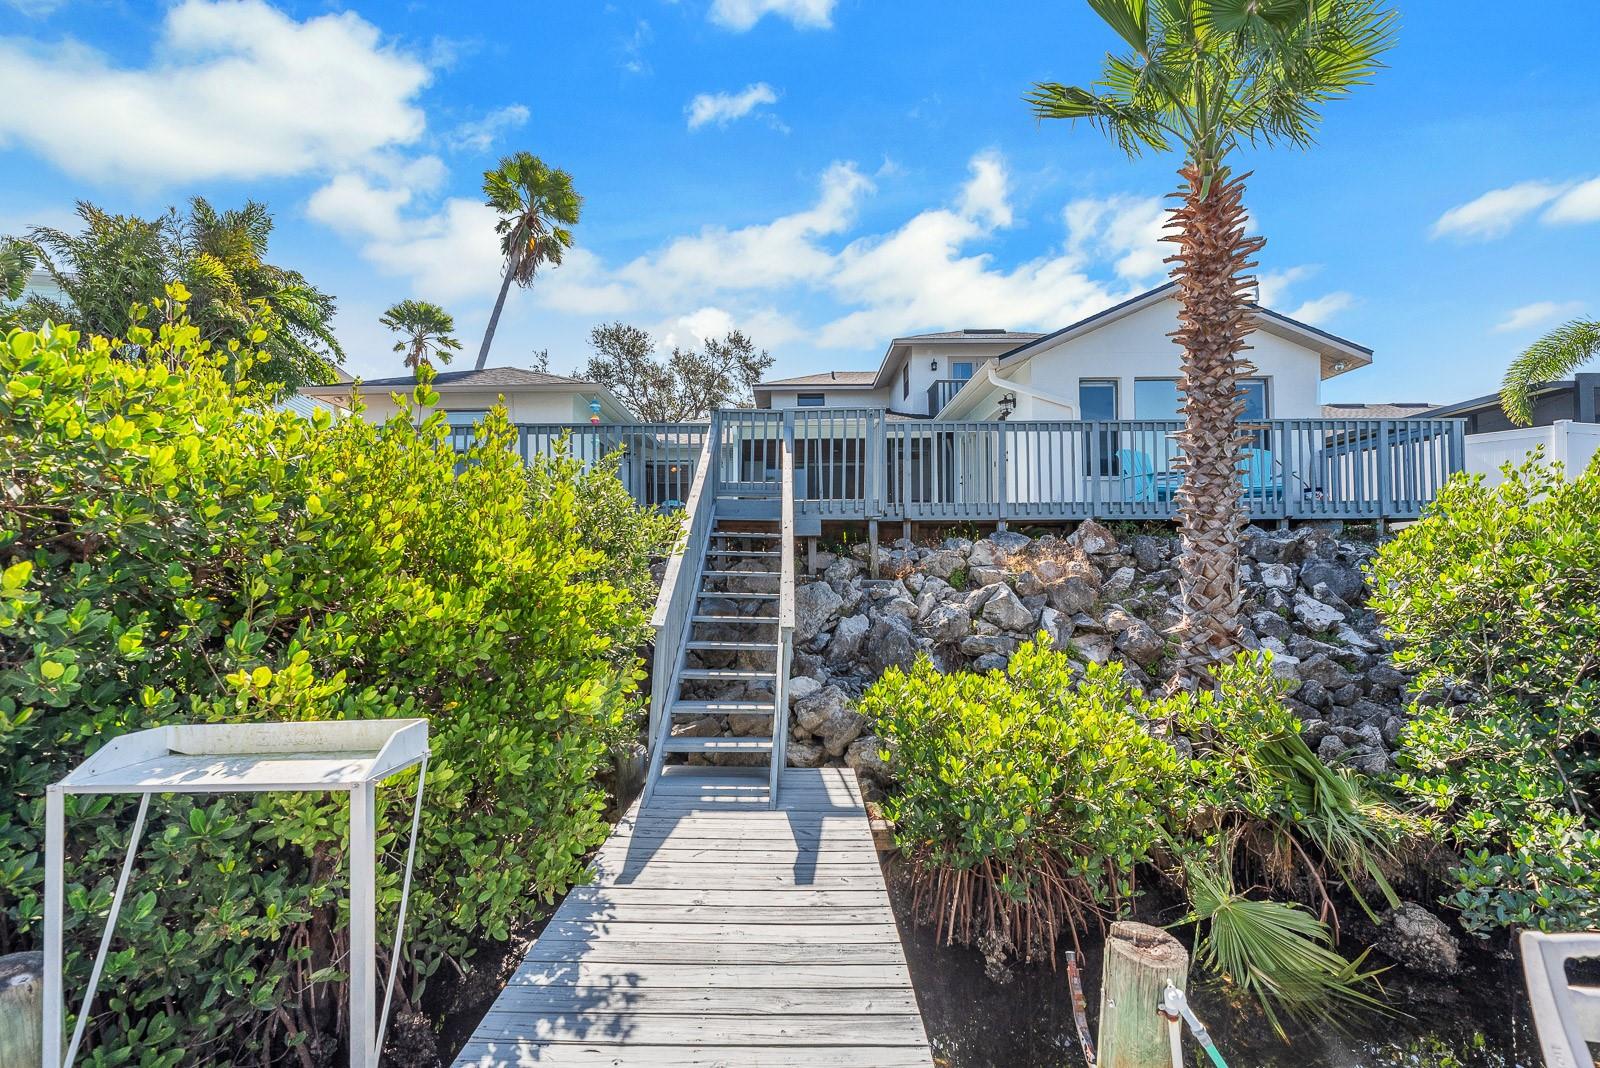
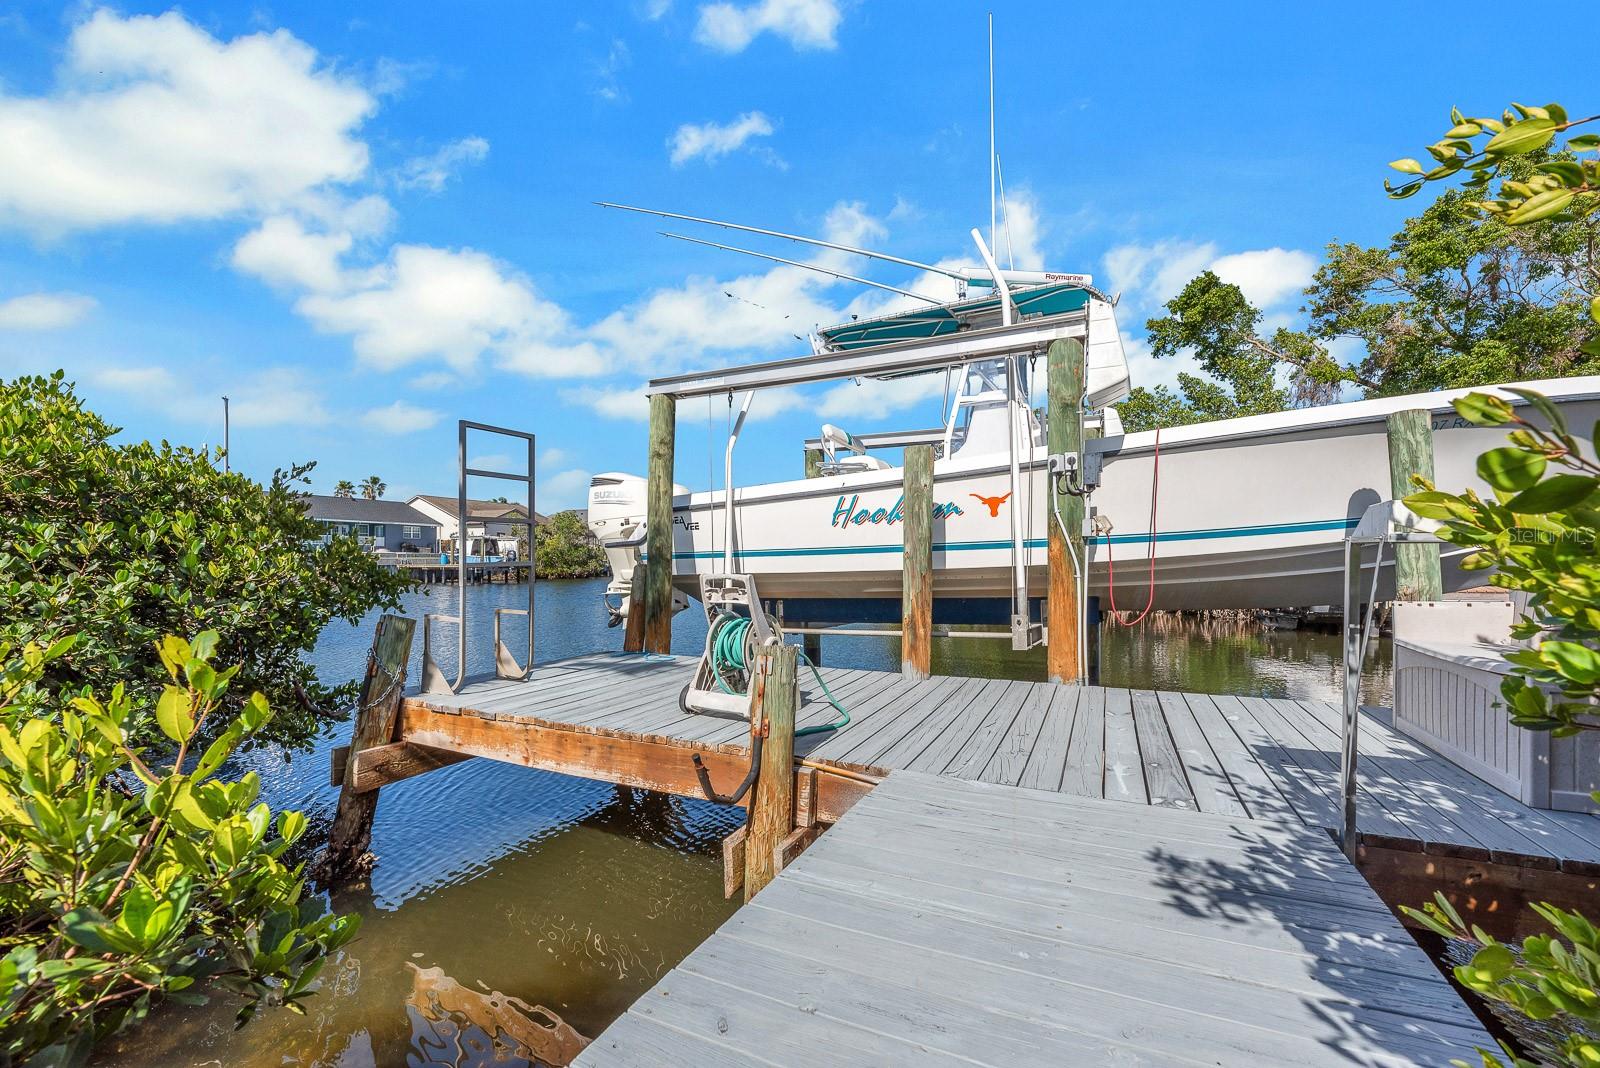
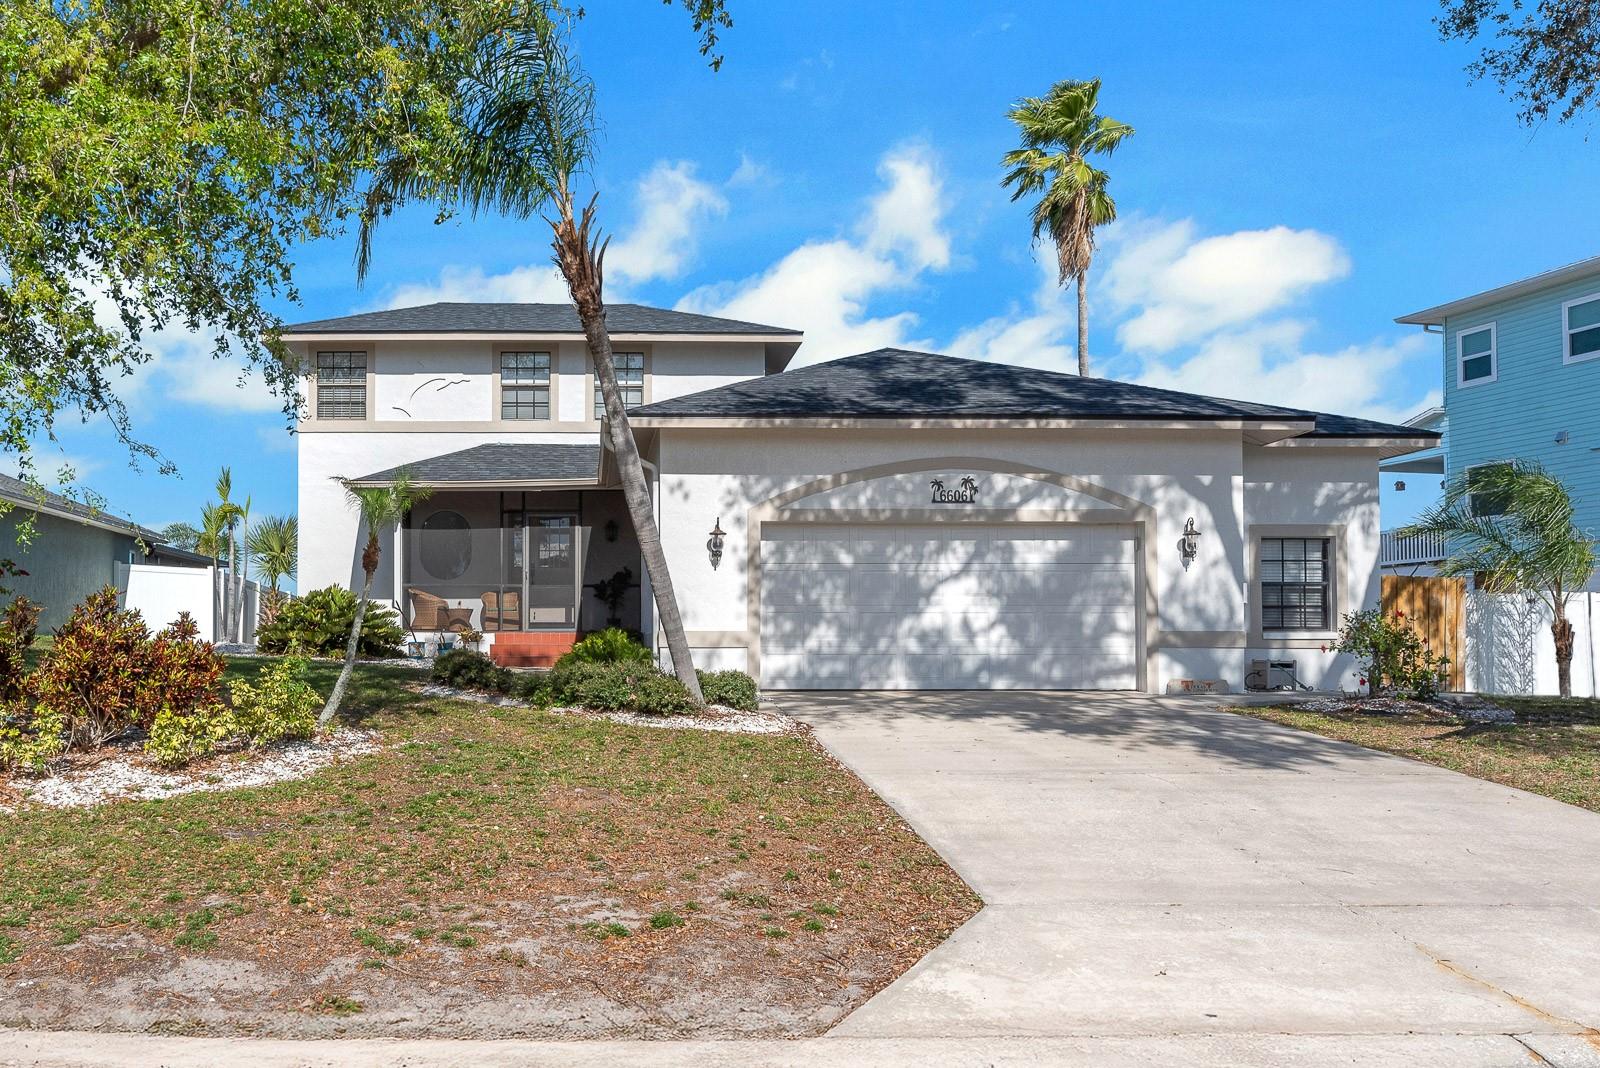
High and Dry! Separate In-Law or Income Suite! Boater's Paradise! Iconic Apollo Beach lifestyle in sought after Dolphin Cove! Situated high and dry on a strong and tall rip rap sea wall, this home has everything you want or need to enjoy waterfront living in Florida. Let’s start with the newly installed waterproof luxury vinyl flooring giving the luxury beach cottage vibe throughout the first floor. Cool and classic tones throughout the home give you the tranquility you seek in a home. Abundant windows allow natural light to pour in from all directions bathing the home in sunny waterfront views. On the first floor you will find the recently updated kitchen with new stainless steel appliances, granite countertops and refreshed cabinetry paint and hardware. The vaulted ceiling captivates in the flexible dining area with sliders out to the screened porch for coffee and sunsets after the meal. The screened porch offers a lovely tiled mural, tongue and groove wood ceiling and unobstructed pool views. The large gathering room is surrounded by windows and water views but yet cozy enough to enjoy a warm fire on chilly evenings. Recently updated french doors with impact glass enhance the easy access to the outside from several rooms. The 2 guest bedrooms, updated hall bath and laundry area complete the downstairs. The garage has 2 full parking bays PLUS a separate WORKSHOP ideal for your bait and tackle, boat gear storage, or recreational toys. Up the stairs you will find a quiet loft nook, and what could be another small guest space, but is currently used as an additional walk-in closet. The primary suite has the best views complete with its own BALCONY for sunset watching over the water. The primary bathroom is recently remodeled to include a large walk-in shower AND a jetted soaking tub. Need more space? This home has a SEPARATE SUITE located by the pool complete with bedroom and full bathroom cooled by its own ductless mini-split. You can’t miss the tongue and groove wood ceiling adding instant charm to the room. Your guests have access to the refurbished pool and patio deck with a separate outside entrance. The patio has a freshly painted pool deck and several areas for grilling, fire pits, and sunbathing. The side of the home has another space your guests can relax in the shade to curl up with a good book. The boat dock has a lift, power, and water and can hold up to 10,000 pounds. There is easy access thru the canal to the open water-no bridges or locks. The owner has upgraded most of the paint, light fixtures, fans, flooring, cabinetry paint, bathrooms, and so much more to make this home a perfect salt life retreat. Roof 2023, Hot Water Heater 2022, Kitchen Appliances 2024, Chimney Crown, Chase and Cap 2024. Don’t want to cook? This home is just around the corner from destination restaurants like Finn’s Dockside and Circles Waterfront. Situated well above sea level this property has endured the weather unscathed for many years. Looking for the perfect piece of paradise, this is it!
Build Your Team
Quickly find investor-friendly professionals who can help you succeed in real estate investing at any stage of the investing journey.


Agents
Match with investor-friendly agents who can help you find, analyze, and close your next deal


Lenders
Get the best funding…find investor-friendly lenders who specialize in your deal strategy


Property Managers
Transition to passive investing. Find a trusted property management partnership that lasts.


Tax Pros & Accountants
Taxes and financial reporting made easy—find experts to create tax savings strategies, file taxes, and more
Location
Property Details
Parking
- Description: Garage
- Details: Attached
- Garage Spaces: 2
- Spaces Total: 0
Bedroom Information
- # of Bedrooms: 4
Bathroom Information
- # of Baths (Full): 3
- # of Baths (Total): 3.0
Interior Features
- # of Rooms: 6
- # of Stories: 2
- Fireplace: Yes
Exterior Features
- Exterior Walls Materials: Stucco
- Foundation: Concrete Perimeter
- Roof Type: Gable or Hip
- Roof Material: Shingle
- Pool: Yes
Land Information
- Land Use: Residential
- Land Use Subtype: Single Family Residential
Lot Information
- Parcel ID: U1731191T4000000000460
- Lot Size: 8050 sqft
Property Information
- Property Type: Single Family Residence
- Year Built: 1989
Tax Information
- Annual Tax: $9,800
Utilities
- Water & Sewer: Public
- Heating: Central, Electric
- Cooling: Central Air, Ductless, Zoned
Location
- County: Hillsborough
Listing Details
Investment Summary
- Monthly Cash Flow
- -$2,597
- Cap Rate
- 3.2%
- Cash-on-Cash Return
- -13.3%
- Debt Coverage Ratio
- 0.51
- Internal Rate of Return (5 years)
- -8.9%
Cash Flow
Net Operating Income (NOI) minus mortgage payments.
Calculation:
NOI - Mortgage Payments
Cap Rate (Market Value)
Capitalization Rate is a rate of return that compares the yearly Net Operating Income (NOI) to the market value.
Calculation:
NOI / Market Value
Cash-on-Cash Return (CoC)
Annual Cash Flow / Cash Invested
Calculation:
Annual cash flow divided by initial cash invested.
Debt Coverage Ratio (DCR)
Net Operating Income (NOI) divided by total debt payments.
Calculation:
NOI / Total Debt Payments
Internal Rate of Return (IRR)
A metric for assessing profitability over time. IRR is the discount rate at which the net present value (NPV) of all future cash flows (positive and negative) from an investment equals zero — including both periodic cash flow (such as rent) and a projected sale at the end of the holding period. It represents the expected annualized return, accounting for income, expenses, and the recovery of capital through a future sale.
Purchase Details
Purchase PriceThe price paid for the property. Purchase price:
| $1,015,000 |
|---|---|
Amount FinancedThe amount of the purchase financed through a loan. Amount financed:
| -$812,000 |
Down paymentThe initial payment made towards the purchase. Down payment:
| $203,000 |
Closing CostsFees and expenses associated with purchasing a property, typically ranging from 2% to 5% of the home’s purchase price, paid at the end of a home purchase to cover services like lending, title transfer, and taxes. Closing costs:
| $30,450 |
Rehab CostsCosts incurred to repair or improve the property, including: roof, flooring, exterior siding, kitchen, exterior paint, bathrooms, etc. Rehab costs:
| $0 |
Initial Cash InvestedThe total initial cash invested in the property. Calculation:Down payment + Buying costs + Rehab costs Initial cash invested:
| $233,450 |
Square Feet (SQFT)The total square footage of the property. Square feet:
| 2,650 |
Cost Per Square FootCost per square foot of the property. Calculation:Purchase Price / Square Feet Cost per square foot:
| $383 |
Monthly Rent Per Square FootMonthly rent divided by the number of square feet. This ratio helps investors compare rental income efficiency across properties, markets, and unit sizes Calculation:Monthly Rent / Square Feet Monthly rent per square foot:
| $1.92 |
Financing Details
Loan AmountThe total sum of money borrowed from a lender to finance a property purchase. Calculation:Purchase Price - Down Payment
Loan amount:
| $812,000 |
|---|---|
Loan to Value Ratio (LTV)Loan amount divided by the market value of the property. Calculation:Loan Amount / Market Value
Loan to value ratio:
| 80.0% |
Loan TypeThe type of loan (e.g., fixed, adjustable).
Loan type:
| Amortizing |
TermThe loan repayment period in years.
Term:
| 30 years |
Interest RateThe percentage a lender charges on the borrowed amount of a loan, determining the cost of borrowing money.
Interest rate:
| 6.810% |
Principal & Interest (PI)The principal is the portion of the loan payment that reduces the loan balance. The interest is the lender's charge for borrowing money. Calculation:(P * r * (1 + r) ** n) / ((1 + r) ** n - 1) Where:
P = Loan amount (principal)
Principal & interest:
| $5,299 |
Property TaxesAnnual taxes levied by local governments on real estate properties. These taxes fund public services like schools, roads, and emergency services.
Property tax:
| $817 |
InsuranceThe costs for insurance coverage to protect against financial losses due to risks like fire, natural disasters, theft, liability, or tenant-related damages. Calculation:Assumes 7% of gross rental income, unless insurance rates are specified.
Insurance:
| $357 |
Private Mortgage Insurance (PMI)A fee that borrowers pay when they take out a conventional loan with a loan-to-value (LTV) ratio above 80%.
Private mortgage insurance (PMI):
| $0 |
Monthly PaymentThe fixed amount a borrower pays each month to repay a loan. It typically includes principal and interest (P&I) and may also cover property taxes, insurance, HOA fees, and PMI if escrowed. Monthly payment:
| $6,473 |
Operating Income
| % Rent | Monthly | Yearly | |
|---|---|---|---|
Gross RentThe total rental income received from tenants before deducting any expenses. Includes base rent, late fees, pet fees, parking fees, and other recurring charges.
Gross rent:
| $5,100 | $61,200 | |
Vacancy LossExpected loss of rent due to vacancies.
Vacancy loss:
(6%)
| 6% | -$306 | -$3,672 |
Operating IncomeGross rental income minus vacancy loss. Calculation:Gross rent - Vacancy loss
Operating income:
| $4,794 | $57,528 |
Operating Expenses
| % Rent | Monthly | Yearly | |
|---|---|---|---|
Property TaxesAnnual taxes levied by local governments on real estate properties. These taxes fund public services like schools, roads, and emergency services. | 16% | -$817 | -$9,800 |
InsuranceThe costs for insurance coverage to protect against financial losses due to risks like fire, natural disasters, theft, liability, or tenant-related damages. Calculation:Assumes 7% of gross rental income, unless insurance rates are specified. | 7% | -$357 | -$4,284 |
Property ManagementThe costs associated with hiring a property manager to handle the day-to-day operations of a rental property. Includes management fees, leasing fes, eviction fees, etc. Calculation:Assumes 8% of gross rental income. | 8% | -$408 | -$4,896 |
Repairs & MaintenanceOngoing costs for routine upkeep and minor fixes needed to keep a property in good working condition. Calculation:Assumes 5% of gross rental income. Varies by property age and condition. | 5% | -$255 | -$3,060 |
Capital ExpensesLarge, infrequent costs for major improvements or replacements, like a new roof, HVAC system, or appliances. Calculation:Assumes 5% of gross rental income. Varies by property age. | 5% | -$255 | -$3,060 |
HOA FeesRegular dues paid to a Homeowners Association for community maintenance, amenities, and management. Similar fees include: Condo Association Fees, Co-op Maintenance Fees, etc. | n/a | n/a | n/a |
Operating ExpensesRecurring costs required to maintain and manage a rental property, including property taxes, insurance, maintenance, repairs, utilities (if paid by the owner), property management fees, and other day-to-day expenses. Calculation:Insurance + Property Taxes + Property Management + Repairs & Maintenance + Capital Expenditures + HOA Fees | 41% | -$2,092 | -$25,100 |
Cash Flow
| Monthly | Yearly | |
|---|---|---|
Net Operating Income (NOI)The income generated from a property after deducting all operating expenses but before deducting mortgage payments, taxes, and capital expenditures. Calculation:Gross Operating Income - Operating Expenses
Net operating income:
| $2,702 | $32,424 |
Mortgage PaymentThe fixed amount a borrower pays each month to repay a loan. It typically includes principal and interest (P&I) and may also cover property taxes, insurance, HOA fees, and PMI if escrowed. | -$5,299 | -$63,588 |
Cash FlowNet Operating Income (NOI) minus mortgage payments. Calculation:NOI - Mortgage Payments | $2,597 | $31,164 |