
$374,900
Investment Summary
- Monthly Cash Flow
- -$859
- Cap Rate
- 3.4%
- Cash-on-Cash Return
- -12.0%
- Debt Coverage Ratio
- 0.55
- Internal Rate of Return (5 years)
- -7.6%
Cash Flow
Net Operating Income (NOI) minus mortgage payments.
Calculation:
NOI - Mortgage Payments
Cap Rate (Market Value)
Capitalization Rate is a rate of return that compares the yearly Net Operating Income (NOI) to the market value.
Calculation:
NOI / Market Value
Cash-on-Cash Return (CoC)
Annual Cash Flow / Cash Invested
Calculation:
Annual cash flow divided by initial cash invested.
Debt Coverage Ratio (DCR)
Net Operating Income (NOI) divided by total debt payments.
Calculation:
NOI / Total Debt Payments
Internal Rate of Return (IRR)
A metric for assessing profitability over time. IRR is the discount rate at which the net present value (NPV) of all future cash flows (positive and negative) from an investment equals zero — including both periodic cash flow (such as rent) and a projected sale at the end of the holding period. It represents the expected annualized return, accounting for income, expenses, and the recovery of capital through a future sale.
Property Description
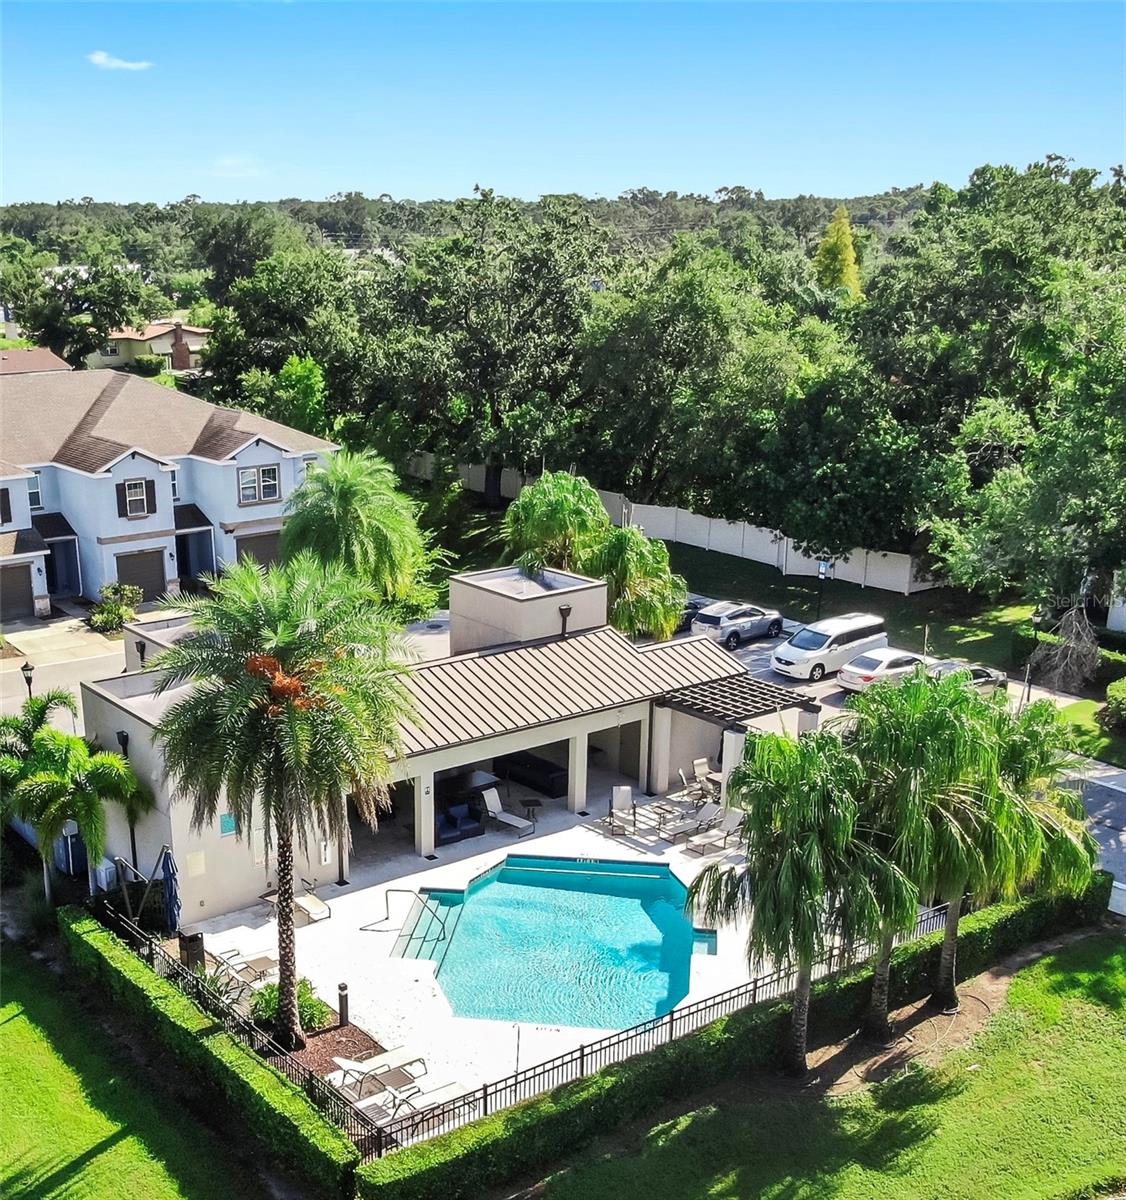
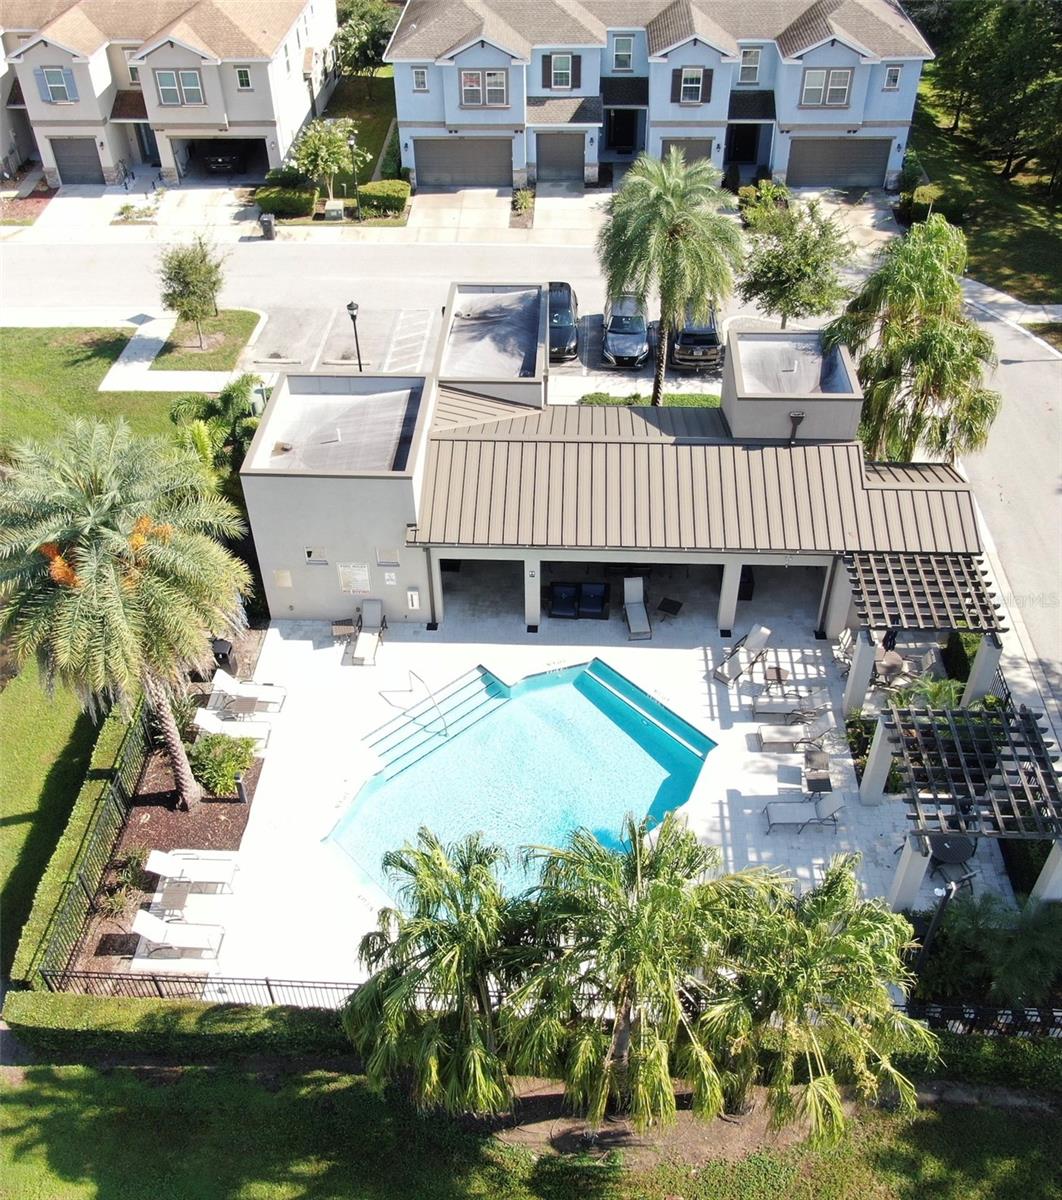
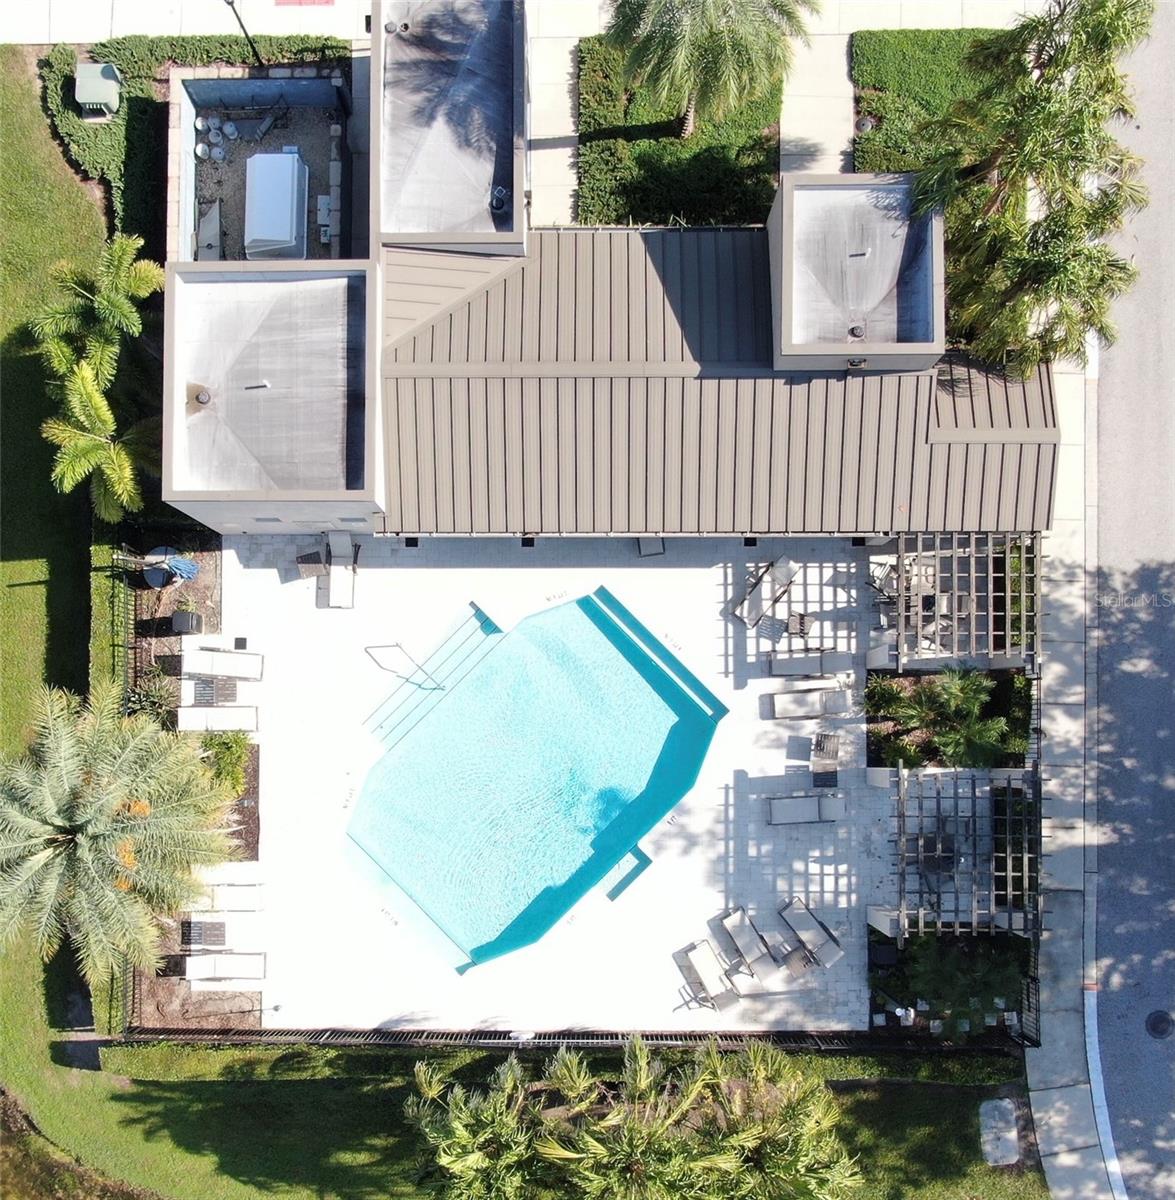
Exceptional conservation views with no rear neighbors and superior CalAtlantic construction set this townhome apart from the rest. From the moment you step inside, you’ll notice it is not your average unit - it’s loaded with upgrades. Welcome to 6718 Rocky Park Street - a beautiful 3-bedroom, 2.5-bathroom home tucked away in the highly desirable Bridge Haven community in Tampa’s 33625 zip code. Thoughtfully designed and built by CalAtlantic (prior to the Lennar merger), this home offers a higher level of craftsmanship and finishes that reflect the superior standards of a premium builder. The spacious living area features crown molding, wood-look ceramic tile flooring on the first level, a built-in five-speaker surround sound system, and plantation shutters that enhance the peaceful views out to the screened-in patio and conservation beyond. The upgraded kitchen is a showstopper, boasting 42-inch upper cabinets, soft-close drawers, pull-out shelves, stunning quartz countertops, a stylish tile backsplash, pendant lights, and a custom cabinet-wrapped island that provides a high-end, high-quality finished look. A large walk-in pantry and under-stair storage closet add both function and convenience. Upstairs, the primary suite offers a tranquil escape with plantation-shuttered windows framing lush conservation views, a custom walk-in closet shelving system, and a spa-like bathroom featuring a frameless glass shower and upgraded quartz counters. The laundry room (located upstairs) includes the washer and dryer and is near the bedrooms for added convenience. Additional features include a custom vanity in the downstairs powder bath (not the standard pedestal sink), solid hardwood stairs with no carpet, brand-new carpet upstairs installed in July 2025, and all rooms - including the screened-in back porch - are equipped with ceiling fans. There is a vinyl privacy fence between units, a whole-home water softener, and a security system. Located in Flood Zone X – no flood insurance required. The one-car garage has also been optimized with custom shelving and a 4x8 overhead storage rack. Enjoy the low-maintenance lifestyle with a monthly HOA that includes cable TV, high-speed internet, landscaping, roof reserves, exterior maintenance, and a gorgeous resort-style pool and cabana. Zoned for top-rated schools - Citrus Park Elementary, Sergeant Paul R. Smith Middle, and Sickles High School - and ideally located near the Veterans Expressway, Publix, Citrus Park Mall, International Plaza, Tampa International Airport, and some of the world’s best beaches. Whether you’re heading downtown or out to the Gulf Coast, this location makes it easy. This is more than just a townhome - it’s a suburban sanctuary with upscale finishes, surrounded by nature and unbeatable convenience. This gem of a townhome is ready to welcome you home.
Build Your Team
Quickly find investor-friendly professionals who can help you succeed in real estate investing at any stage of the investing journey.


Agents
Match with investor-friendly agents who can help you find, analyze, and close your next deal


Lenders
Get the best funding…find investor-friendly lenders who specialize in your deal strategy


Property Managers
Transition to passive investing. Find a trusted property management partnership that lasts.


Tax Pros & Accountants
Taxes and financial reporting made easy—find experts to create tax savings strategies, file taxes, and more
Location
Property Details
Parking
- Description: Garage
- Details: Driveway, Garage Door Opener, Guest, Attached
- Garage Spaces: 1
- Spaces Total: 0
Bedroom Information
- # of Bedrooms: 3
Bathroom Information
- # of Baths (Full): 2
- # of Baths (Partial): 1
- # of Baths (Total): 3.0
Interior Features
- # of Rooms: 3
- # of Stories: 2
Exterior Features
- Exterior Walls Materials: Stucco
- Foundation: Slab
- Roof Type: Gable or Hip
- Roof Material: Shingle
- Pool Community: Yes
HOA
- Has HOA: Yes
- Association: Julio Mendez
- HOA Fee: $382/monthly
Land Information
- Land Use: Residential
- Land Use Subtype: Townhouse
Lot Information
- Parcel ID: U122817A6Q000000000330
- Lot Size: 1818 sqft
Property Information
- Property Type: Townhouse
- Year Built: 2018
Tax Information
- Annual Tax: $2,560
Utilities
- Water & Sewer: Public
- Heating: Central
- Cooling: Central Air
Location
- County: Hillsborough
Listing Details
Investment Summary
- Monthly Cash Flow
- -$859
- Cap Rate
- 3.4%
- Cash-on-Cash Return
- -12.0%
- Debt Coverage Ratio
- 0.55
- Internal Rate of Return (5 years)
- -7.6%
Cash Flow
Net Operating Income (NOI) minus mortgage payments.
Calculation:
NOI - Mortgage Payments
Cap Rate (Market Value)
Capitalization Rate is a rate of return that compares the yearly Net Operating Income (NOI) to the market value.
Calculation:
NOI / Market Value
Cash-on-Cash Return (CoC)
Annual Cash Flow / Cash Invested
Calculation:
Annual cash flow divided by initial cash invested.
Debt Coverage Ratio (DCR)
Net Operating Income (NOI) divided by total debt payments.
Calculation:
NOI / Total Debt Payments
Internal Rate of Return (IRR)
A metric for assessing profitability over time. IRR is the discount rate at which the net present value (NPV) of all future cash flows (positive and negative) from an investment equals zero — including both periodic cash flow (such as rent) and a projected sale at the end of the holding period. It represents the expected annualized return, accounting for income, expenses, and the recovery of capital through a future sale.
Purchase Details
Purchase PriceThe price paid for the property. Purchase price:
| $374,900 |
|---|---|
Amount FinancedThe amount of the purchase financed through a loan. Amount financed:
| -$299,920 |
Down paymentThe initial payment made towards the purchase. Down payment:
| $74,980 |
Closing CostsFees and expenses associated with purchasing a property, typically ranging from 2% to 5% of the home’s purchase price, paid at the end of a home purchase to cover services like lending, title transfer, and taxes. Closing costs:
| $11,247 |
Rehab CostsCosts incurred to repair or improve the property, including: roof, flooring, exterior siding, kitchen, exterior paint, bathrooms, etc. Rehab costs:
| $0 |
Initial Cash InvestedThe total initial cash invested in the property. Calculation:Down payment + Buying costs + Rehab costs Initial cash invested:
| $86,227 |
Square Feet (SQFT)The total square footage of the property. Square feet:
| 1,626 |
Cost Per Square FootCost per square foot of the property. Calculation:Purchase Price / Square Feet Cost per square foot:
| $231 |
Monthly Rent Per Square FootMonthly rent divided by the number of square feet. This ratio helps investors compare rental income efficiency across properties, markets, and unit sizes Calculation:Monthly Rent / Square Feet Monthly rent per square foot:
| $1.48 |
Financing Details
Loan AmountThe total sum of money borrowed from a lender to finance a property purchase. Calculation:Purchase Price - Down Payment
Loan amount:
| $299,920 |
|---|---|
Loan to Value Ratio (LTV)Loan amount divided by the market value of the property. Calculation:Loan Amount / Market Value
Loan to value ratio:
| 80.0% |
Loan TypeThe type of loan (e.g., fixed, adjustable).
Loan type:
| Amortizing |
TermThe loan repayment period in years.
Term:
| 30 years |
Interest RateThe percentage a lender charges on the borrowed amount of a loan, determining the cost of borrowing money.
Interest rate:
| 6.625% |
Principal & Interest (PI)The principal is the portion of the loan payment that reduces the loan balance. The interest is the lender's charge for borrowing money. Calculation:(P * r * (1 + r) ** n) / ((1 + r) ** n - 1) Where:
P = Loan amount (principal)
Principal & interest:
| $1,920 |
Property TaxesAnnual taxes levied by local governments on real estate properties. These taxes fund public services like schools, roads, and emergency services.
Property tax:
| $213 |
InsuranceThe costs for insurance coverage to protect against financial losses due to risks like fire, natural disasters, theft, liability, or tenant-related damages. Calculation:Assumes 7% of gross rental income, unless insurance rates are specified.
Insurance:
| $168 |
Private Mortgage Insurance (PMI)A fee that borrowers pay when they take out a conventional loan with a loan-to-value (LTV) ratio above 80%.
Private mortgage insurance (PMI):
| $0 |
Monthly PaymentThe fixed amount a borrower pays each month to repay a loan. It typically includes principal and interest (P&I) and may also cover property taxes, insurance, HOA fees, and PMI if escrowed. Monthly payment:
| $2,301 |
Operating Income
| % Rent | Monthly | Yearly | |
|---|---|---|---|
Gross RentThe total rental income received from tenants before deducting any expenses. Includes base rent, late fees, pet fees, parking fees, and other recurring charges.
Gross rent:
| $2,400 | $28,800 | |
Vacancy LossExpected loss of rent due to vacancies.
Vacancy loss:
(6%)
| 6% | -$144 | -$1,728 |
Operating IncomeGross rental income minus vacancy loss. Calculation:Gross rent - Vacancy loss
Operating income:
| $2,256 | $27,072 |
Operating Expenses
| % Rent | Monthly | Yearly | |
|---|---|---|---|
Property TaxesAnnual taxes levied by local governments on real estate properties. These taxes fund public services like schools, roads, and emergency services. | 9% | -$213 | -$2,560 |
InsuranceThe costs for insurance coverage to protect against financial losses due to risks like fire, natural disasters, theft, liability, or tenant-related damages. Calculation:Assumes 7% of gross rental income, unless insurance rates are specified. | 7% | -$168 | -$2,016 |
Property ManagementThe costs associated with hiring a property manager to handle the day-to-day operations of a rental property. Includes management fees, leasing fes, eviction fees, etc. Calculation:Assumes 8% of gross rental income. | 8% | -$192 | -$2,304 |
Repairs & MaintenanceOngoing costs for routine upkeep and minor fixes needed to keep a property in good working condition. Calculation:Assumes 5% of gross rental income. Varies by property age and condition. | 5% | -$120 | -$1,440 |
Capital ExpensesLarge, infrequent costs for major improvements or replacements, like a new roof, HVAC system, or appliances. Calculation:Assumes 5% of gross rental income. Varies by property age. | 5% | -$120 | -$1,440 |
HOA FeesRegular dues paid to a Homeowners Association for community maintenance, amenities, and management. Similar fees include: Condo Association Fees, Co-op Maintenance Fees, etc. | 16% | -$382 | -$4,584 |
Operating ExpensesRecurring costs required to maintain and manage a rental property, including property taxes, insurance, maintenance, repairs, utilities (if paid by the owner), property management fees, and other day-to-day expenses. Calculation:Insurance + Property Taxes + Property Management + Repairs & Maintenance + Capital Expenditures + HOA Fees | 50% | -$1,195 | -$14,344 |
Cash Flow
| Monthly | Yearly | |
|---|---|---|
Net Operating Income (NOI)The income generated from a property after deducting all operating expenses but before deducting mortgage payments, taxes, and capital expenditures. Calculation:Gross Operating Income - Operating Expenses
Net operating income:
| $1,061 | $12,732 |
Mortgage PaymentThe fixed amount a borrower pays each month to repay a loan. It typically includes principal and interest (P&I) and may also cover property taxes, insurance, HOA fees, and PMI if escrowed. | -$1,920 | -$23,040 |
Cash FlowNet Operating Income (NOI) minus mortgage payments. Calculation:NOI - Mortgage Payments | $859 | $10,308 |