$355,000
Investment Summary
- Monthly Cash Flow
- -$569
- Cap Rate
- 4.2%
- Cash-on-Cash Return
- -8.4%
- Debt Coverage Ratio
- 0.69
- Internal Rate of Return (5 years)
- -4.1%
Cash Flow
Net Operating Income (NOI) minus mortgage payments.
Calculation:
NOI - Mortgage Payments
Cap Rate (Market Value)
Capitalization Rate is a rate of return that compares the yearly Net Operating Income (NOI) to the market value.
Calculation:
NOI / Market Value
Cash-on-Cash Return (CoC)
Annual Cash Flow / Cash Invested
Calculation:
Annual cash flow divided by initial cash invested.
Debt Coverage Ratio (DCR)
Net Operating Income (NOI) divided by total debt payments.
Calculation:
NOI / Total Debt Payments
Internal Rate of Return (IRR)
A metric for assessing profitability over time. IRR is the discount rate at which the net present value (NPV) of all future cash flows (positive and negative) from an investment equals zero — including both periodic cash flow (such as rent) and a projected sale at the end of the holding period. It represents the expected annualized return, accounting for income, expenses, and the recovery of capital through a future sale.
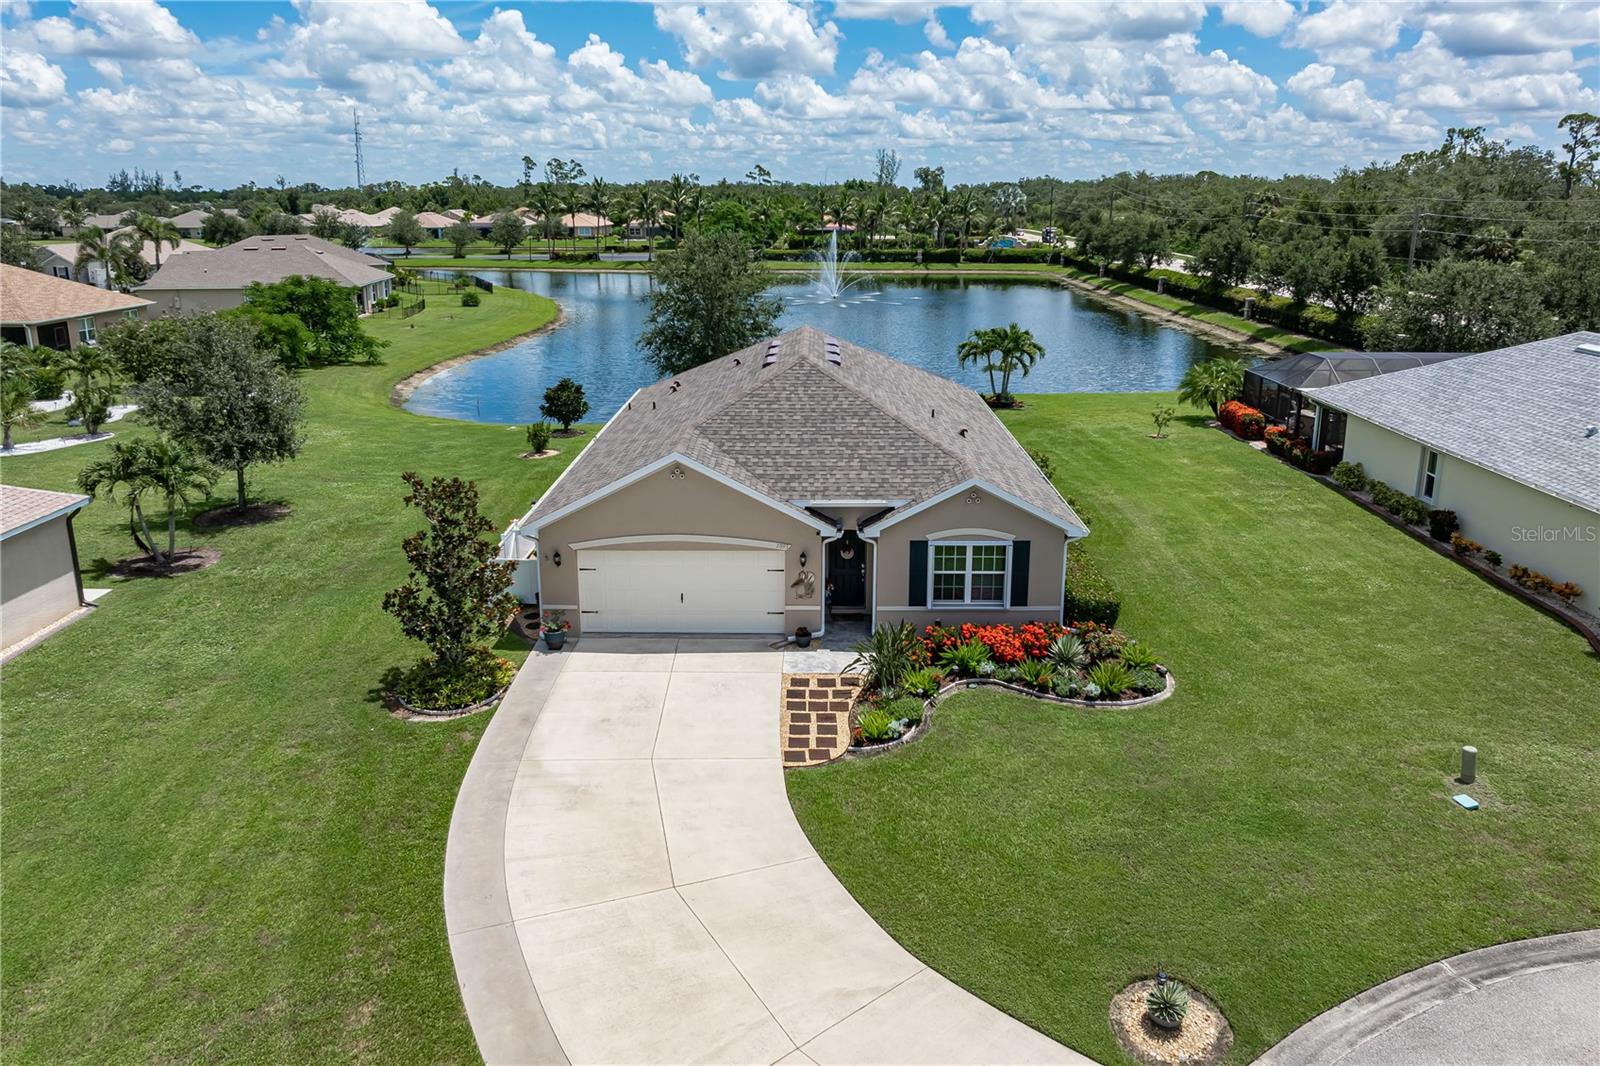
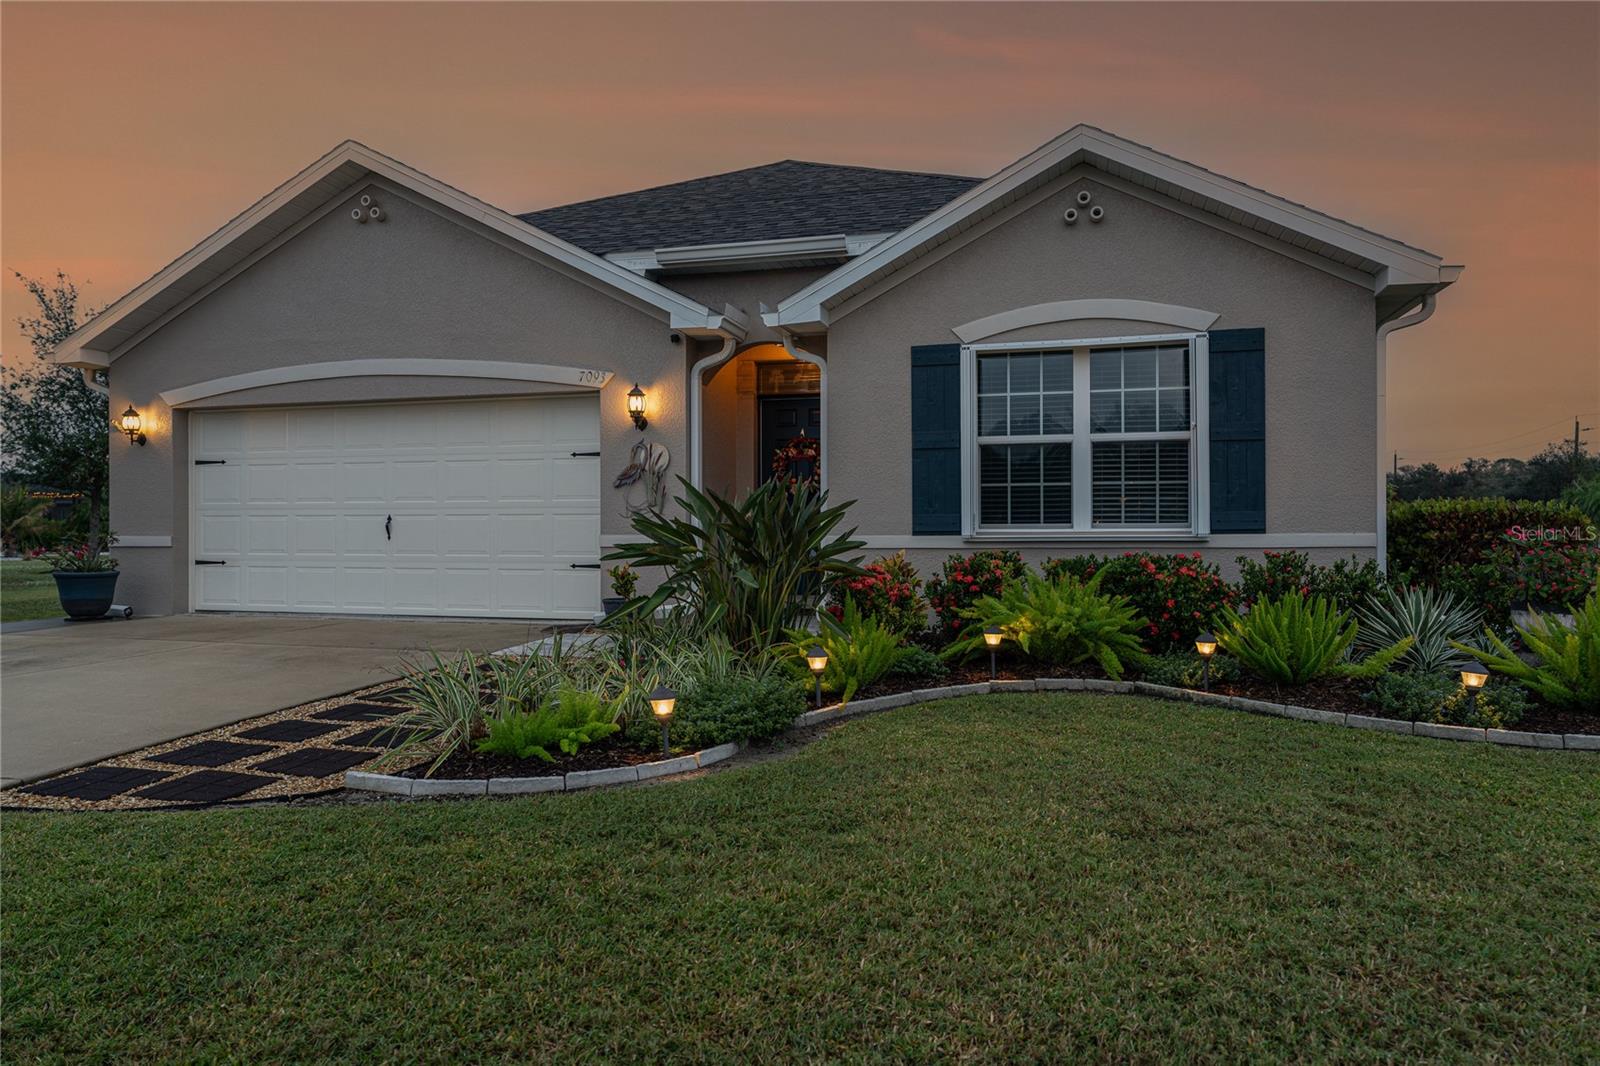
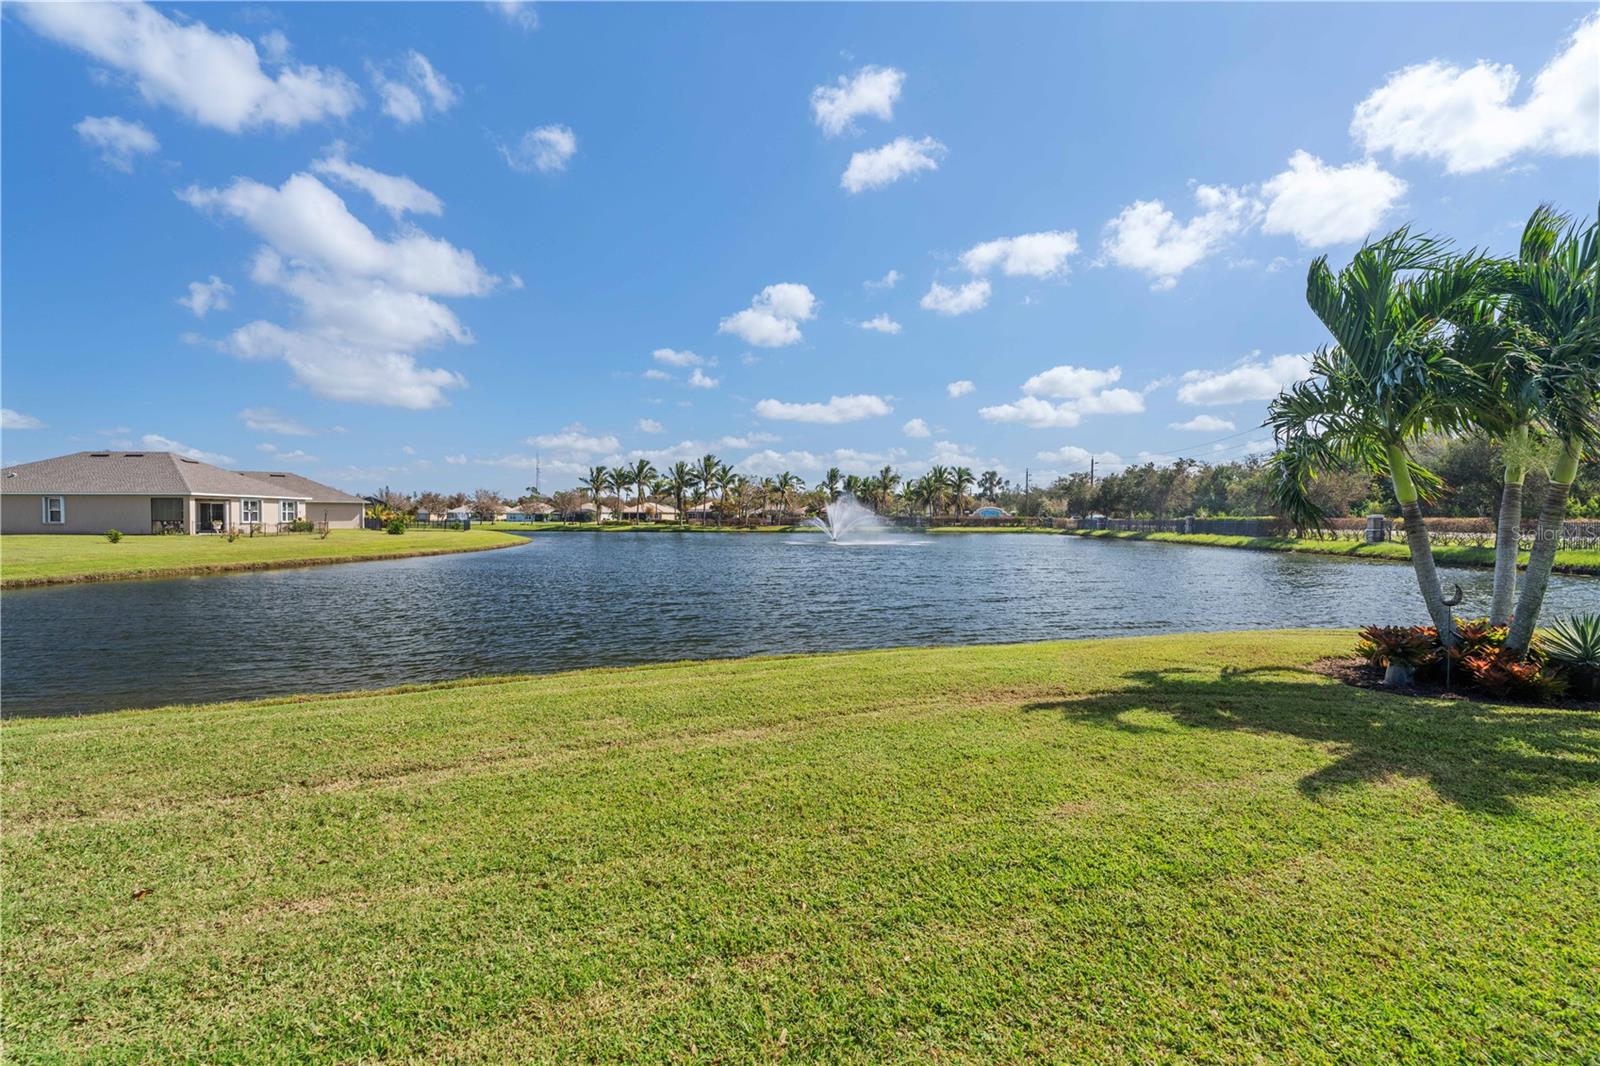
Property Description
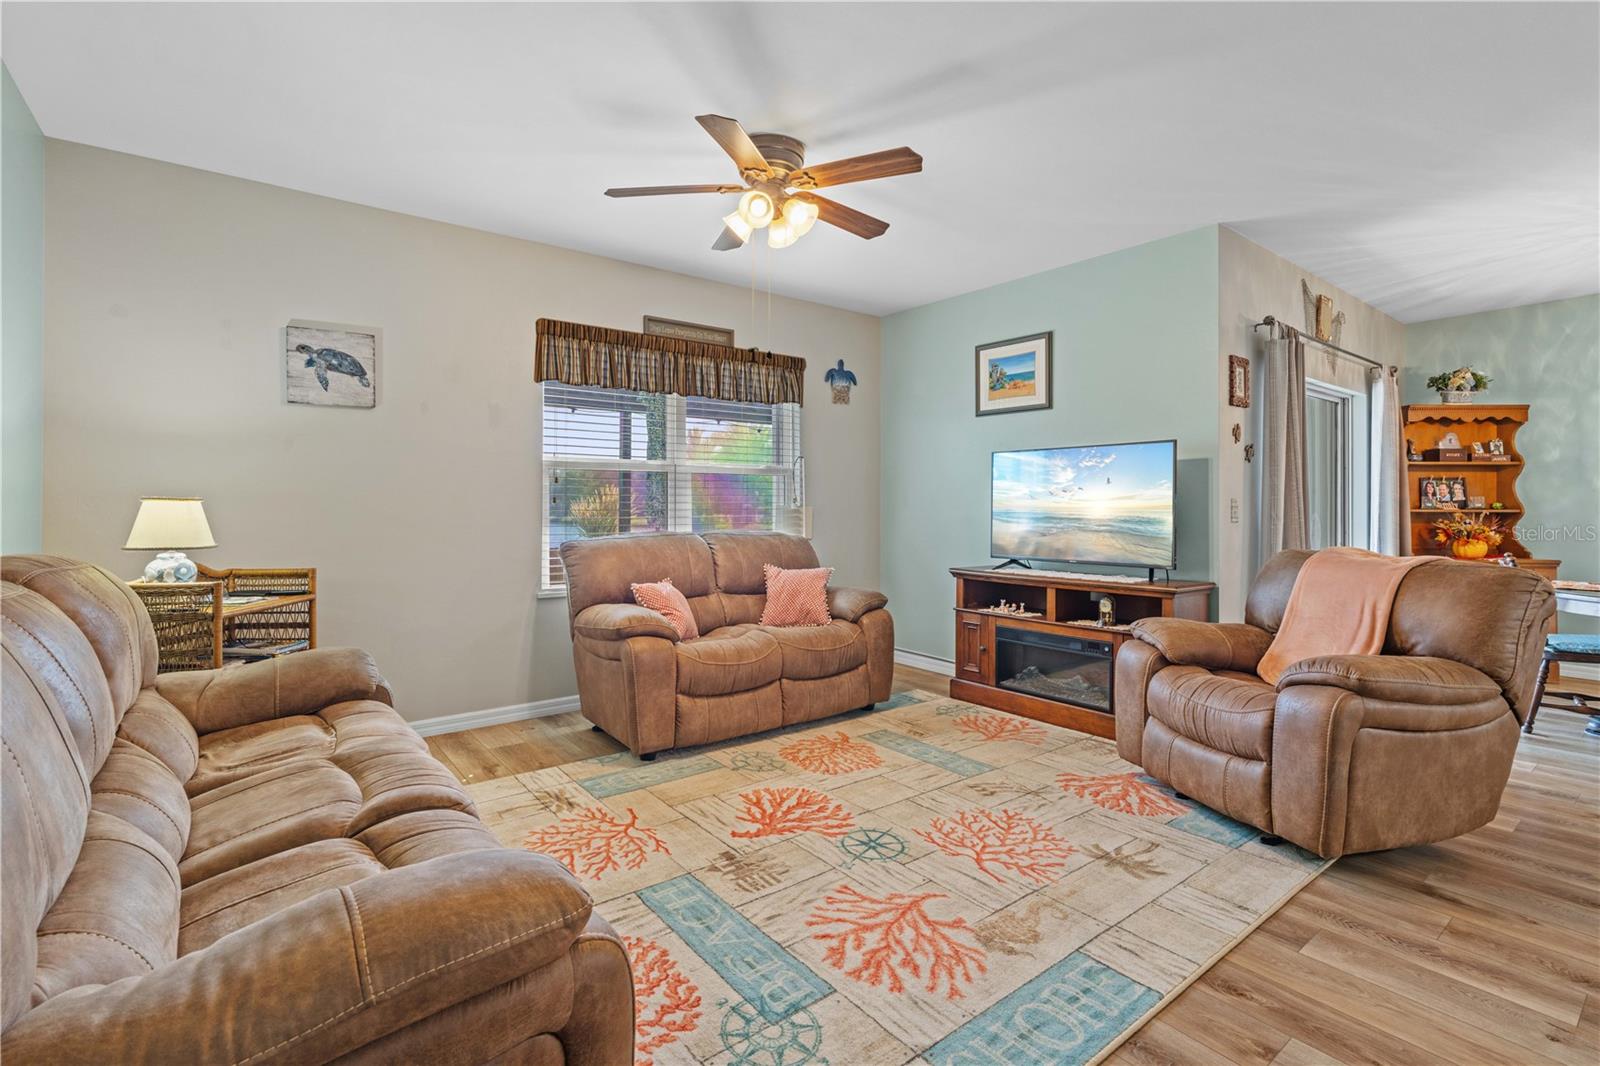
LAKEFRONT HOME ON OVERSIZED LOT IN WATERFORD ESTATES This **FOUR** bed/TWO bath home, located in the gated community of Waterford Estates, commands one of the neighborhood’s most desirable oversized lots with an extra-wide footprint and an unforgettable lake view. From your lanai, watch the water shimmer with a central fountain framed by lush landscaping and wide open skies. The community offers two pools, a clubhouse with fitness, billiards, and cards, plus pickleball and bocce courts — all just minutes from historic downtown Punta Gorda, Fishermen’s Village, US41, I-75, and PGD airport. Lawn care, trimming, irrigation, and recreation facilities are covered by low quarterly HOA fees. Inside, the open-concept layout is anchored by a coastal-inspired chef’s kitchen featuring brand-new counters, a striking center island with pendant lighting, rustic paneling detail, a breakfast bar, and a walk-in corner pantry. The kitchen flows into the spacious dining area and great room, where UV-protected windows and sliding glass doors bring in the lake view and natural light. Warm-toned luxury vinyl plank flooring runs throughout the main living areas, creating a seamless sense of space and style. The master retreat offers an en-suite, private bath with dual sinks, a large linen closet, and a tiled shower with adjustable shower head plus an oversized walk-in closet. Three guest bedrooms share a bright guest bath with combination tub/shower. Outdoor living takes center stage with an L-shaped, picture-frame-screened lanai finished in stamped concrete, creating a breezy extension of the home’s living space. The backyard unfolds to a manicured lawn that meets the water’s edge, providing unobstructed views and a serene setting for morning coffee. With a widened driveway, whole-house hurricane protection, gas generator hookup, new roof (2022), and fresh exterior paint (2024), this lakefront beauty is truly move-in ready. Low-voltage lighting brightens up the home at night for a beautiful look. A privacy fence at the side of the home covers trash bins while providing additional storage for bikes or other items. Waterford Estates is a growing community w/two gated entrances, two pools, a community center w/catering kitchen, billiards & card rooms plus a fitness center, four pickleball & three bocce courts. Miles of sidewalks in Waterford's park-like setting provide a scenic backdrop to your evening stroll. Enjoy the tranquility of passing by lakes and manicured, tropical landscaping. Schedule your appointment today and experience the Waterford Estates lifestyle for yourself. Home has a transferrable flood policy w/$930 premium ($4,454 discount).
Build Your Team
Quickly find investor-friendly professionals who can help you succeed in real estate investing at any stage of the investing journey.


Agents
Match with investor-friendly agents who can help you find, analyze, and close your next deal


Lenders
Get the best funding…find investor-friendly lenders who specialize in your deal strategy


Property Managers
Transition to passive investing. Find a trusted property management partnership that lasts.


Tax Pros & Accountants
Taxes and financial reporting made easy—find experts to create tax savings strategies, file taxes, and more
Location
Property Details
Parking
- Description: Garage
- Details: Attached
- Garage Spaces: 2
- Spaces Total: 0
Bedroom Information
- # of Bedrooms: 4
Bathroom Information
- # of Baths (Full): 2
- # of Baths (Total): 2.0
Interior Features
- # of Rooms: 11
- # of Stories: 1
Exterior Features
- Exterior Walls Materials: Composition/Composite
- Foundation: Slab
- Roof Material: Shingle
HOA
- Has HOA: Yes
- Association: Precedent Management
- HOA Fee: $276/quarterly
- Additional Association: Waterford Estates
- Additional HOA Fee: $350/quarterly
Land Information
- Land Use: Residential
- Land Use Subtype: Single Family Residential
Lot Information
- Parcel ID: 412308455008
- Lot Size: 13606 sqft
Property Information
- Property Type: Single Family Residence
- Style: Custom, Florida
- Year Built: 2015
Tax Information
- Annual Tax: $3,207
Utilities
- Water & Sewer: Public
- Heating: Central, Electric
- Cooling: Central Air
Location
- County: Charlotte
Listing Details
Investment Summary
- Monthly Cash Flow
- -$569
- Cap Rate
- 4.2%
- Cash-on-Cash Return
- -8.4%
- Debt Coverage Ratio
- 0.69
- Internal Rate of Return (5 years)
- -4.1%
Cash Flow
Net Operating Income (NOI) minus mortgage payments.
Calculation:
NOI - Mortgage Payments
Cap Rate (Market Value)
Capitalization Rate is a rate of return that compares the yearly Net Operating Income (NOI) to the market value.
Calculation:
NOI / Market Value
Cash-on-Cash Return (CoC)
Annual Cash Flow / Cash Invested
Calculation:
Annual cash flow divided by initial cash invested.
Debt Coverage Ratio (DCR)
Net Operating Income (NOI) divided by total debt payments.
Calculation:
NOI / Total Debt Payments
Internal Rate of Return (IRR)
A metric for assessing profitability over time. IRR is the discount rate at which the net present value (NPV) of all future cash flows (positive and negative) from an investment equals zero — including both periodic cash flow (such as rent) and a projected sale at the end of the holding period. It represents the expected annualized return, accounting for income, expenses, and the recovery of capital through a future sale.
Purchase Details
Purchase PriceThe price paid for the property. Purchase price:
| $355,000 |
|---|---|
Amount FinancedThe amount of the purchase financed through a loan. Amount financed:
| -$284,000 |
Down paymentThe initial payment made towards the purchase. Down payment:
| $71,000 |
Closing CostsFees and expenses associated with purchasing a property, typically ranging from 2% to 5% of the home’s purchase price, paid at the end of a home purchase to cover services like lending, title transfer, and taxes. Closing costs:
| $10,650 |
Rehab CostsCosts incurred to repair or improve the property, including: roof, flooring, exterior siding, kitchen, exterior paint, bathrooms, etc. Rehab costs:
| $0 |
Initial Cash InvestedThe total initial cash invested in the property. Calculation:Down payment + Buying costs + Rehab costs Initial cash invested:
| $81,650 |
Square Feet (SQFT)The total square footage of the property. Square feet:
| 1,846 |
Cost Per Square FootCost per square foot of the property. Calculation:Purchase Price / Square Feet Cost per square foot:
| $192 |
Monthly Rent Per Square FootMonthly rent divided by the number of square feet. This ratio helps investors compare rental income efficiency across properties, markets, and unit sizes Calculation:Monthly Rent / Square Feet Monthly rent per square foot:
| $1.35 |
Financing Details
Loan AmountThe total sum of money borrowed from a lender to finance a property purchase. Calculation:Purchase Price - Down Payment
Loan amount:
| $284,000 |
|---|---|
Loan to Value Ratio (LTV)Loan amount divided by the market value of the property. Calculation:Loan Amount / Market Value
Loan to value ratio:
| 80.0% |
Loan TypeThe type of loan (e.g., fixed, adjustable).
Loan type:
| Amortizing |
TermThe loan repayment period in years.
Term:
| 30 years |
Interest RateThe percentage a lender charges on the borrowed amount of a loan, determining the cost of borrowing money.
Interest rate:
| 6.625% |
Principal & Interest (PI)The principal is the portion of the loan payment that reduces the loan balance. The interest is the lender's charge for borrowing money. Calculation:(P * r * (1 + r) ** n) / ((1 + r) ** n - 1) Where:
P = Loan amount (principal)
Principal & interest:
| $1,818 |
Property TaxesAnnual taxes levied by local governments on real estate properties. These taxes fund public services like schools, roads, and emergency services.
Property tax:
| $267 |
InsuranceThe costs for insurance coverage to protect against financial losses due to risks like fire, natural disasters, theft, liability, or tenant-related damages. Calculation:Assumes 7% of gross rental income, unless insurance rates are specified.
Insurance:
| $175 |
Private Mortgage Insurance (PMI)A fee that borrowers pay when they take out a conventional loan with a loan-to-value (LTV) ratio above 80%.
Private mortgage insurance (PMI):
| $0 |
Monthly PaymentThe fixed amount a borrower pays each month to repay a loan. It typically includes principal and interest (P&I) and may also cover property taxes, insurance, HOA fees, and PMI if escrowed. Monthly payment:
| $2,260 |
Operating Income
| % Rent | Monthly | Yearly | |
|---|---|---|---|
Gross RentThe total rental income received from tenants before deducting any expenses. Includes base rent, late fees, pet fees, parking fees, and other recurring charges.
Gross rent:
| $2,500 | $30,000 | |
Vacancy LossExpected loss of rent due to vacancies.
Vacancy loss:
(6%)
| 6% | -$150 | -$1,800 |
Operating IncomeGross rental income minus vacancy loss. Calculation:Gross rent - Vacancy loss
Operating income:
| $2,350 | $28,200 |
Operating Expenses
| % Rent | Monthly | Yearly | |
|---|---|---|---|
Property TaxesAnnual taxes levied by local governments on real estate properties. These taxes fund public services like schools, roads, and emergency services. | 11% | -$267 | -$3,207 |
InsuranceThe costs for insurance coverage to protect against financial losses due to risks like fire, natural disasters, theft, liability, or tenant-related damages. Calculation:Assumes 7% of gross rental income, unless insurance rates are specified. | 7% | -$175 | -$2,100 |
Property ManagementThe costs associated with hiring a property manager to handle the day-to-day operations of a rental property. Includes management fees, leasing fes, eviction fees, etc. Calculation:Assumes 8% of gross rental income. | 8% | -$200 | -$2,400 |
Repairs & MaintenanceOngoing costs for routine upkeep and minor fixes needed to keep a property in good working condition. Calculation:Assumes 5% of gross rental income. Varies by property age and condition. | 5% | -$125 | -$1,500 |
Capital ExpensesLarge, infrequent costs for major improvements or replacements, like a new roof, HVAC system, or appliances. Calculation:Assumes 5% of gross rental income. Varies by property age. | 5% | -$125 | -$1,500 |
HOA FeesRegular dues paid to a Homeowners Association for community maintenance, amenities, and management. Similar fees include: Condo Association Fees, Co-op Maintenance Fees, etc. | 8% | -$209 | -$2,508 |
Operating ExpensesRecurring costs required to maintain and manage a rental property, including property taxes, insurance, maintenance, repairs, utilities (if paid by the owner), property management fees, and other day-to-day expenses. Calculation:Insurance + Property Taxes + Property Management + Repairs & Maintenance + Capital Expenditures + HOA Fees | 44% | -$1,101 | -$13,215 |
Cash Flow
| Monthly | Yearly | |
|---|---|---|
Net Operating Income (NOI)The income generated from a property after deducting all operating expenses but before deducting mortgage payments, taxes, and capital expenditures. Calculation:Gross Operating Income - Operating Expenses
Net operating income:
| $1,249 | $14,988 |
Mortgage PaymentThe fixed amount a borrower pays each month to repay a loan. It typically includes principal and interest (P&I) and may also cover property taxes, insurance, HOA fees, and PMI if escrowed. | -$1,818 | -$21,816 |
Cash FlowNet Operating Income (NOI) minus mortgage payments. Calculation:NOI - Mortgage Payments | -$569 | -$6,828 |