$729,000
Investment Summary
- Monthly Cash Flow
- -$1,851
- Cap Rate
- 3.1%
- Cash-on-Cash Return
- -13.2%
- Debt Coverage Ratio
- 0.50
- Internal Rate of Return (5 years)
- -8.8%
Cash Flow
Net Operating Income (NOI) minus mortgage payments.
Calculation:
NOI - Mortgage Payments
Cap Rate (Market Value)
Capitalization Rate is a rate of return that compares the yearly Net Operating Income (NOI) to the market value.
Calculation:
NOI / Market Value
Cash-on-Cash Return (CoC)
Annual Cash Flow / Cash Invested
Calculation:
Annual cash flow divided by initial cash invested.
Debt Coverage Ratio (DCR)
Net Operating Income (NOI) divided by total debt payments.
Calculation:
NOI / Total Debt Payments
Internal Rate of Return (IRR)
A metric for assessing profitability over time. IRR is the discount rate at which the net present value (NPV) of all future cash flows (positive and negative) from an investment equals zero — including both periodic cash flow (such as rent) and a projected sale at the end of the holding period. It represents the expected annualized return, accounting for income, expenses, and the recovery of capital through a future sale.
Property Description
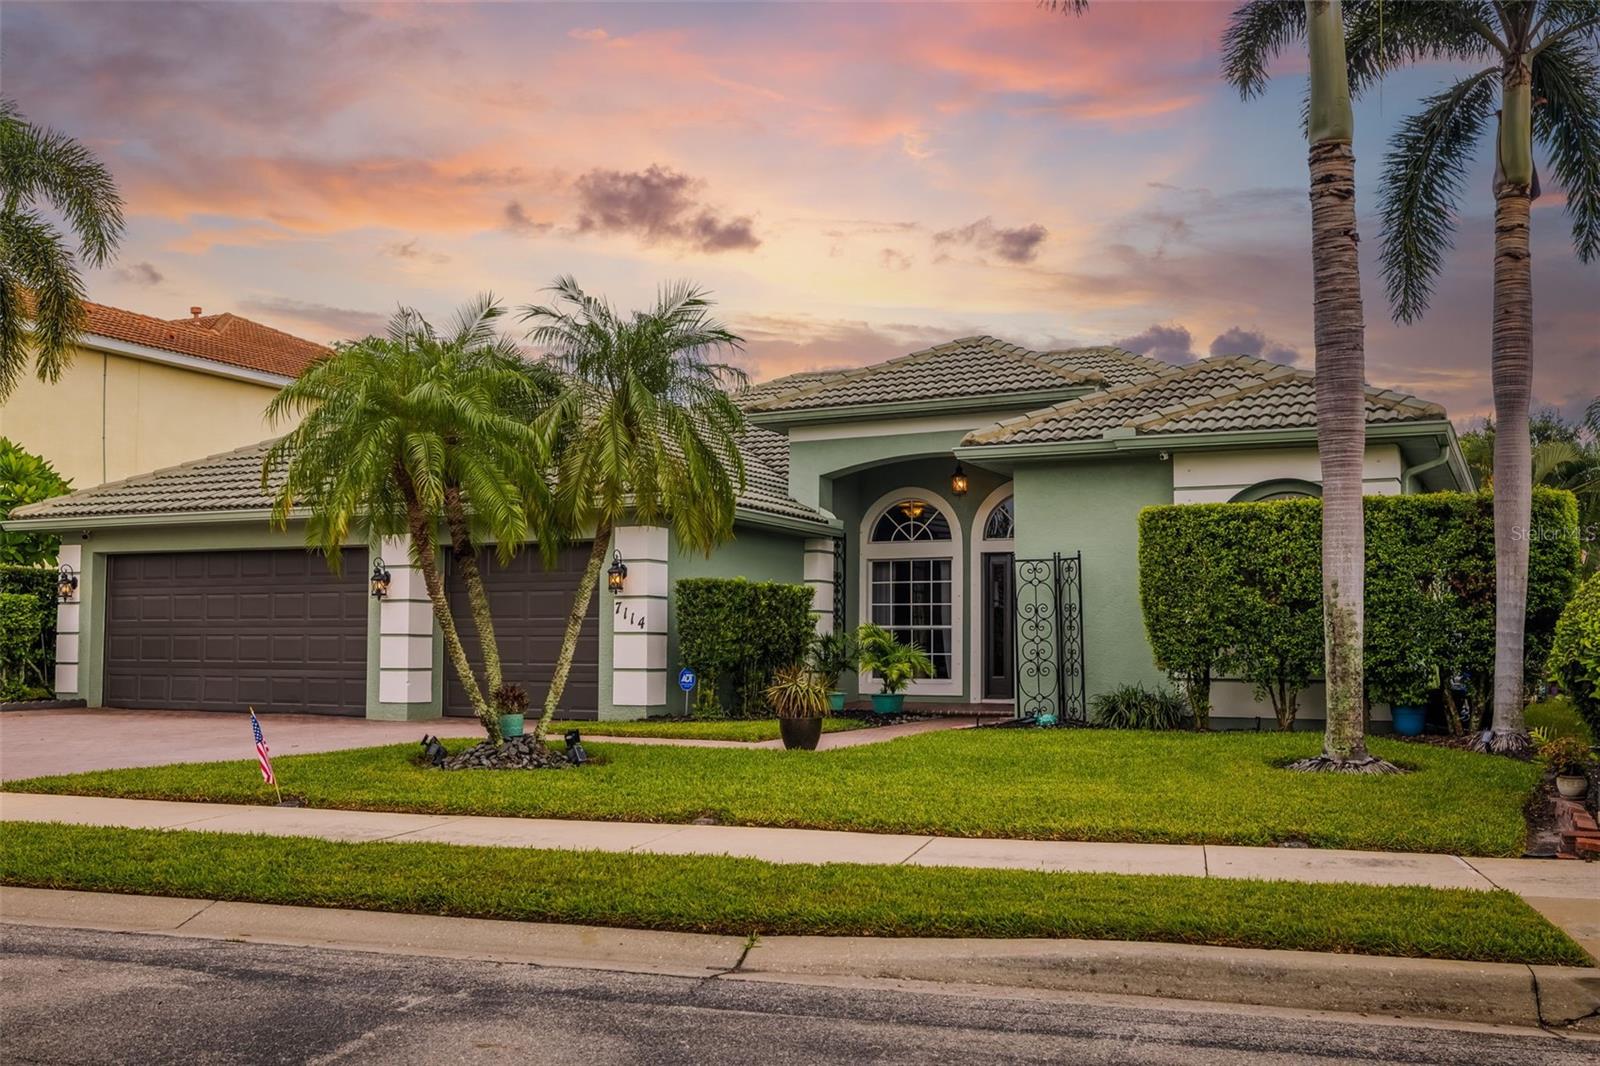
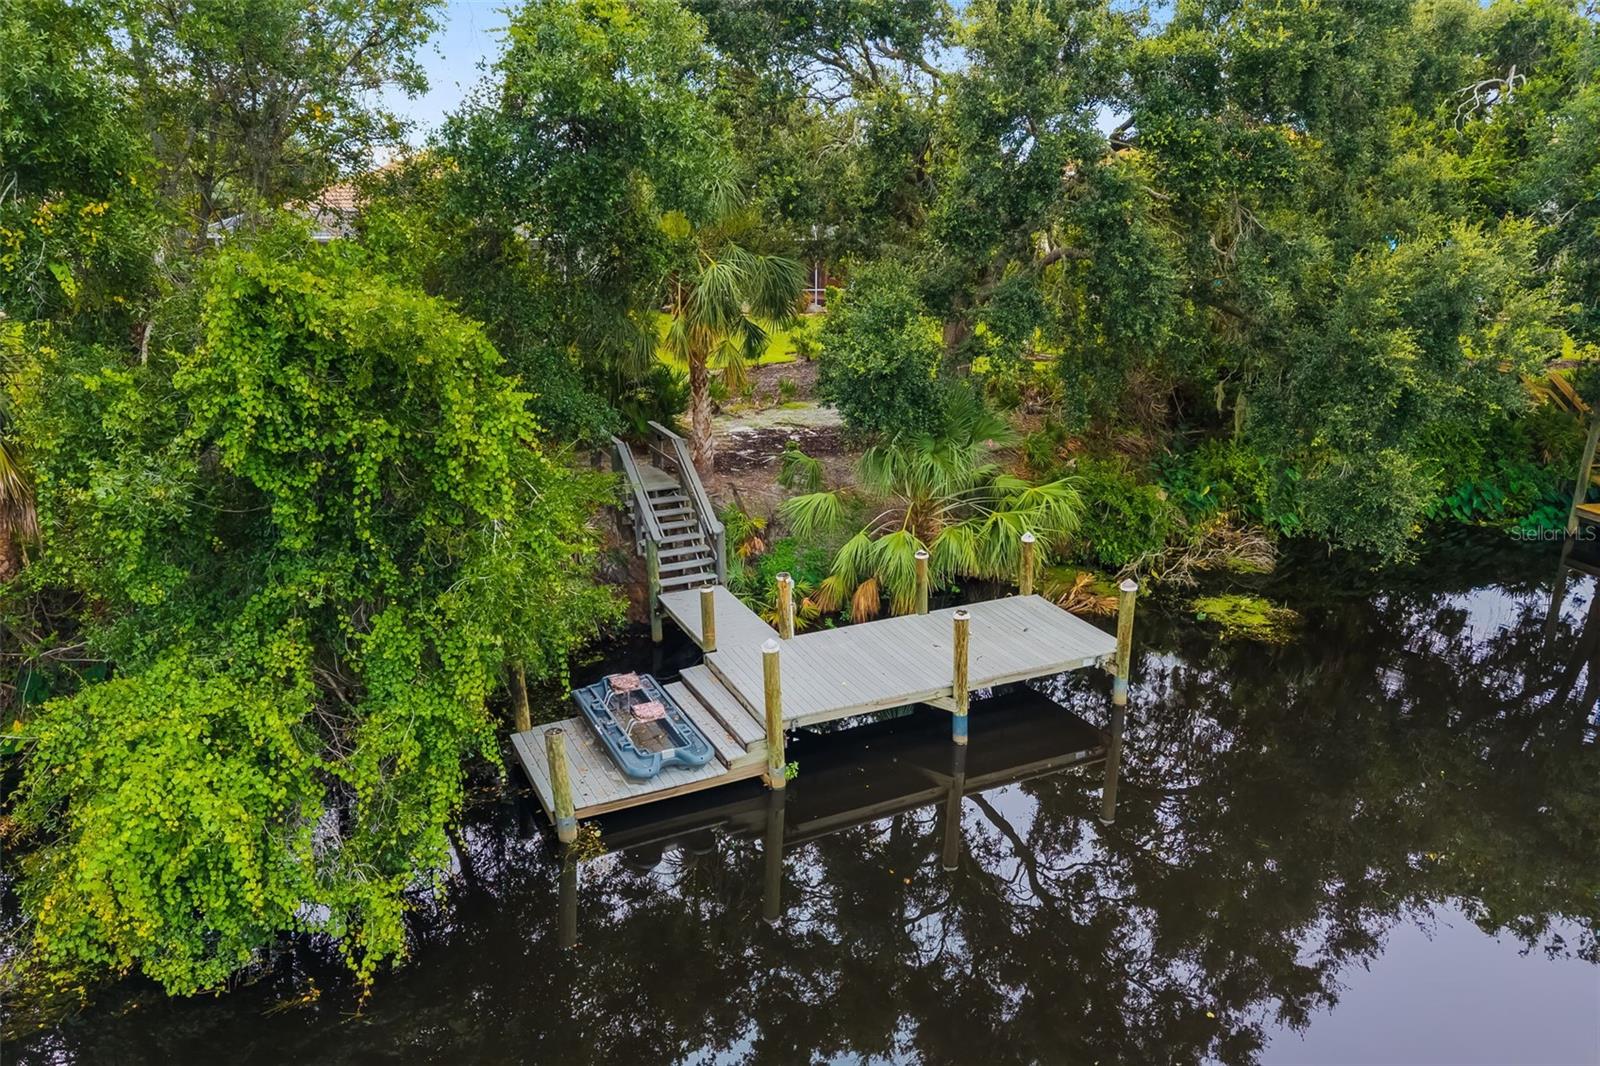
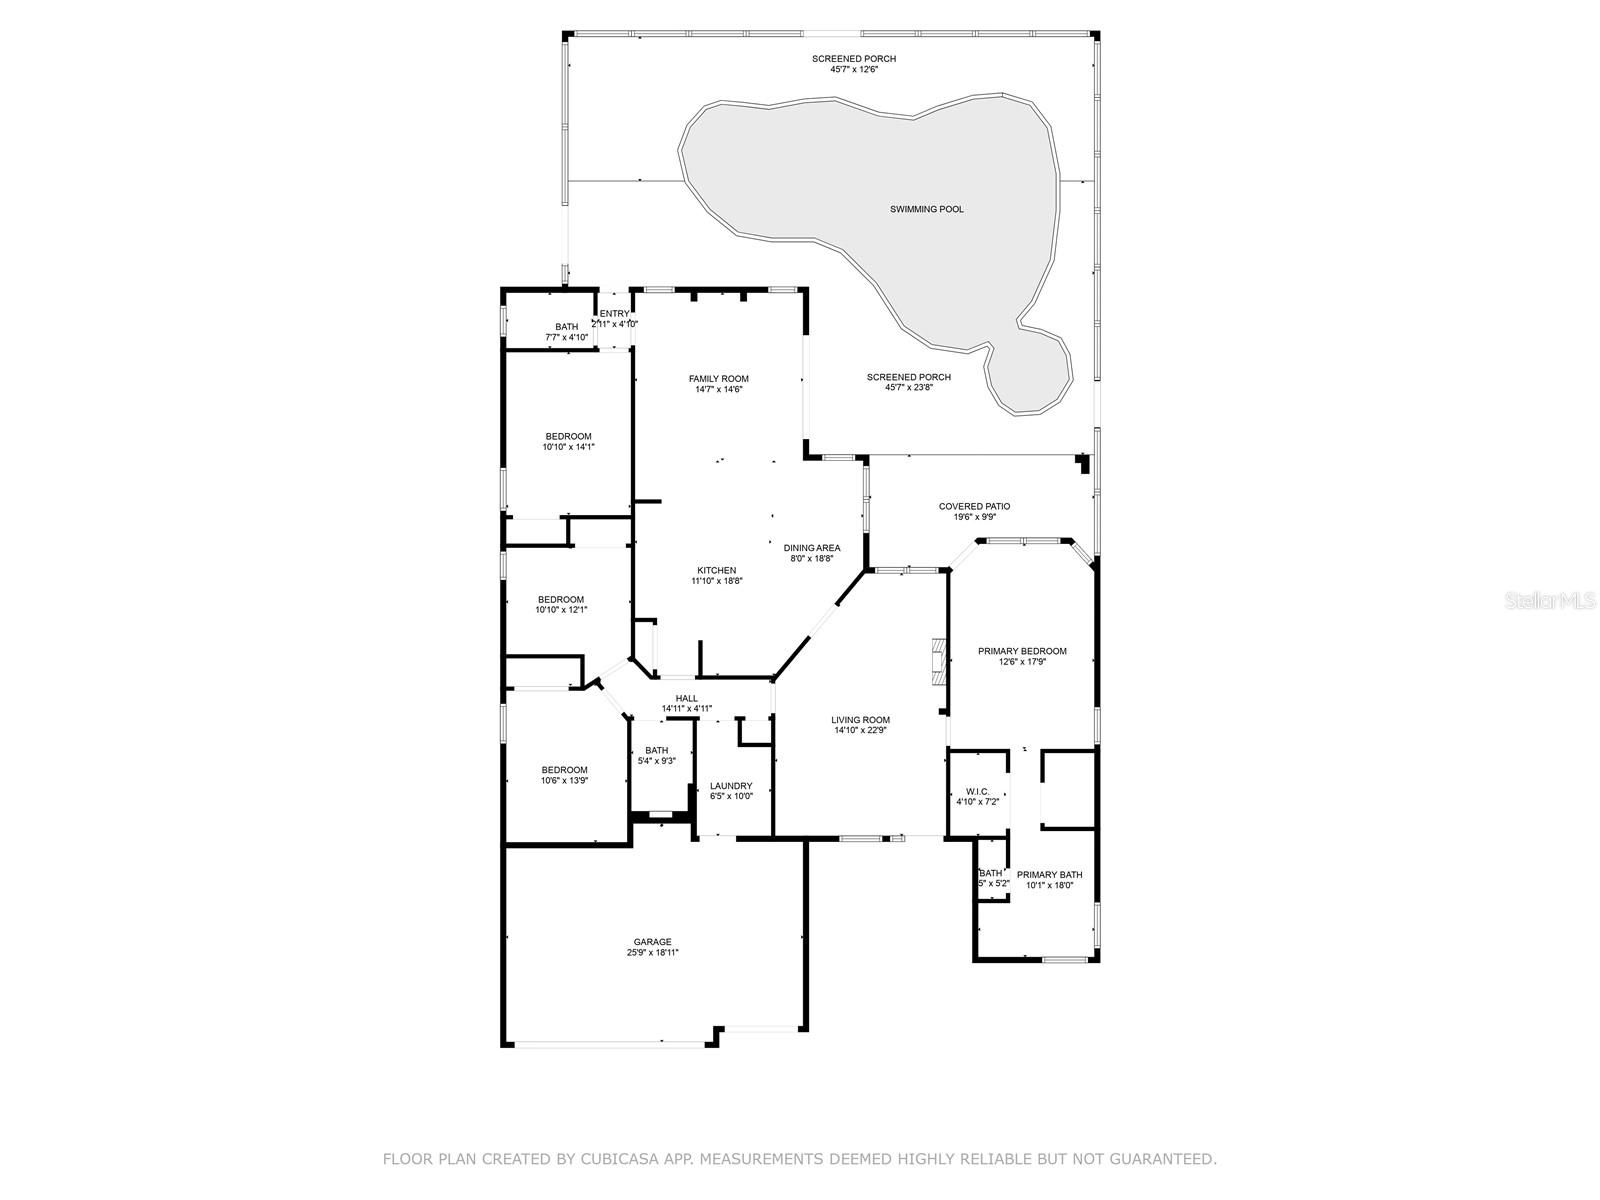
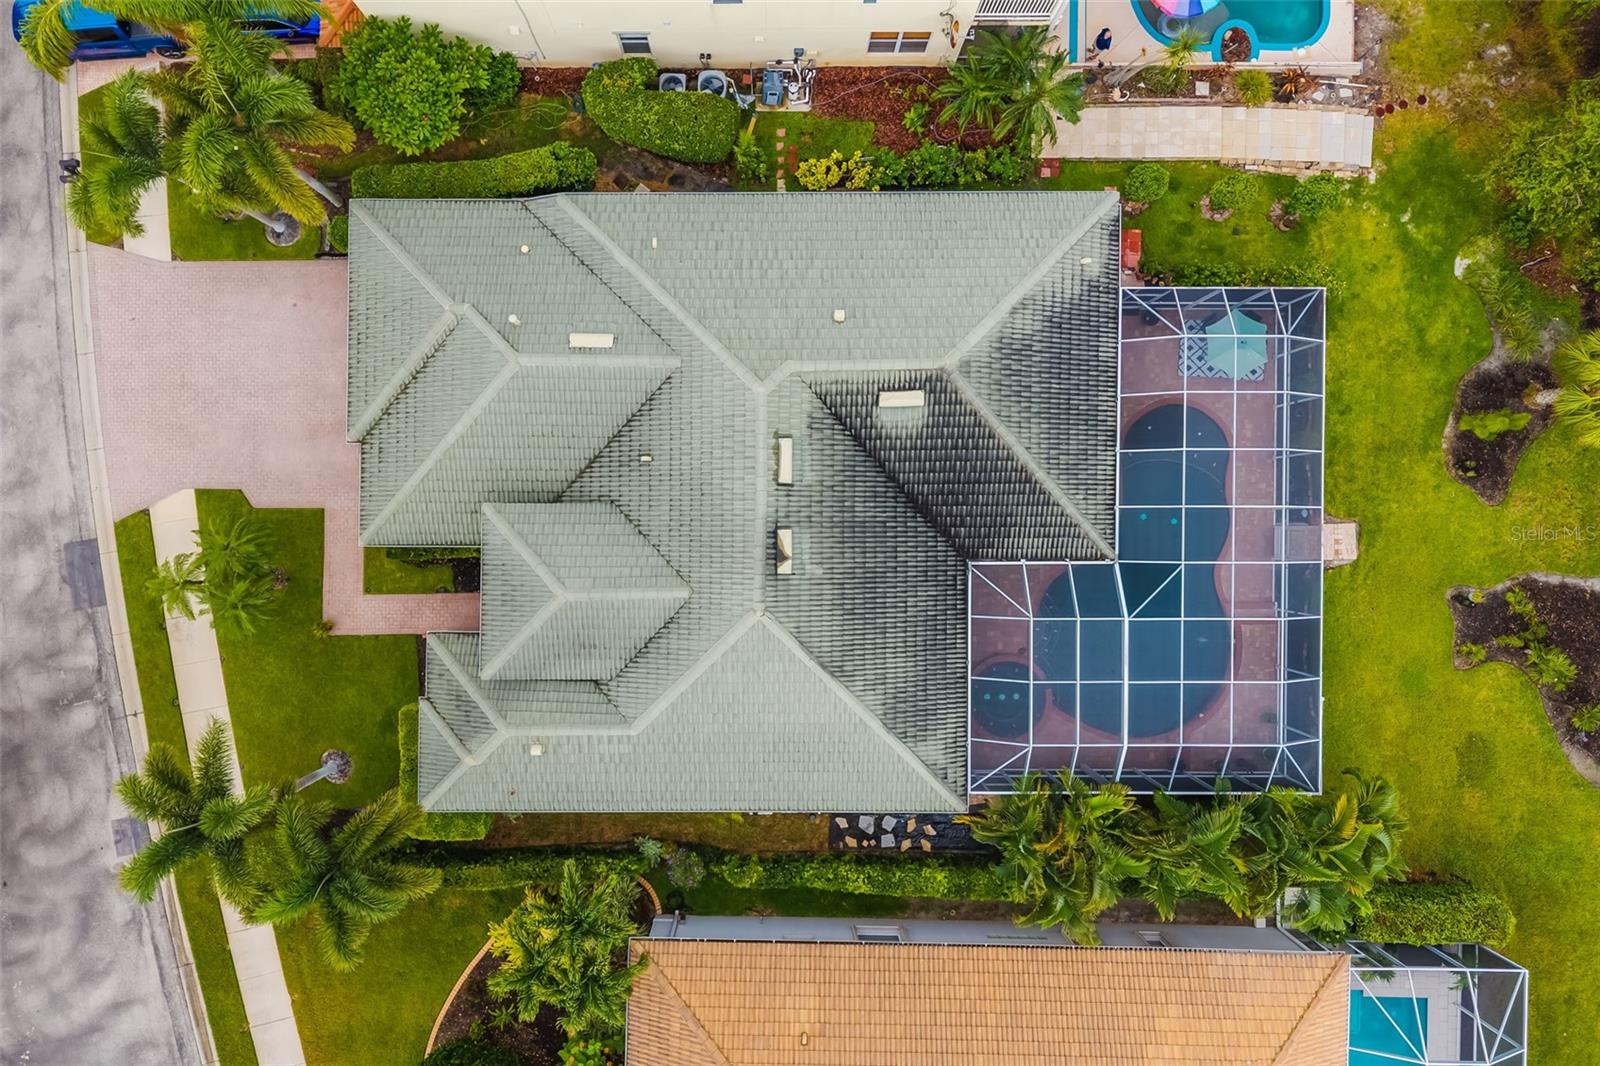
Welcome to your private waterfront oasis in the desirable River Place community! This stunning 4-bedroom, 3-bathroom home offers an unparalleled lifestyle with 100 feet of exclusive Braden River frontage and deeded riparian rights. KEY FEATURES: 4 Bedrooms, 3 Bathrooms, 3-Car Garage, Private Pool & Spa, Open Concept Design, Split Bedroom Floor Plan, 12’ Ceilings, Private Deep Water Dock, Riparian Rights, No Flood Zone (Did not flood in 2024), Pet & Smoke Free. Enjoy breathtaking river views from your spacious living areas, featuring two sets of sliders that open to a screened-in pool and spa. The primary suite offers direct access to the pool area for ultimate relaxation. This home is situated on a private, quiet, golf course and tree-lined street with no through access, ensuring peace and tranquility. RECENT UPGRADES:Professionally Painted Interior/Exterior (2025), Kitchen Renovation with New Appliances (except stove) (Feb 2025), Middle Bath Renovation (Nov 2024), Pool Bath Counter/Sink Replacement (Nov 2024), Upgraded HVAC with Hospital-Grade Air Purification. The seller will bring a gas line for outdoor kitchen to the lanai if buyer wants it added. WATERFRONT LIVING AT IT'S FINEST: The property boasts a private dock with 24 feet of deep water, providing ample space for boating and fishing. Enjoy direct access to the Braden River, Little Manatee River, Linger Lodge, and Jiggs Landing. The dock features electric service, composite decking, and pressure-treated posts, with recent maintenance including two post replacements in July 2025. The home's elevation is 11.5 feet above sea level, ensuring it's not in a flood zone, offering peace of mind during storm season. This is one of only seven homes in River Place with 100' exclusive Braden River frontage and deeded riparian rights. The dock is a substantial $38,000 composite dock with pressure treated posts and owner maintained. COMMUNITY AMENITIES & LOCATION: River Place is an upscale community with a blend of gated and non-gated homes, tile roofs, paver driveways, and walking/nature trails. Residents enjoy access to a community boat/canoe/kayak launch, playground, and a renovated amenity center with a pool, fitness center, and gathering space. The low HOA fees and absence of a CDD make this an incredibly attractive opportunity. Conveniently located off Tara Blvd (SR70), this home is just minutes away from Lakewood Ranch amenities, Sarasota Polo Club, Premier Sports Facility, hospitals, parks, restaurants, Mote Marine Aquarium (soon MOTE SEA), Bradenton Riverwalk, Anna Maria Island, and Siesta Key Beach. With easy access to everything the area has to offer, this waterfront gem won't last long! DON'T MISS THIS OPPORTUNITY: Schedule your private showing today and experience the ultimate in waterfront living. This meticulously maintained home offers a rare combination of luxury, privacy, and convenience. Welcome home!
Build Your Team
Quickly find investor-friendly professionals who can help you succeed in real estate investing at any stage of the investing journey.


Agents
Match with investor-friendly agents who can help you find, analyze, and close your next deal


Lenders
Get the best funding…find investor-friendly lenders who specialize in your deal strategy


Property Managers
Transition to passive investing. Find a trusted property management partnership that lasts.


Tax Pros & Accountants
Taxes and financial reporting made easy—find experts to create tax savings strategies, file taxes, and more
Location
Property Details
Parking
- Description: Garage
- Details: Driveway, Garage Door Opener, Off Street, Garage, Attached
- Garage Spaces: 3
- Spaces Total: 0
Bedroom Information
- # of Bedrooms: 4
Bathroom Information
- # of Baths (Full): 3
- # of Baths (Total): 3.0
Interior Features
- # of Rooms: 13
- # of Stories: 1
Exterior Features
- Exterior Walls Materials: Stucco
- Foundation: Slab
- Roof Type: Gable or Hip
- Roof Material: Tile
- Pool: Yes
HOA
- Has HOA: Yes
- Association: C&S Management
- HOA Fee: $385/quarterly
Land Information
- Land Use: Residential
- Land Use Subtype: Single Family Residential
Lot Information
- Parcel ID: 19013.16459
- Lot Size: 15398 sqft
Property Information
- Property Type: Single Family Residence
- Style: Contemporary, Ranch
- Year Built: 2004
Tax Information
- Annual Tax: $4,853
Utilities
- Water & Sewer: Public
- Heating: Heat Pump
- Cooling: Central Air
Location
- County: Manatee
Listing Details
Investment Summary
- Monthly Cash Flow
- -$1,851
- Cap Rate
- 3.1%
- Cash-on-Cash Return
- -13.2%
- Debt Coverage Ratio
- 0.50
- Internal Rate of Return (5 years)
- -8.8%
Cash Flow
Net Operating Income (NOI) minus mortgage payments.
Calculation:
NOI - Mortgage Payments
Cap Rate (Market Value)
Capitalization Rate is a rate of return that compares the yearly Net Operating Income (NOI) to the market value.
Calculation:
NOI / Market Value
Cash-on-Cash Return (CoC)
Annual Cash Flow / Cash Invested
Calculation:
Annual cash flow divided by initial cash invested.
Debt Coverage Ratio (DCR)
Net Operating Income (NOI) divided by total debt payments.
Calculation:
NOI / Total Debt Payments
Internal Rate of Return (IRR)
A metric for assessing profitability over time. IRR is the discount rate at which the net present value (NPV) of all future cash flows (positive and negative) from an investment equals zero — including both periodic cash flow (such as rent) and a projected sale at the end of the holding period. It represents the expected annualized return, accounting for income, expenses, and the recovery of capital through a future sale.
Purchase Details
Purchase PriceThe price paid for the property. Purchase price:
| $729,000 |
|---|---|
Amount FinancedThe amount of the purchase financed through a loan. Amount financed:
| -$583,200 |
Down paymentThe initial payment made towards the purchase. Down payment:
| $145,800 |
Closing CostsFees and expenses associated with purchasing a property, typically ranging from 2% to 5% of the home’s purchase price, paid at the end of a home purchase to cover services like lending, title transfer, and taxes. Closing costs:
| $21,870 |
Rehab CostsCosts incurred to repair or improve the property, including: roof, flooring, exterior siding, kitchen, exterior paint, bathrooms, etc. Rehab costs:
| $0 |
Initial Cash InvestedThe total initial cash invested in the property. Calculation:Down payment + Buying costs + Rehab costs Initial cash invested:
| $167,670 |
Square Feet (SQFT)The total square footage of the property. Square feet:
| 2,274 |
Cost Per Square FootCost per square foot of the property. Calculation:Purchase Price / Square Feet Cost per square foot:
| $321 |
Monthly Rent Per Square FootMonthly rent divided by the number of square feet. This ratio helps investors compare rental income efficiency across properties, markets, and unit sizes Calculation:Monthly Rent / Square Feet Monthly rent per square foot:
| $1.54 |
Financing Details
Loan AmountThe total sum of money borrowed from a lender to finance a property purchase. Calculation:Purchase Price - Down Payment
Loan amount:
| $583,200 |
|---|---|
Loan to Value Ratio (LTV)Loan amount divided by the market value of the property. Calculation:Loan Amount / Market Value
Loan to value ratio:
| 80.0% |
Loan TypeThe type of loan (e.g., fixed, adjustable).
Loan type:
| Amortizing |
TermThe loan repayment period in years.
Term:
| 30 years |
Interest RateThe percentage a lender charges on the borrowed amount of a loan, determining the cost of borrowing money.
Interest rate:
| 6.625% |
Principal & Interest (PI)The principal is the portion of the loan payment that reduces the loan balance. The interest is the lender's charge for borrowing money. Calculation:(P * r * (1 + r) ** n) / ((1 + r) ** n - 1) Where:
P = Loan amount (principal)
Principal & interest:
| $3,734 |
Property TaxesAnnual taxes levied by local governments on real estate properties. These taxes fund public services like schools, roads, and emergency services.
Property tax:
| $404 |
InsuranceThe costs for insurance coverage to protect against financial losses due to risks like fire, natural disasters, theft, liability, or tenant-related damages. Calculation:Assumes 7% of gross rental income, unless insurance rates are specified.
Insurance:
| $245 |
Private Mortgage Insurance (PMI)A fee that borrowers pay when they take out a conventional loan with a loan-to-value (LTV) ratio above 80%.
Private mortgage insurance (PMI):
| $0 |
Monthly PaymentThe fixed amount a borrower pays each month to repay a loan. It typically includes principal and interest (P&I) and may also cover property taxes, insurance, HOA fees, and PMI if escrowed. Monthly payment:
| $4,383 |
Operating Income
| % Rent | Monthly | Yearly | |
|---|---|---|---|
Gross RentThe total rental income received from tenants before deducting any expenses. Includes base rent, late fees, pet fees, parking fees, and other recurring charges.
Gross rent:
| $3,500 | $42,000 | |
Vacancy LossExpected loss of rent due to vacancies.
Vacancy loss:
(6%)
| 6% | -$210 | -$2,520 |
Operating IncomeGross rental income minus vacancy loss. Calculation:Gross rent - Vacancy loss
Operating income:
| $3,290 | $39,480 |
Operating Expenses
| % Rent | Monthly | Yearly | |
|---|---|---|---|
Property TaxesAnnual taxes levied by local governments on real estate properties. These taxes fund public services like schools, roads, and emergency services. | 12% | -$404 | -$4,853 |
InsuranceThe costs for insurance coverage to protect against financial losses due to risks like fire, natural disasters, theft, liability, or tenant-related damages. Calculation:Assumes 7% of gross rental income, unless insurance rates are specified. | 7% | -$245 | -$2,940 |
Property ManagementThe costs associated with hiring a property manager to handle the day-to-day operations of a rental property. Includes management fees, leasing fes, eviction fees, etc. Calculation:Assumes 8% of gross rental income. | 8% | -$280 | -$3,360 |
Repairs & MaintenanceOngoing costs for routine upkeep and minor fixes needed to keep a property in good working condition. Calculation:Assumes 5% of gross rental income. Varies by property age and condition. | 5% | -$175 | -$2,100 |
Capital ExpensesLarge, infrequent costs for major improvements or replacements, like a new roof, HVAC system, or appliances. Calculation:Assumes 5% of gross rental income. Varies by property age. | 5% | -$175 | -$2,100 |
HOA FeesRegular dues paid to a Homeowners Association for community maintenance, amenities, and management. Similar fees include: Condo Association Fees, Co-op Maintenance Fees, etc. | 4% | -$128 | -$1,536 |
Operating ExpensesRecurring costs required to maintain and manage a rental property, including property taxes, insurance, maintenance, repairs, utilities (if paid by the owner), property management fees, and other day-to-day expenses. Calculation:Insurance + Property Taxes + Property Management + Repairs & Maintenance + Capital Expenditures + HOA Fees | 40% | -$1,407 | -$16,889 |
Cash Flow
| Monthly | Yearly | |
|---|---|---|
Net Operating Income (NOI)The income generated from a property after deducting all operating expenses but before deducting mortgage payments, taxes, and capital expenditures. Calculation:Gross Operating Income - Operating Expenses
Net operating income:
| $1,883 | $22,596 |
Mortgage PaymentThe fixed amount a borrower pays each month to repay a loan. It typically includes principal and interest (P&I) and may also cover property taxes, insurance, HOA fees, and PMI if escrowed. | -$3,734 | -$44,808 |
Cash FlowNet Operating Income (NOI) minus mortgage payments. Calculation:NOI - Mortgage Payments | $1,851 | $22,212 |