$919,000
Investment Summary
- Monthly Cash Flow
- -$2,031
- Cap Rate
- 3.5%
- Cash-on-Cash Return
- -11.5%
- Debt Coverage Ratio
- 0.57
- Internal Rate of Return (5 years)
- -7.2%
Cash Flow
Net Operating Income (NOI) minus mortgage payments.
Calculation:
NOI - Mortgage Payments
Cap Rate (Market Value)
Capitalization Rate is a rate of return that compares the yearly Net Operating Income (NOI) to the market value.
Calculation:
NOI / Market Value
Cash-on-Cash Return (CoC)
Annual Cash Flow / Cash Invested
Calculation:
Annual cash flow divided by initial cash invested.
Debt Coverage Ratio (DCR)
Net Operating Income (NOI) divided by total debt payments.
Calculation:
NOI / Total Debt Payments
Internal Rate of Return (IRR)
A metric for assessing profitability over time. IRR is the discount rate at which the net present value (NPV) of all future cash flows (positive and negative) from an investment equals zero — including both periodic cash flow (such as rent) and a projected sale at the end of the holding period. It represents the expected annualized return, accounting for income, expenses, and the recovery of capital through a future sale.
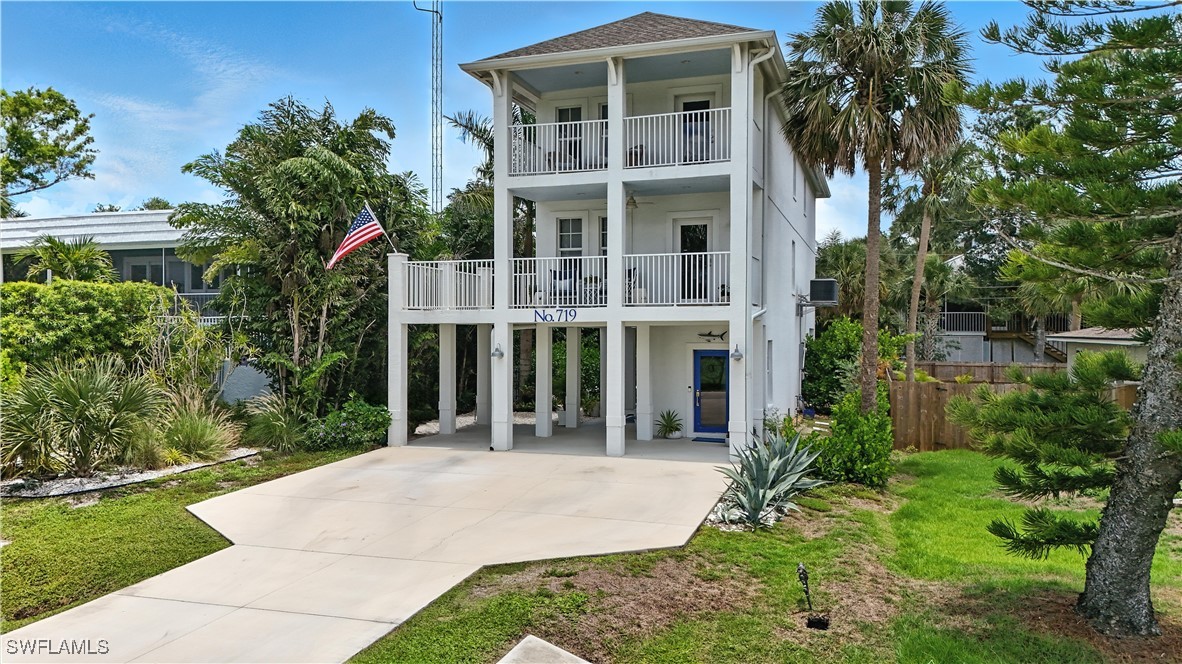
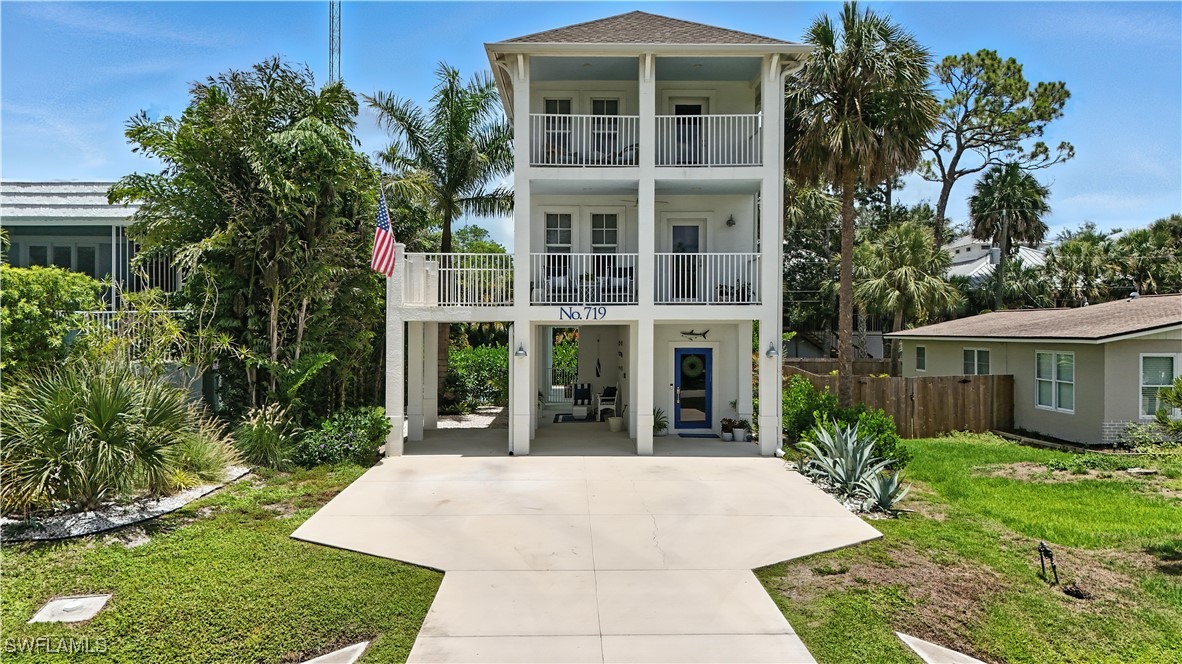
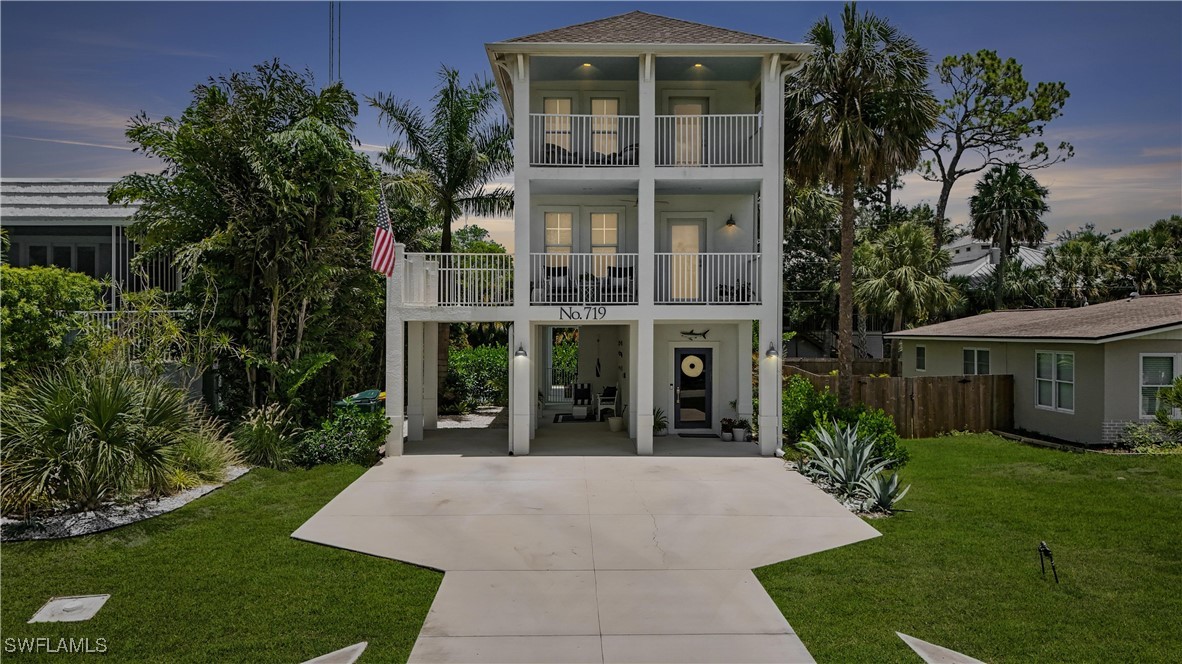
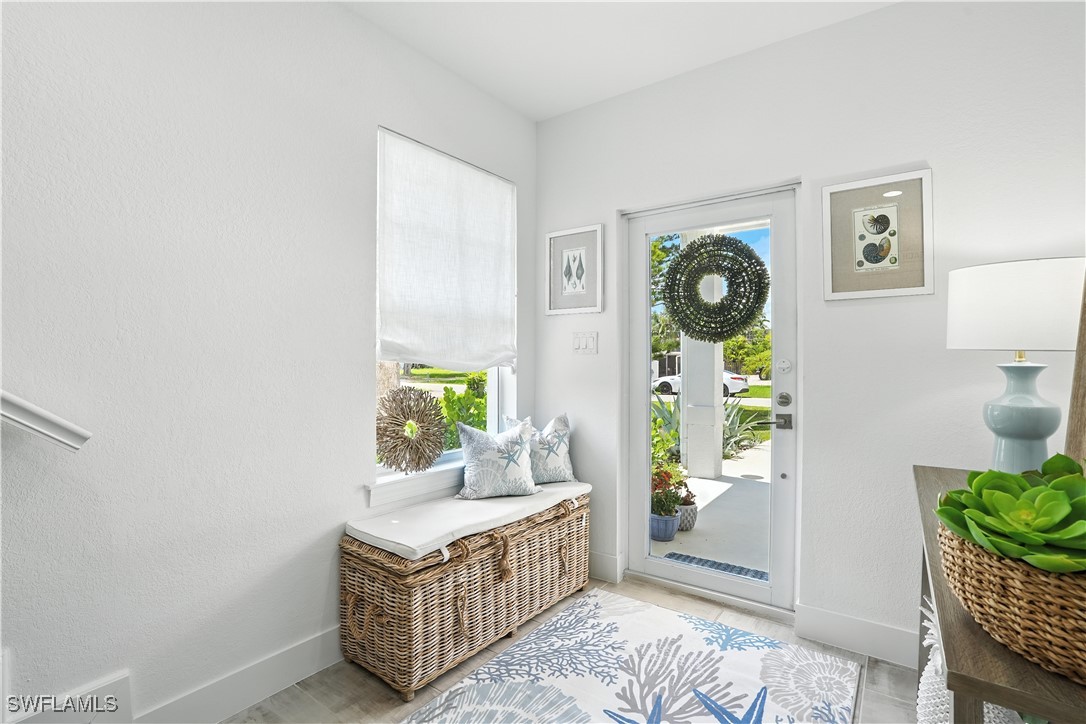
Property Description
THIS one of a kind home is the perfect blend of modern coastal luxury and it could be YOURS now. Custom built in 2016, and thoughtfully updated since, this tropical retreat was built to weather the storms. Featuring concrete block construction on all levels and impact rated windows and doors. Sellers have transferable flood policy UNDER $900/yr. Step inside the welcoming ground level foyer, and see this home is immaculately maintained and filled with elegant coastal charm. A bonus air conditioned room under the stairs makes a great home office or additional storage room. On the main floor, natural light pours into the open-concept living spaces. The modern kitchen features stunning marble countertops, Café appliances, a spacious pantry, and stylish finishes. Spacious family room and half bath in back of the home overlooking the tropical hedges surrounding this home, giving you privacy on every level. Dining area and living room in front of the house perfect for entertaining. Enjoy morning coffee or alfresco dining on the large covered balcony and the side terrace, both offering peaceful views of the lush courtyard and sparkling pool below. Back inside and upstairs to the top level, with light filled hallways leading to the bedrooms. The primary suite, in the front of the house is your perfect peaceful retreat complete with another private covered balcony. Where you can enjoy a glass of wine and the sunset views over a canopy of palms. The en-suite bathroom features updated dual vanity, walk in shower and walk in closet. Two additional guest rooms, a full bath and laundry closet complete the split floor plan of the top floor. With dual zone air conditioning to keep cool on any level. Back on the ground floor, covered carport, vibrant landscaping and a covered courtyard seating area leads to your gated backyard oasis. Imagine soaking up the sun in the new modern pool and rinsing off in the outdoor shower. A spacious covered outdoor lounge area, and privacy hedges make the perfect space to throw your next poolside gathering. A large storage room completes the ground floor of this home, with shelving and space for all your decor, bikes, and beach gear. Located across the street, is the community boat dock. An optional HOA with gulf access boat dock space or kayak storage, steps from your front door. Pull up your boat across the street and load up for a day of fun in the sun. Or jump in your kayak and take in the water and wildlife. Located off Wiggins Pass Rd, Gulf Harbor is a hidden gem in Naples. This peaceful neighborhood is a blend of luxury new construction, and classic Florida style homes, with proximity to white sand beaches, top notch marinas, world-class dining, and all that Naples Florida has to offer. Amazing rental potential means this could be the investment opportunity you’ve been waiting for. A rare opportunity to own a truly unique home at an exceptional value. There is nothing else like this on the market in this price point.
Build Your Team
Quickly find investor-friendly professionals who can help you succeed in real estate investing at any stage of the investing journey.


Agents
Match with investor-friendly agents who can help you find, analyze, and close your next deal


Lenders
Get the best funding…find investor-friendly lenders who specialize in your deal strategy


Property Managers
Transition to passive investing. Find a trusted property management partnership that lasts.


Tax Pros & Accountants
Taxes and financial reporting made easy—find experts to create tax savings strategies, file taxes, and more
Location
Property Details
Parking
- Description: Carport
- Details: Covered, Driveway, Paved, Attached Carport
- Garage Spaces: 0
- Spaces Total: 0
Bedroom Information
- # of Bedrooms: 3
Bathroom Information
- # of Baths (Full): 2
- # of Baths (Total): 3.0
Interior Features
- # of Rooms: 4
- # of Stories: 3
Exterior Features
- Roof Material: Shingle
- Pool: Yes
Land Information
- Land Use: Residential
- Land Use Subtype: Single Family Residential
Lot Information
- Parcel ID: 48074760105
- Lot Size: 0 sqft
Property Information
- Property Type: Single Family Residence
- Style: Multi Level, Two Story
- Year Built: 2016
Tax Information
- Annual Tax: $5,963
Utilities
- Water & Sewer: Public
- Heating: Central, Electric
- Cooling: Central Air, Electric
Location
- County: Collier
Listing Details
Investment Summary
- Monthly Cash Flow
- -$2,031
- Cap Rate
- 3.5%
- Cash-on-Cash Return
- -11.5%
- Debt Coverage Ratio
- 0.57
- Internal Rate of Return (5 years)
- -7.2%
Cash Flow
Net Operating Income (NOI) minus mortgage payments.
Calculation:
NOI - Mortgage Payments
Cap Rate (Market Value)
Capitalization Rate is a rate of return that compares the yearly Net Operating Income (NOI) to the market value.
Calculation:
NOI / Market Value
Cash-on-Cash Return (CoC)
Annual Cash Flow / Cash Invested
Calculation:
Annual cash flow divided by initial cash invested.
Debt Coverage Ratio (DCR)
Net Operating Income (NOI) divided by total debt payments.
Calculation:
NOI / Total Debt Payments
Internal Rate of Return (IRR)
A metric for assessing profitability over time. IRR is the discount rate at which the net present value (NPV) of all future cash flows (positive and negative) from an investment equals zero — including both periodic cash flow (such as rent) and a projected sale at the end of the holding period. It represents the expected annualized return, accounting for income, expenses, and the recovery of capital through a future sale.
Purchase Details
Purchase PriceThe price paid for the property. Purchase price:
| $919,000 |
|---|---|
Amount FinancedThe amount of the purchase financed through a loan. Amount financed:
| -$735,200 |
Down paymentThe initial payment made towards the purchase. Down payment:
| $183,800 |
Closing CostsFees and expenses associated with purchasing a property, typically ranging from 2% to 5% of the home’s purchase price, paid at the end of a home purchase to cover services like lending, title transfer, and taxes. Closing costs:
| $27,570 |
Rehab CostsCosts incurred to repair or improve the property, including: roof, flooring, exterior siding, kitchen, exterior paint, bathrooms, etc. Rehab costs:
| $0 |
Initial Cash InvestedThe total initial cash invested in the property. Calculation:Down payment + Buying costs + Rehab costs Initial cash invested:
| $211,370 |
Square Feet (SQFT)The total square footage of the property. Square feet:
| 2,374 |
Cost Per Square FootCost per square foot of the property. Calculation:Purchase Price / Square Feet Cost per square foot:
| $387 |
Monthly Rent Per Square FootMonthly rent divided by the number of square feet. This ratio helps investors compare rental income efficiency across properties, markets, and unit sizes Calculation:Monthly Rent / Square Feet Monthly rent per square foot:
| $1.94 |
Financing Details
Loan AmountThe total sum of money borrowed from a lender to finance a property purchase. Calculation:Purchase Price - Down Payment
Loan amount:
| $735,200 |
|---|---|
Loan to Value Ratio (LTV)Loan amount divided by the market value of the property. Calculation:Loan Amount / Market Value
Loan to value ratio:
| 80.0% |
Loan TypeThe type of loan (e.g., fixed, adjustable).
Loan type:
| Amortizing |
TermThe loan repayment period in years.
Term:
| 30 years |
Interest RateThe percentage a lender charges on the borrowed amount of a loan, determining the cost of borrowing money.
Interest rate:
| 6.625% |
Principal & Interest (PI)The principal is the portion of the loan payment that reduces the loan balance. The interest is the lender's charge for borrowing money. Calculation:(P * r * (1 + r) ** n) / ((1 + r) ** n - 1) Where:
P = Loan amount (principal)
Principal & interest:
| $4,708 |
Property TaxesAnnual taxes levied by local governments on real estate properties. These taxes fund public services like schools, roads, and emergency services.
Property tax:
| $497 |
InsuranceThe costs for insurance coverage to protect against financial losses due to risks like fire, natural disasters, theft, liability, or tenant-related damages. Calculation:Assumes 7% of gross rental income, unless insurance rates are specified.
Insurance:
| $322 |
Private Mortgage Insurance (PMI)A fee that borrowers pay when they take out a conventional loan with a loan-to-value (LTV) ratio above 80%.
Private mortgage insurance (PMI):
| $0 |
Monthly PaymentThe fixed amount a borrower pays each month to repay a loan. It typically includes principal and interest (P&I) and may also cover property taxes, insurance, HOA fees, and PMI if escrowed. Monthly payment:
| $5,527 |
Operating Income
| % Rent | Monthly | Yearly | |
|---|---|---|---|
Gross RentThe total rental income received from tenants before deducting any expenses. Includes base rent, late fees, pet fees, parking fees, and other recurring charges.
Gross rent:
| $4,600 | $55,200 | |
Vacancy LossExpected loss of rent due to vacancies.
Vacancy loss:
(6%)
| 6% | -$276 | -$3,312 |
Operating IncomeGross rental income minus vacancy loss. Calculation:Gross rent - Vacancy loss
Operating income:
| $4,324 | $51,888 |
Operating Expenses
| % Rent | Monthly | Yearly | |
|---|---|---|---|
Property TaxesAnnual taxes levied by local governments on real estate properties. These taxes fund public services like schools, roads, and emergency services. | 11% | -$497 | -$5,964 |
InsuranceThe costs for insurance coverage to protect against financial losses due to risks like fire, natural disasters, theft, liability, or tenant-related damages. Calculation:Assumes 7% of gross rental income, unless insurance rates are specified. | 7% | -$322 | -$3,864 |
Property ManagementThe costs associated with hiring a property manager to handle the day-to-day operations of a rental property. Includes management fees, leasing fes, eviction fees, etc. Calculation:Assumes 8% of gross rental income. | 8% | -$368 | -$4,416 |
Repairs & MaintenanceOngoing costs for routine upkeep and minor fixes needed to keep a property in good working condition. Calculation:Assumes 5% of gross rental income. Varies by property age and condition. | 5% | -$230 | -$2,760 |
Capital ExpensesLarge, infrequent costs for major improvements or replacements, like a new roof, HVAC system, or appliances. Calculation:Assumes 5% of gross rental income. Varies by property age. | 5% | -$230 | -$2,760 |
HOA FeesRegular dues paid to a Homeowners Association for community maintenance, amenities, and management. Similar fees include: Condo Association Fees, Co-op Maintenance Fees, etc. | n/a | n/a | n/a |
Operating ExpensesRecurring costs required to maintain and manage a rental property, including property taxes, insurance, maintenance, repairs, utilities (if paid by the owner), property management fees, and other day-to-day expenses. Calculation:Insurance + Property Taxes + Property Management + Repairs & Maintenance + Capital Expenditures + HOA Fees | 36% | -$1,647 | -$19,764 |
Cash Flow
| Monthly | Yearly | |
|---|---|---|
Net Operating Income (NOI)The income generated from a property after deducting all operating expenses but before deducting mortgage payments, taxes, and capital expenditures. Calculation:Gross Operating Income - Operating Expenses
Net operating income:
| $2,677 | $32,124 |
Mortgage PaymentThe fixed amount a borrower pays each month to repay a loan. It typically includes principal and interest (P&I) and may also cover property taxes, insurance, HOA fees, and PMI if escrowed. | -$4,708 | -$56,496 |
Cash FlowNet Operating Income (NOI) minus mortgage payments. Calculation:NOI - Mortgage Payments | -$2,031 | -$24,372 |