
$1,400,000
Investment Summary
- Monthly Cash Flow
- -$4,607
- Cap Rate
- 1.7%
- Cash-on-Cash Return
- -17.2%
- Debt Coverage Ratio
- 0.30
- Internal Rate of Return (5 years)
- -12.6%
Cash Flow
Net Operating Income (NOI) minus mortgage payments.
Calculation:
NOI - Mortgage Payments
Cap Rate (Market Value)
Capitalization Rate is a rate of return that compares the yearly Net Operating Income (NOI) to the market value.
Calculation:
NOI / Market Value
Cash-on-Cash Return (CoC)
Annual Cash Flow / Cash Invested
Calculation:
Annual cash flow divided by initial cash invested.
Debt Coverage Ratio (DCR)
Net Operating Income (NOI) divided by total debt payments.
Calculation:
NOI / Total Debt Payments
Internal Rate of Return (IRR)
A metric for assessing profitability over time. IRR is the discount rate at which the net present value (NPV) of all future cash flows (positive and negative) from an investment equals zero — including both periodic cash flow (such as rent) and a projected sale at the end of the holding period. It represents the expected annualized return, accounting for income, expenses, and the recovery of capital through a future sale.
Property Description
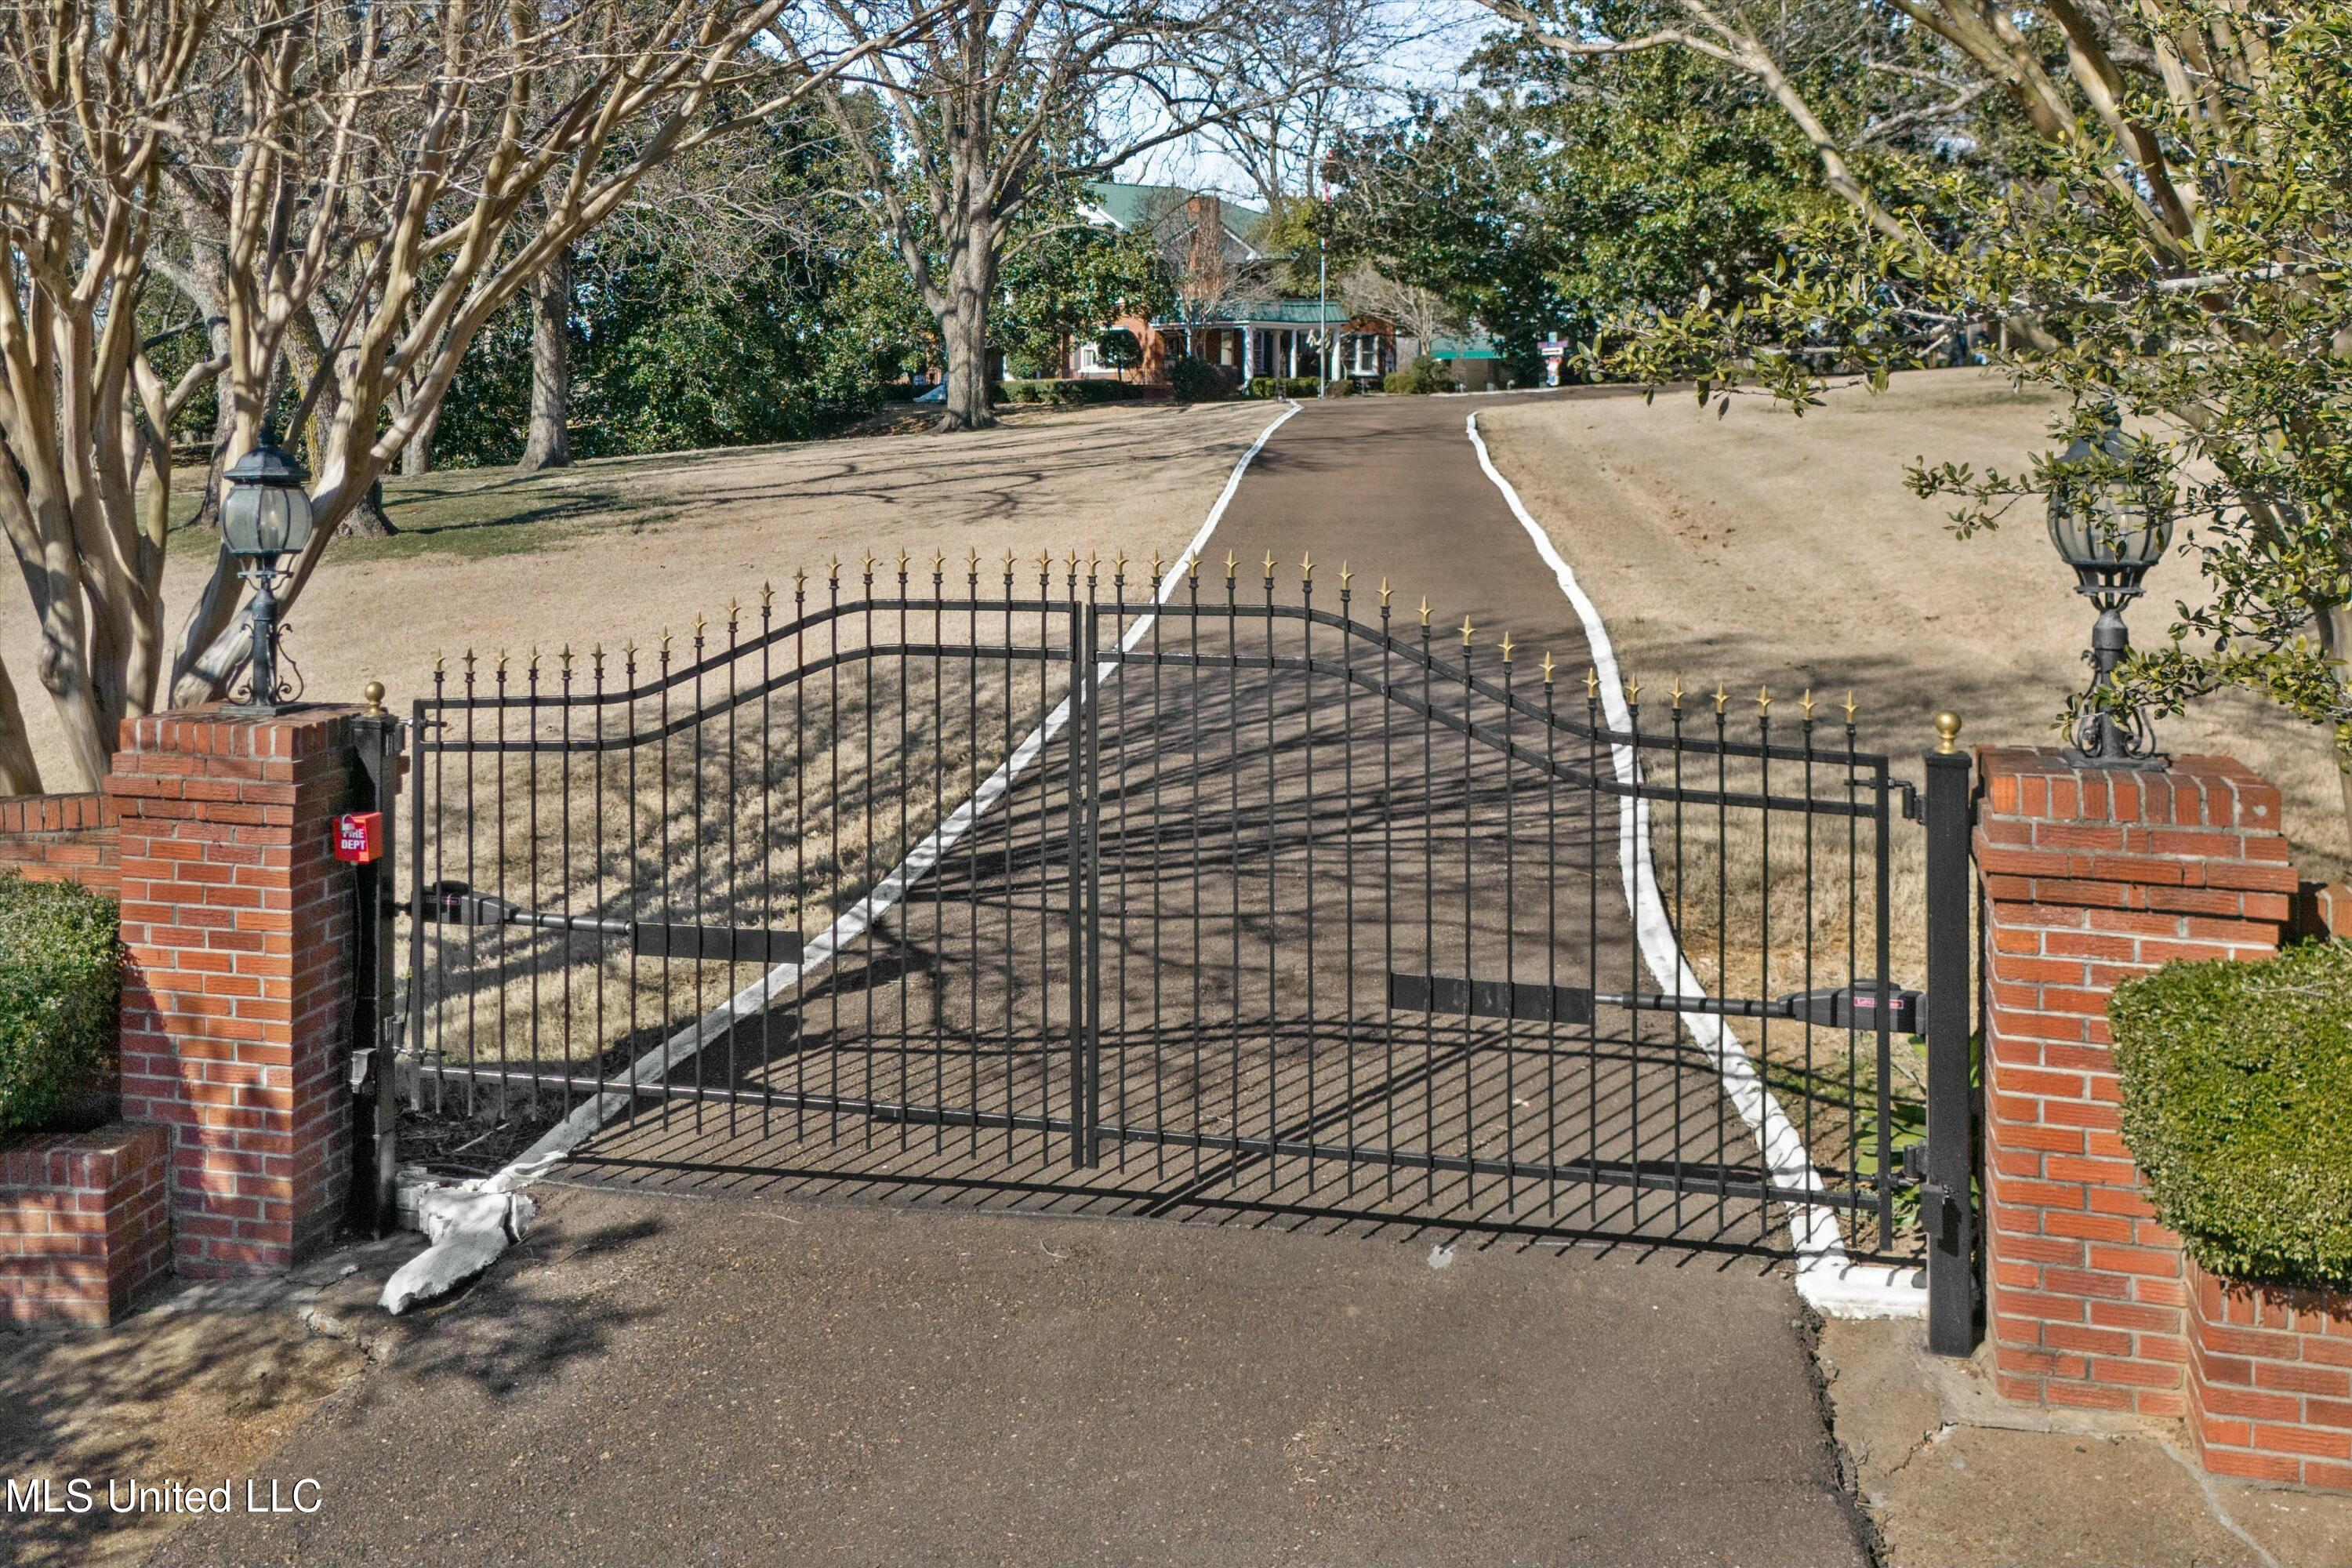
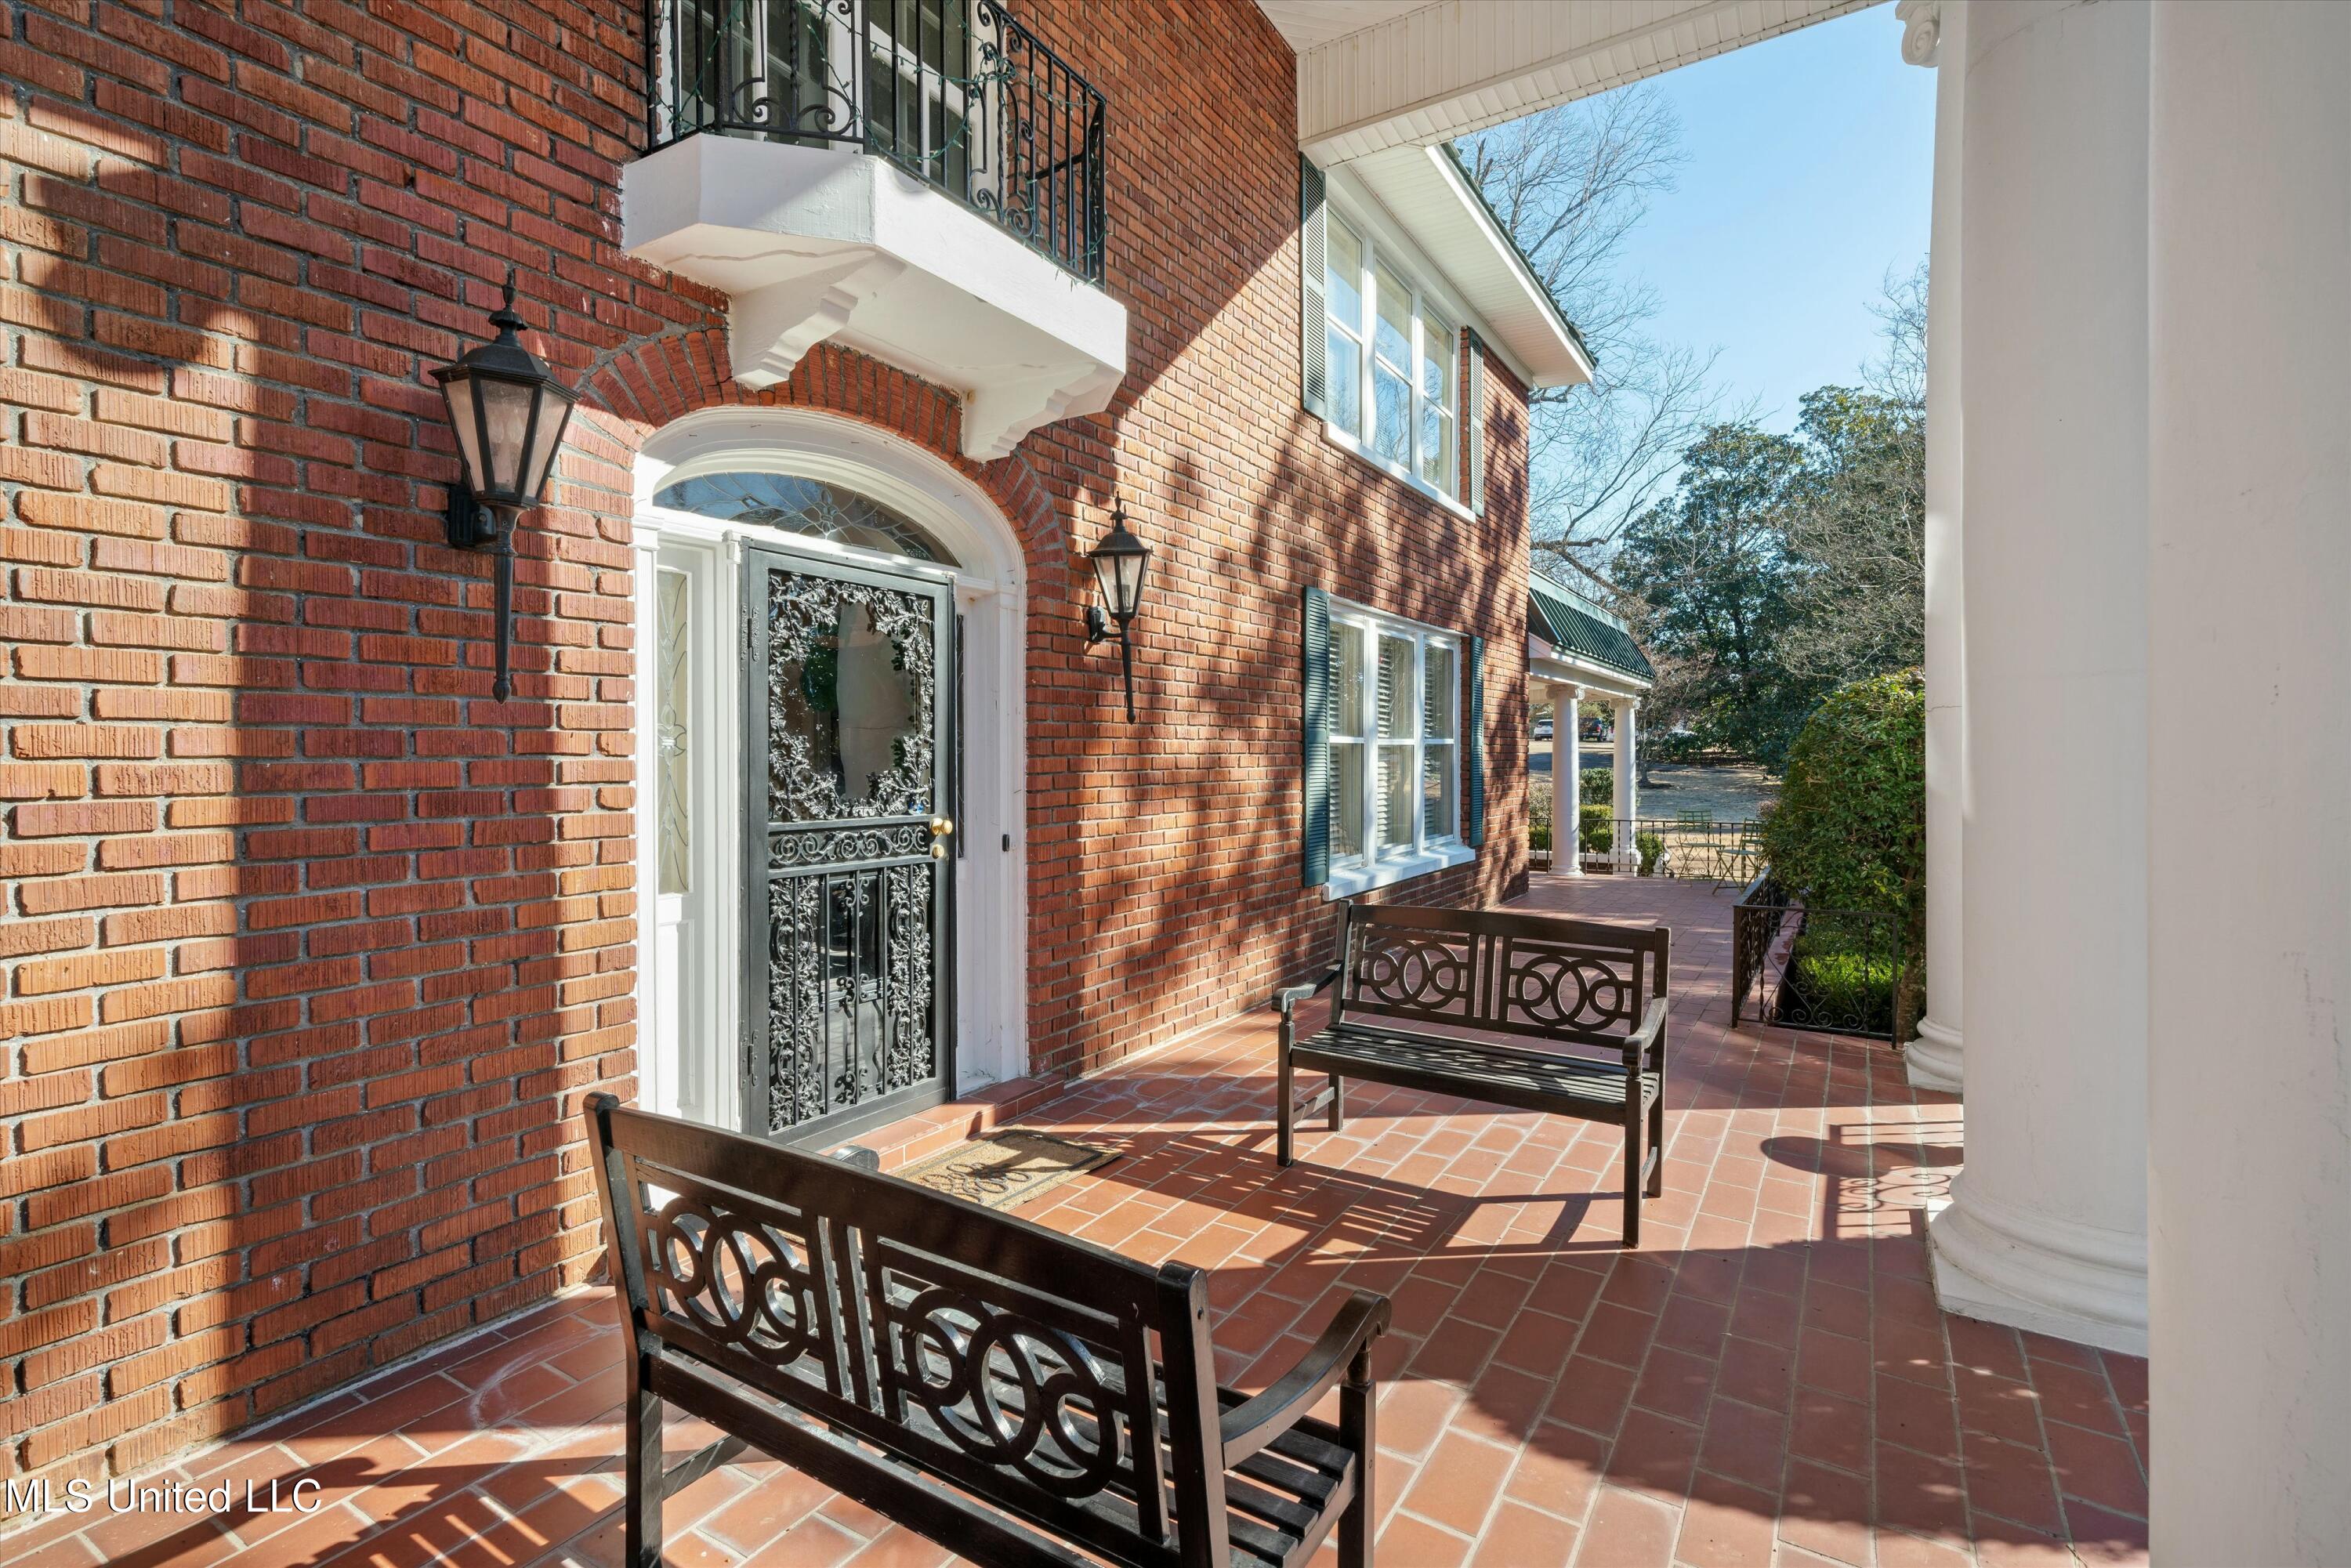
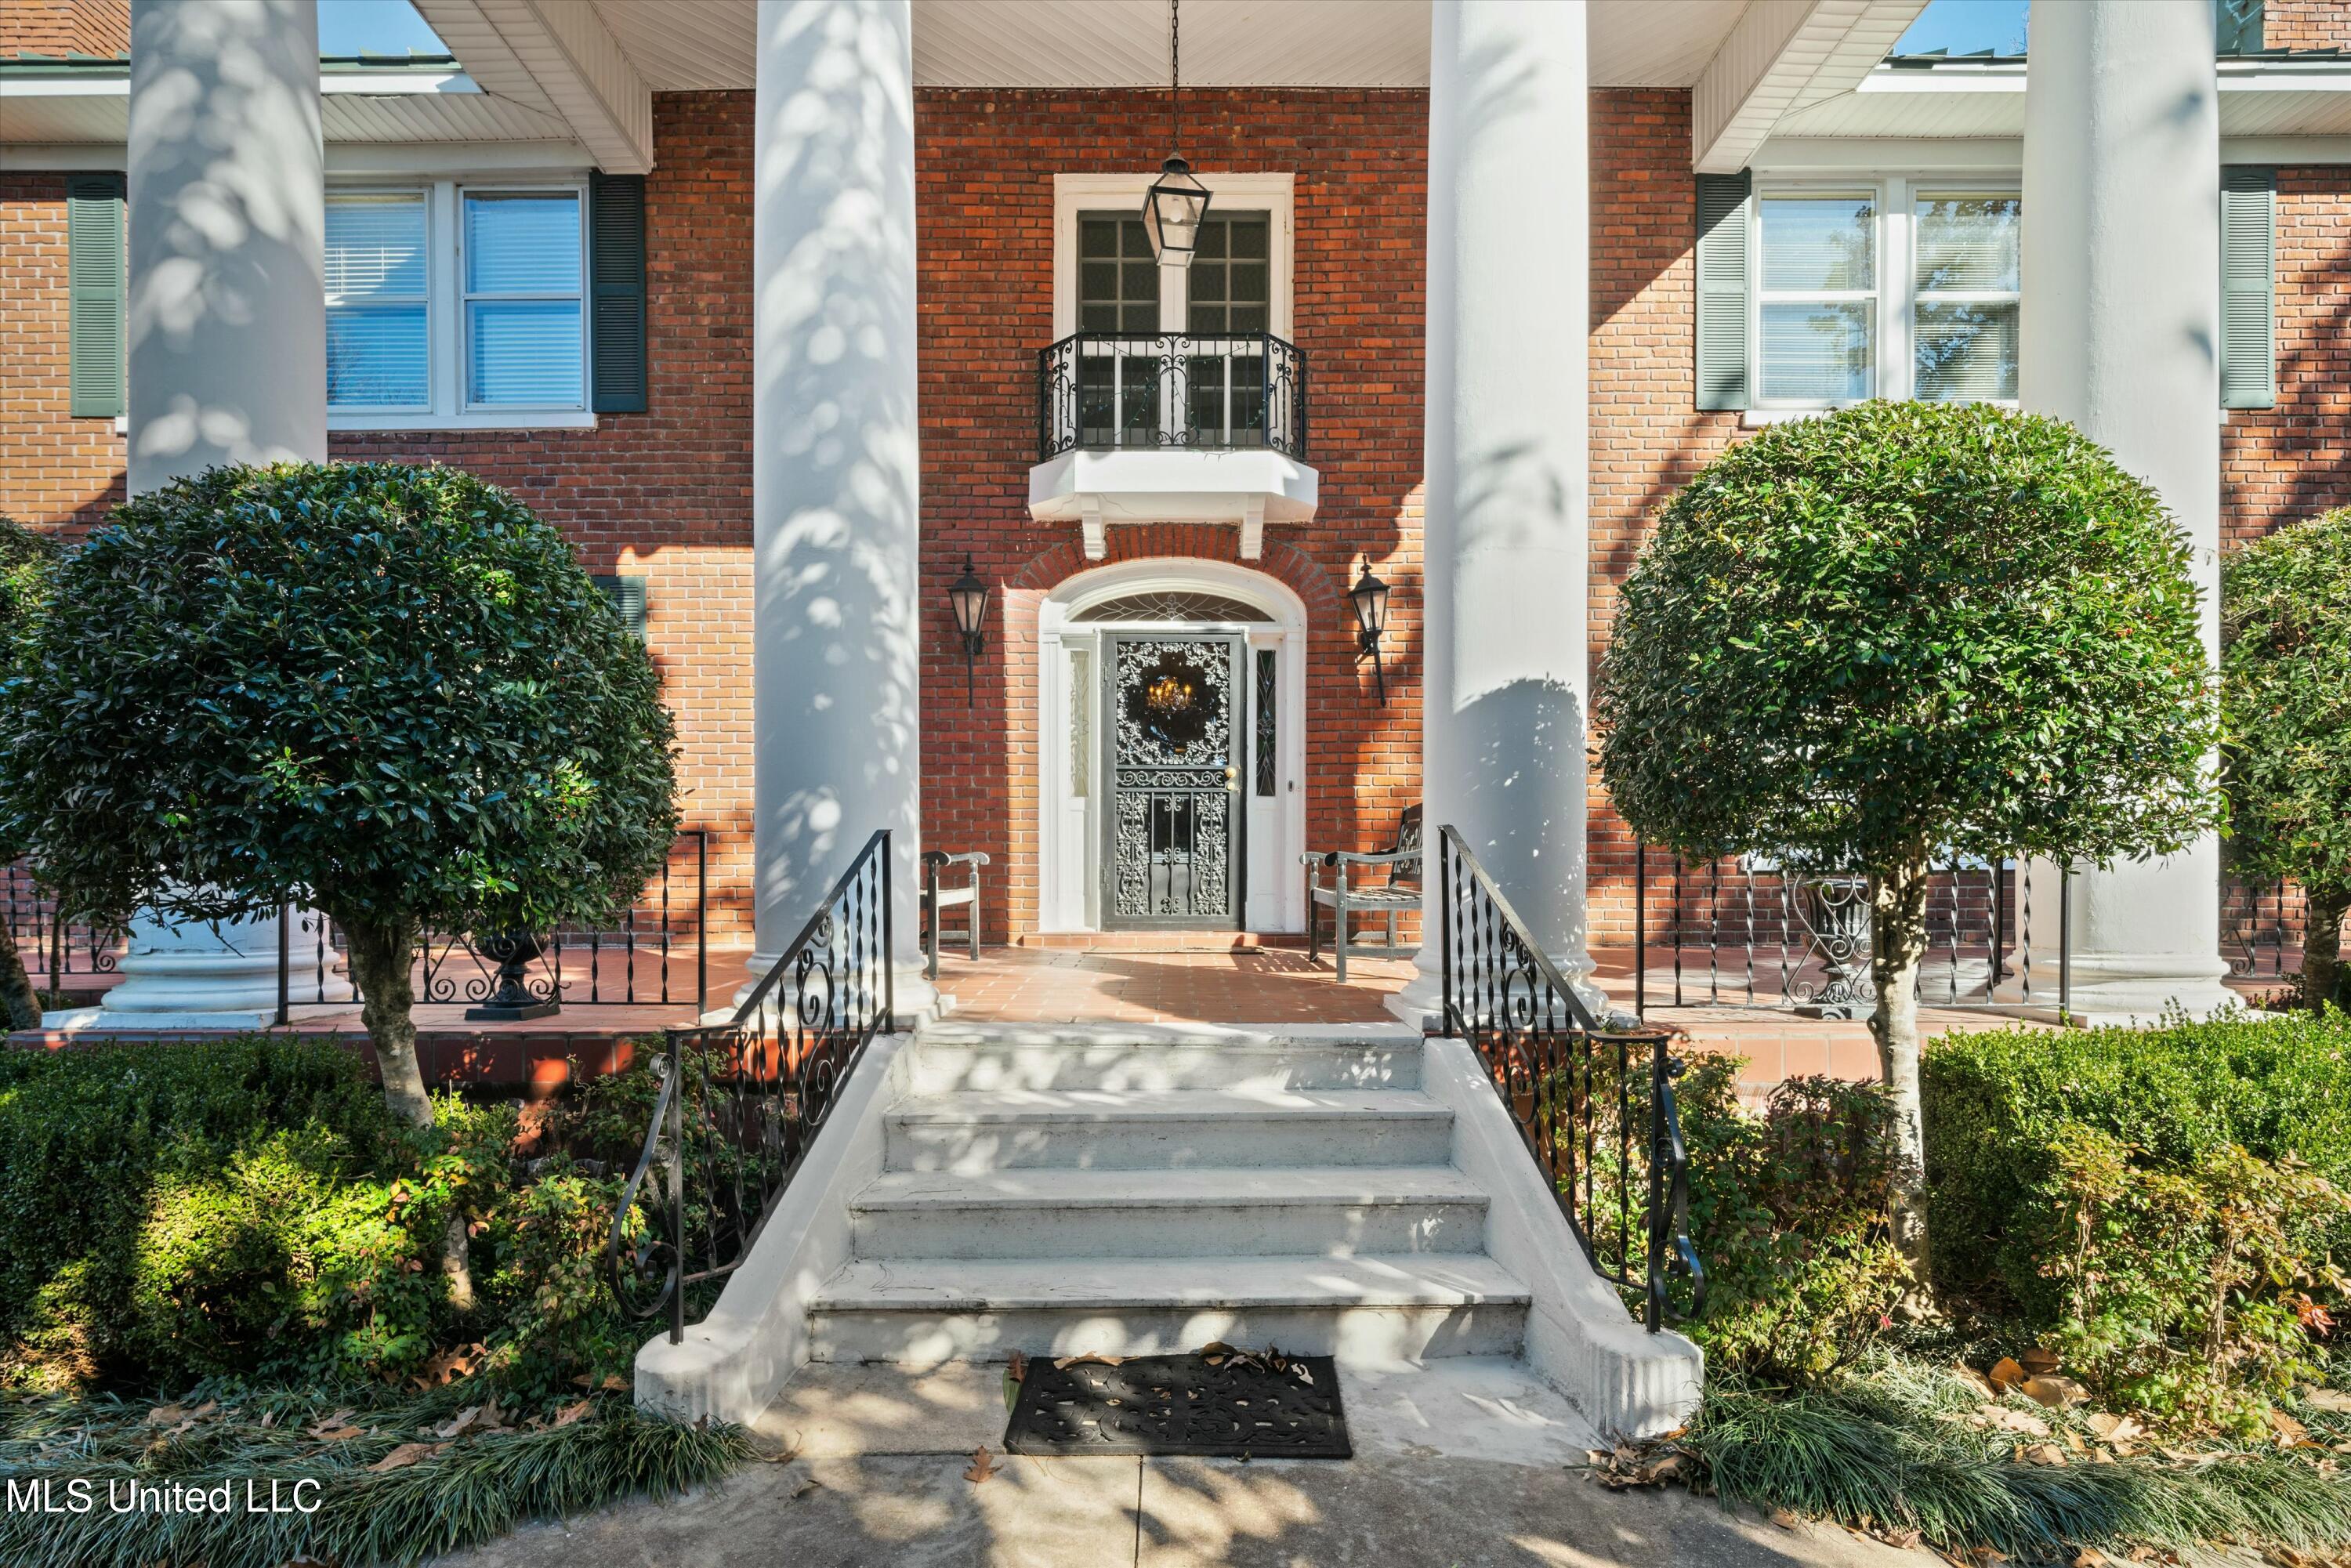
She is as strong as she is graceful. From the beautiful sunsets she captures on the Bluff to the high hill she sits on, she represents the strength and dignity of her generations of inhabitants. She is the most beautiful at the peak of every season from the white snow that seems to make her stand tall like a general in the field to the spring buttercups planted by many grandmothers to the juicy pecans from her numerous giving trees that children love to gather in the fall amongst the fall foliage This is the ''Big House.'' Set back on a gentle hill in the heart of Lake Cormorant, Mississippi, this gated Georgian-style estate is a striking blend of Southern charm, timeless architecture, and countryside tranquility. Built in 1947 and set across six stately acres, the property is enveloped by a sweeping lawn shaded by towering magnolia and pecan trees, their presence a graceful testament to the land's history and beauty. As you pass through the gated entrance and wind up the private drive, the classic red brick facade of the main residence comes into view, balanced, symmetrical, and rich with character. Inside, the home boasts six spacious bedrooms and three and a half bathrooms, thoughtfully laid out for comfort and privacy. Two large wooden staircases rise on either side of the home, leading to three upstairs bedrooms, including two grand primary suites, each with its own living room and gas fireplace, creating warm, inviting spaces to retreat and relax. Downstairs, two additional bedrooms and one and a half baths provide flexibility for guests or multigenerational living. The living spaces are a perfect harmony of formal and cozy. A formal living room opens to the dining room, where natural light spills across the hardwood floors. The den, featuring a gas fireplace, offers a relaxed space to unwind, while a bright, joyful sunroom invites you to sit and enjoy views of the rolling grounds in every season. The kitchen, filled with charm and functionality, is just steps from a practical mudroom, ideal for transitioning from outdoor chores to indoor comforts. A full attic provides ample storage or potential for expansion, and a full basement offers additional space for hobbies, recreation, or wine storage. Beyond the main residence, the estate continues to impress. A large three-car garage ( deep enough to accommodate 6 cars from tandem parking) sits near a charming one-bedroom, one-bath guest cottage with a screened-in porch, a peaceful place for visitors or an ideal artist's retreat. A nearby structure houses all the equipment needed to maintain the immaculate property, with its wide green lawns and storied trees. A small barn adds rustic charm and functionality, while a converted commissary serves as yet another of the estate's amenities. This impressive 2,000-square-foot structure now contains a fully equipped gym, an office and a restful den, a full kitchen, and two full bathrooms, making it the perfect space for wellness, remote work, or entertaining on a grand scale. This Lake Cormorant estate is more than a home; it's a legacy, a sanctuary in the countryside, where history and modern living meet under the shade of magnolias, and every sunrise over the hilltop feels like a new beginning.
Build Your Team
Quickly find investor-friendly professionals who can help you succeed in real estate investing at any stage of the investing journey.


Agents
Match with investor-friendly agents who can help you find, analyze, and close your next deal


Lenders
Get the best funding…find investor-friendly lenders who specialize in your deal strategy


Property Managers
Transition to passive investing. Find a trusted property management partnership that lasts.


Tax Pros & Accountants
Taxes and financial reporting made easy—find experts to create tax savings strategies, file taxes, and more
Location
Property Details
Parking
- Garage Spaces: 3
- Spaces Total: 0
Bedroom Information
- # of Bedrooms: 5
Bathroom Information
- # of Baths (Full): 3
- # of Baths (Total): 4.0
Interior Features
- # of Rooms: 15
Exterior Features
- Exterior Walls Materials: Brick Veneer
- Roof Type: Gable
- Roof Material: Metal
Land Information
- Land Use: Residential
- Land Use Subtype: Single Family Residential (Assumed)
Lot Information
- Parcel ID: 2091110000000201
- Lot Size: 265716 sqft
Property Information
- Property Type: Single Family Residence
- Style: Georgian
- Year Built: 1947
Tax Information
- Annual Tax: $4,766
Utilities
- Water & Sewer: Public
- Heating: Radiant Floor, Natural Gas
- Cooling: Central Air, Gas, Window Unit(s)
Location
- County: De Soto
Listing Details
Investment Summary
- Monthly Cash Flow
- -$4,607
- Cap Rate
- 1.7%
- Cash-on-Cash Return
- -17.2%
- Debt Coverage Ratio
- 0.30
- Internal Rate of Return (5 years)
- -12.6%
Cash Flow
Net Operating Income (NOI) minus mortgage payments.
Calculation:
NOI - Mortgage Payments
Cap Rate (Market Value)
Capitalization Rate is a rate of return that compares the yearly Net Operating Income (NOI) to the market value.
Calculation:
NOI / Market Value
Cash-on-Cash Return (CoC)
Annual Cash Flow / Cash Invested
Calculation:
Annual cash flow divided by initial cash invested.
Debt Coverage Ratio (DCR)
Net Operating Income (NOI) divided by total debt payments.
Calculation:
NOI / Total Debt Payments
Internal Rate of Return (IRR)
A metric for assessing profitability over time. IRR is the discount rate at which the net present value (NPV) of all future cash flows (positive and negative) from an investment equals zero — including both periodic cash flow (such as rent) and a projected sale at the end of the holding period. It represents the expected annualized return, accounting for income, expenses, and the recovery of capital through a future sale.
Purchase Details
Purchase PriceThe price paid for the property. Purchase price:
| $1,400,000 |
|---|---|
Amount FinancedThe amount of the purchase financed through a loan. Amount financed:
| -$1,120,000 |
Down paymentThe initial payment made towards the purchase. Down payment:
| $280,000 |
Closing CostsFees and expenses associated with purchasing a property, typically ranging from 2% to 5% of the home’s purchase price, paid at the end of a home purchase to cover services like lending, title transfer, and taxes. Closing costs:
| $42,000 |
Rehab CostsCosts incurred to repair or improve the property, including: roof, flooring, exterior siding, kitchen, exterior paint, bathrooms, etc. Rehab costs:
| $0 |
Initial Cash InvestedThe total initial cash invested in the property. Calculation:Down payment + Buying costs + Rehab costs Initial cash invested:
| $322,000 |
Square Feet (SQFT)The total square footage of the property. Square feet:
| 0 |
Cost Per Square FootCost per square foot of the property. Calculation:Purchase Price / Square Feet Cost per square foot:
| n/a |
Monthly Rent Per Square FootMonthly rent divided by the number of square feet. This ratio helps investors compare rental income efficiency across properties, markets, and unit sizes Calculation:Monthly Rent / Square Feet Monthly rent per square foot:
| n/a |
Financing Details
Loan AmountThe total sum of money borrowed from a lender to finance a property purchase. Calculation:Purchase Price - Down Payment
Loan amount:
| $1,120,000 |
|---|---|
Loan to Value Ratio (LTV)Loan amount divided by the market value of the property. Calculation:Loan Amount / Market Value
Loan to value ratio:
| 80.0% |
Loan TypeThe type of loan (e.g., fixed, adjustable).
Loan type:
| Amortizing |
TermThe loan repayment period in years.
Term:
| 30 years |
Interest RateThe percentage a lender charges on the borrowed amount of a loan, determining the cost of borrowing money.
Interest rate:
| 5.875% |
Principal & Interest (PI)The principal is the portion of the loan payment that reduces the loan balance. The interest is the lender's charge for borrowing money. Calculation:(P * r * (1 + r) ** n) / ((1 + r) ** n - 1) Where:
P = Loan amount (principal)
Principal & interest:
| $6,625 |
Property TaxesAnnual taxes levied by local governments on real estate properties. These taxes fund public services like schools, roads, and emergency services.
Property tax:
| $397 |
InsuranceThe costs for insurance coverage to protect against financial losses due to risks like fire, natural disasters, theft, liability, or tenant-related damages. Calculation:Assumes 7% of gross rental income, unless insurance rates are specified.
Insurance:
| $245 |
Private Mortgage Insurance (PMI)A fee that borrowers pay when they take out a conventional loan with a loan-to-value (LTV) ratio above 80%.
Private mortgage insurance (PMI):
| $0 |
Monthly PaymentThe fixed amount a borrower pays each month to repay a loan. It typically includes principal and interest (P&I) and may also cover property taxes, insurance, HOA fees, and PMI if escrowed. Monthly payment:
| $7,267 |
Operating Income
| % Rent | Monthly | Yearly | |
|---|---|---|---|
Gross RentThe total rental income received from tenants before deducting any expenses. Includes base rent, late fees, pet fees, parking fees, and other recurring charges.
Gross rent:
| $3,500 | $42,000 | |
Vacancy LossExpected loss of rent due to vacancies.
Vacancy loss:
(6%)
| 6% | -$210 | -$2,520 |
Operating IncomeGross rental income minus vacancy loss. Calculation:Gross rent - Vacancy loss
Operating income:
| $3,290 | $39,480 |
Operating Expenses
| % Rent | Monthly | Yearly | |
|---|---|---|---|
Property TaxesAnnual taxes levied by local governments on real estate properties. These taxes fund public services like schools, roads, and emergency services. | 11% | -$397 | -$4,766 |
InsuranceThe costs for insurance coverage to protect against financial losses due to risks like fire, natural disasters, theft, liability, or tenant-related damages. Calculation:Assumes 7% of gross rental income, unless insurance rates are specified. | 7% | -$245 | -$2,940 |
Property ManagementThe costs associated with hiring a property manager to handle the day-to-day operations of a rental property. Includes management fees, leasing fes, eviction fees, etc. Calculation:Assumes 8% of gross rental income. | 8% | -$280 | -$3,360 |
Repairs & MaintenanceOngoing costs for routine upkeep and minor fixes needed to keep a property in good working condition. Calculation:Assumes 5% of gross rental income. Varies by property age and condition. | 5% | -$175 | -$2,100 |
Capital ExpensesLarge, infrequent costs for major improvements or replacements, like a new roof, HVAC system, or appliances. Calculation:Assumes 5% of gross rental income. Varies by property age. | 5% | -$175 | -$2,100 |
HOA FeesRegular dues paid to a Homeowners Association for community maintenance, amenities, and management. Similar fees include: Condo Association Fees, Co-op Maintenance Fees, etc. | n/a | n/a | n/a |
Operating ExpensesRecurring costs required to maintain and manage a rental property, including property taxes, insurance, maintenance, repairs, utilities (if paid by the owner), property management fees, and other day-to-day expenses. Calculation:Insurance + Property Taxes + Property Management + Repairs & Maintenance + Capital Expenditures + HOA Fees | 36% | -$1,272 | -$15,266 |
Cash Flow
| Monthly | Yearly | |
|---|---|---|
Net Operating Income (NOI)The income generated from a property after deducting all operating expenses but before deducting mortgage payments, taxes, and capital expenditures. Calculation:Gross Operating Income - Operating Expenses
Net operating income:
| $2,018 | $24,216 |
Mortgage PaymentThe fixed amount a borrower pays each month to repay a loan. It typically includes principal and interest (P&I) and may also cover property taxes, insurance, HOA fees, and PMI if escrowed. | -$6,625 | -$79,500 |
Cash FlowNet Operating Income (NOI) minus mortgage payments. Calculation:NOI - Mortgage Payments | -$4,607 | -$55,284 |