
$565,000
Investment Summary
- Monthly Cash Flow
- -$1,097
- Cap Rate
- 3.8%
- Cash-on-Cash Return
- -10.1%
- Debt Coverage Ratio
- 0.62
- Internal Rate of Return (5 years)
- -5.8%
Cash Flow
Net Operating Income (NOI) minus mortgage payments.
Calculation:
NOI - Mortgage Payments
Cap Rate (Market Value)
Capitalization Rate is a rate of return that compares the yearly Net Operating Income (NOI) to the market value.
Calculation:
NOI / Market Value
Cash-on-Cash Return (CoC)
Annual Cash Flow / Cash Invested
Calculation:
Annual cash flow divided by initial cash invested.
Debt Coverage Ratio (DCR)
Net Operating Income (NOI) divided by total debt payments.
Calculation:
NOI / Total Debt Payments
Internal Rate of Return (IRR)
A metric for assessing profitability over time. IRR is the discount rate at which the net present value (NPV) of all future cash flows (positive and negative) from an investment equals zero — including both periodic cash flow (such as rent) and a projected sale at the end of the holding period. It represents the expected annualized return, accounting for income, expenses, and the recovery of capital through a future sale.
Property Description
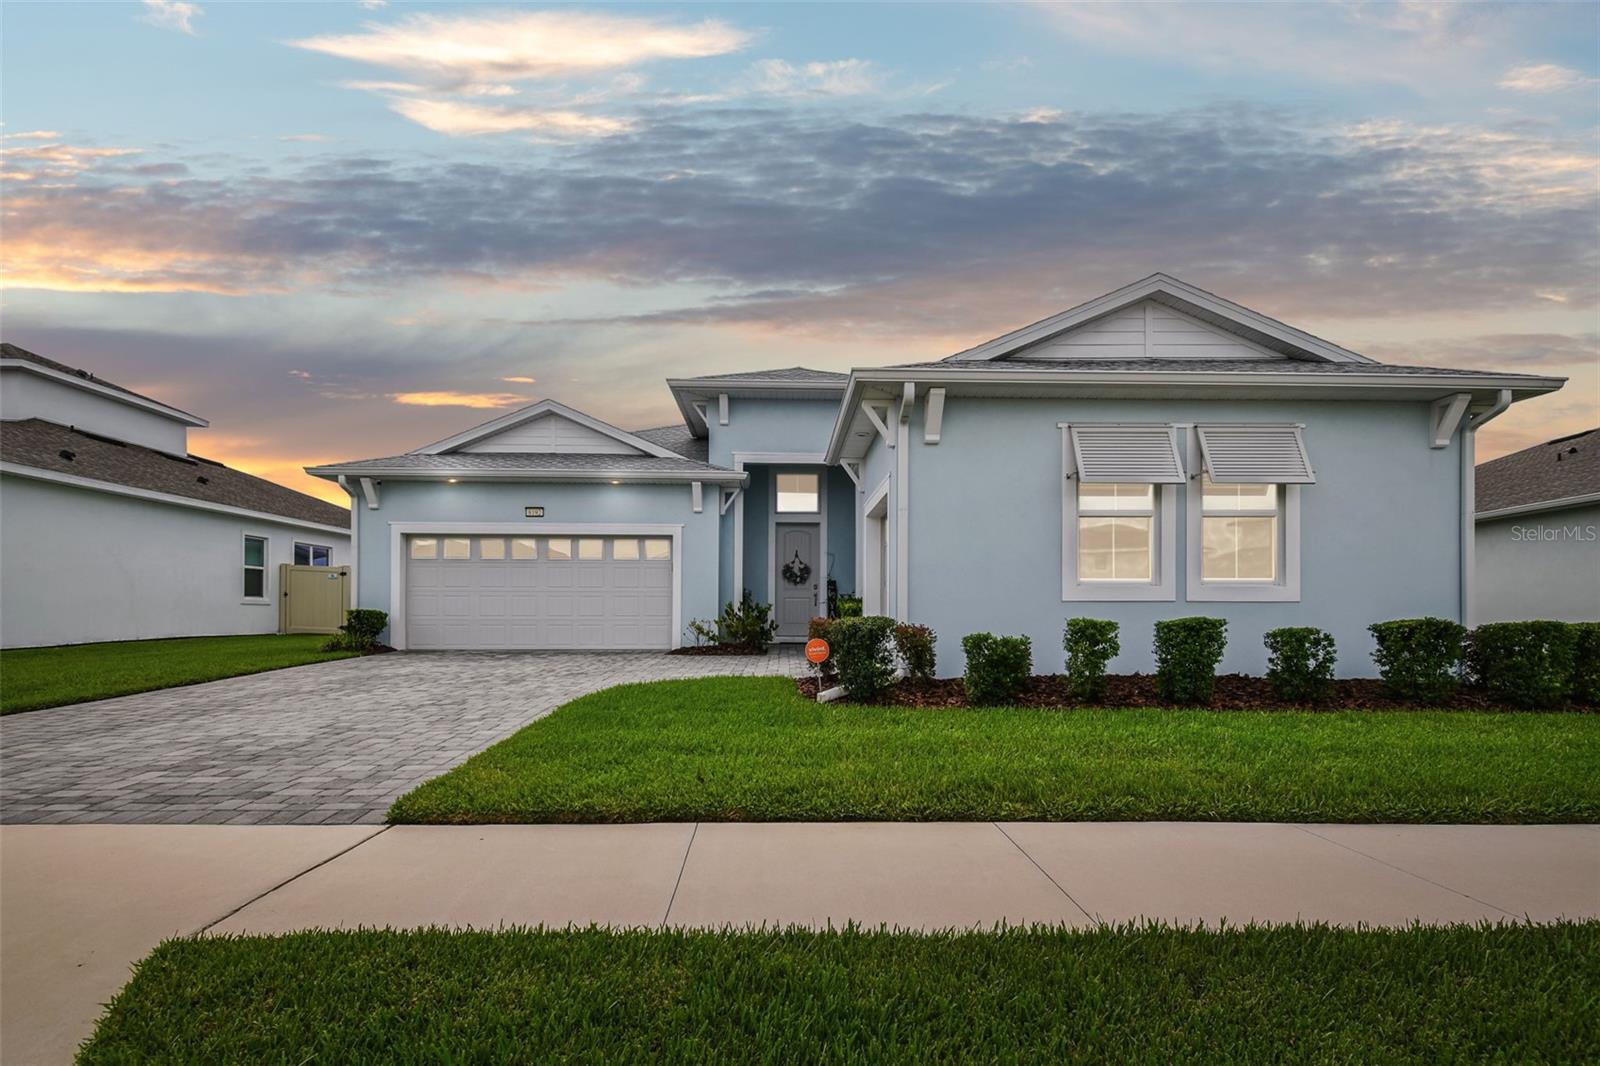
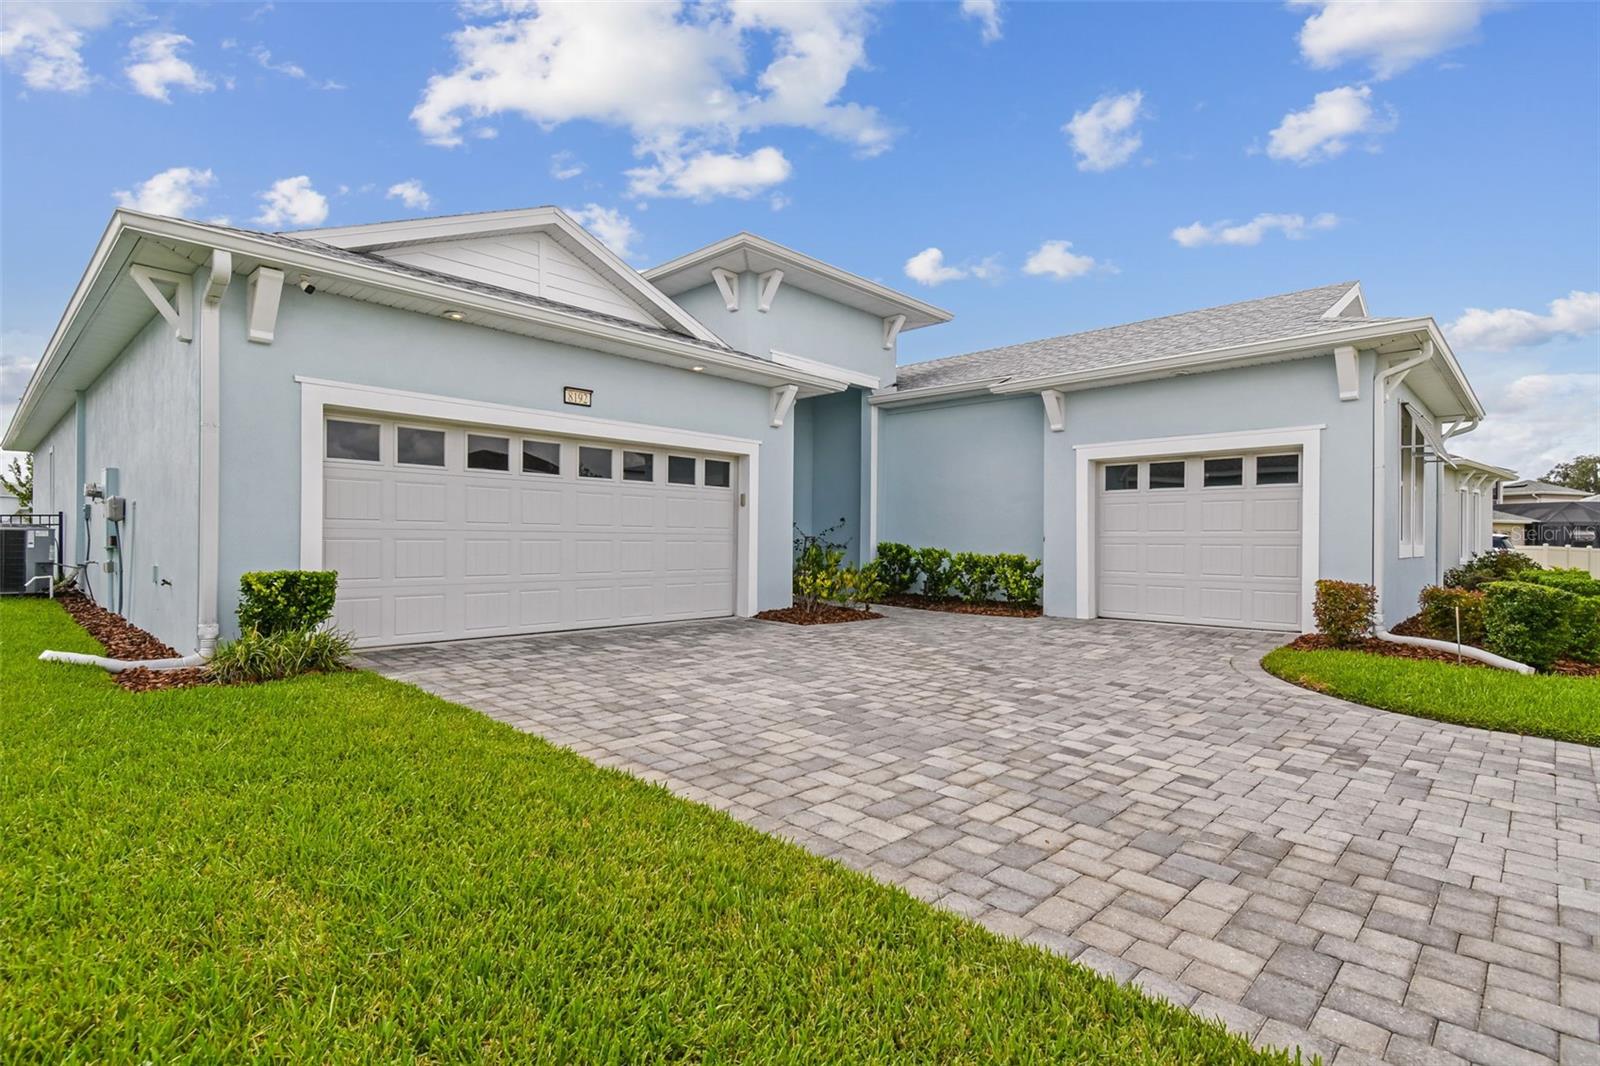
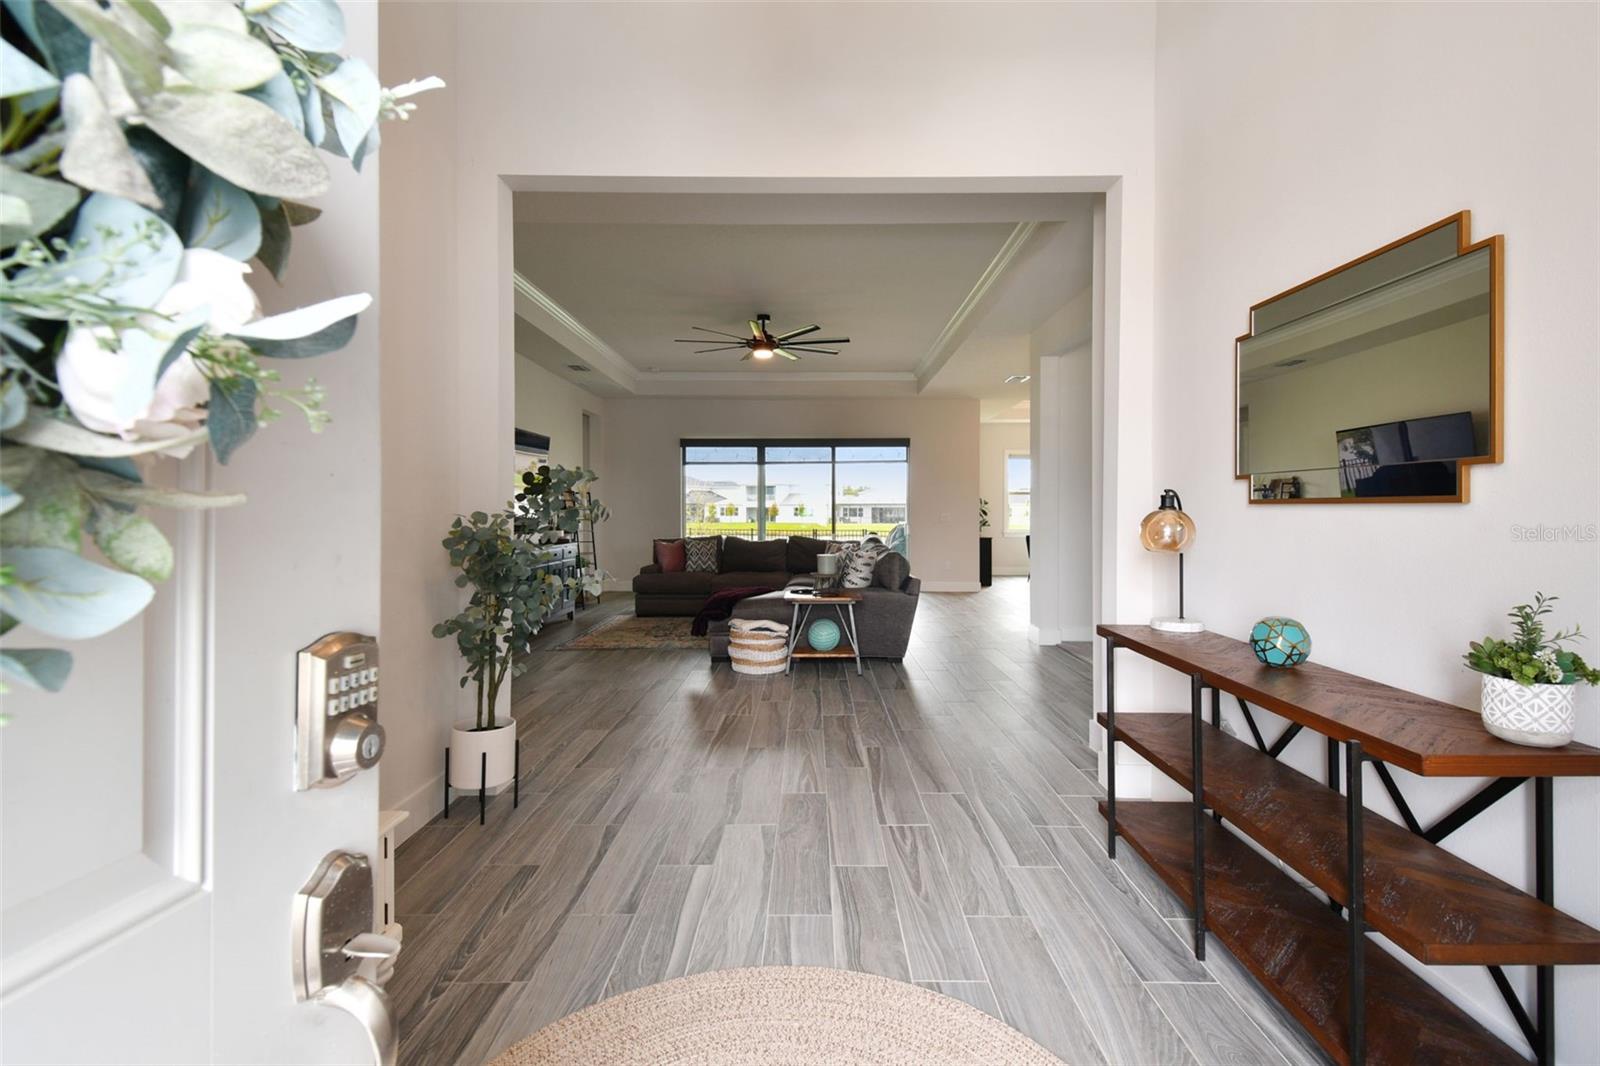
Under contract-accepting backup offers. ASSUMABLE MORTGAGE OF 2.750% IF YOU QUALIFY! PRICED BELOW MARKET VALUE: SELLER WILL ASSIST BUYER IN CLOSING!! Welcome to 8192 Ivy Stark Blvd, a beautifully upgraded Egret 1 model by Biscayne Homes, located in the sought-after Robin’s Cove subdivision within the iconic Epperson Lagoon community of Wesley Chapel, FL. Built in 2021 and offering 2,497 square feet of luxurious living space, this stunning home features 3 spacious bedrooms, 2.5 bathrooms, and a 3-car garage to safely house your vehicles from Florida’s elements. Inside, you’ll find elegant tile floors, shaker-style cabinetry, tray ceilings, a gourmet kitchen with a propane stove, and propane access on the patio for a future outdoor grill. Additional upgrades include a whole-house water filtration system and a serene rain shower in the primary suite. This home has never flooded or lost power during recent hurricanes, offering peace of mind and comfort year-round. As a resident, you’ll enjoy exclusive access to Epperson’s 7.5-acre Crystal Lagoon—a one-of-a-kind aquatic paradise with crystal-clear waters, sandy beaches, a swim-up bar, water slides, paddleboarding, kayaking, and a floating obstacle course. The Hub brings the community together with events like yoga classes, outdoor movies, concerts, and seasonal celebrations, while Eagle Park at King Lake offers trails, a kayak launch, dog park, playground, fitness stations, and a clubhouse. You’ll also have access to the nearby Mirada Lagoon for even more water fun. The entire community is connected via golf cart-friendly paths, solar-powered streetlights, and miles of walking trails. Included in the HOA is ULTRAFi—lightning-fast 500/500 Mbps internet (upgradable to 1 Gig) and over 175 cable channels, making working from home or streaming seamless. Families benefit from top-rated schools, including the Kirkland Ranch Academy of Innovation across the street, specializing in STEM education. Everyday conveniences are within easy reach—Publix, Starbucks, and top shopping destinations like Tampa Premium Outlets and Shops at Wiregrass are minutes away. Located just 8 minutes from I-75, 18 minutes from BayCare Hospital, 45 minutes from downtown Tampa, MacDill AFB, and Tampa International Airport, and only an hour from award-winning Gulf beaches and 90 minutes from Orlando’s theme parks—this is truly Florida living at its finest. Don’t miss your opportunity to own a piece of paradise in Wesley Chapel’s premier lagoon community. Schedule your private tour today and discover life at Epperson. (CDD FEES ARE INCLUDED IN PROPERTY TAXES) Be sure to watch the walk through video, click on "Virtual Tour" to see the layout of the home.
Build Your Team
Quickly find investor-friendly professionals who can help you succeed in real estate investing at any stage of the investing journey.


Agents
Match with investor-friendly agents who can help you find, analyze, and close your next deal


Lenders
Get the best funding…find investor-friendly lenders who specialize in your deal strategy


Property Managers
Transition to passive investing. Find a trusted property management partnership that lasts.


Tax Pros & Accountants
Taxes and financial reporting made easy—find experts to create tax savings strategies, file taxes, and more
Location
Property Details
Parking
- Description: Golf Cart Garage
- Details: Golf Cart Garage, Attached
- Garage Spaces: 3
- Spaces Total: 0
Bedroom Information
- # of Bedrooms: 3
Bathroom Information
- # of Baths (Full): 2
- # of Baths (Partial): 1
- # of Baths (Total): 3.0
Interior Features
- # of Rooms: 7
- # of Stories: 1
Exterior Features
- Exterior Walls Materials: Concrete Block
- Foundation: Slab
- Roof Type: Gable
- Roof Material: Shingle
HOA
- Has HOA: Yes
- Association: Breeze Home/ Manager - Colette
- HOA Fee: $245/quarterly
- Additional Association: n/a
Land Information
- Land Use: Residential
- Land Use Subtype: Single Family Residential
Lot Information
- Parcel ID: 2625200010016000140
- Lot Size: 8723 sqft
Property Information
- Property Type: Single Family Residence
- Style: Contemporary
- Year Built: 2021
Tax Information
- Annual Tax: $9,747
Utilities
- Water & Sewer: Public
- Heating: Central
- Cooling: Central Air
Location
- County: Pasco
Listing Details
Investment Summary
- Monthly Cash Flow
- -$1,097
- Cap Rate
- 3.8%
- Cash-on-Cash Return
- -10.1%
- Debt Coverage Ratio
- 0.62
- Internal Rate of Return (5 years)
- -5.8%
Cash Flow
Net Operating Income (NOI) minus mortgage payments.
Calculation:
NOI - Mortgage Payments
Cap Rate (Market Value)
Capitalization Rate is a rate of return that compares the yearly Net Operating Income (NOI) to the market value.
Calculation:
NOI / Market Value
Cash-on-Cash Return (CoC)
Annual Cash Flow / Cash Invested
Calculation:
Annual cash flow divided by initial cash invested.
Debt Coverage Ratio (DCR)
Net Operating Income (NOI) divided by total debt payments.
Calculation:
NOI / Total Debt Payments
Internal Rate of Return (IRR)
A metric for assessing profitability over time. IRR is the discount rate at which the net present value (NPV) of all future cash flows (positive and negative) from an investment equals zero — including both periodic cash flow (such as rent) and a projected sale at the end of the holding period. It represents the expected annualized return, accounting for income, expenses, and the recovery of capital through a future sale.
Purchase Details
Purchase PriceThe price paid for the property. Purchase price:
| $565,000 |
|---|---|
Amount FinancedThe amount of the purchase financed through a loan. Amount financed:
| -$452,000 |
Down paymentThe initial payment made towards the purchase. Down payment:
| $113,000 |
Closing CostsFees and expenses associated with purchasing a property, typically ranging from 2% to 5% of the home’s purchase price, paid at the end of a home purchase to cover services like lending, title transfer, and taxes. Closing costs:
| $16,950 |
Rehab CostsCosts incurred to repair or improve the property, including: roof, flooring, exterior siding, kitchen, exterior paint, bathrooms, etc. Rehab costs:
| $0 |
Initial Cash InvestedThe total initial cash invested in the property. Calculation:Down payment + Buying costs + Rehab costs Initial cash invested:
| $129,950 |
Square Feet (SQFT)The total square footage of the property. Square feet:
| 2,497 |
Cost Per Square FootCost per square foot of the property. Calculation:Purchase Price / Square Feet Cost per square foot:
| $226 |
Monthly Rent Per Square FootMonthly rent divided by the number of square feet. This ratio helps investors compare rental income efficiency across properties, markets, and unit sizes Calculation:Monthly Rent / Square Feet Monthly rent per square foot:
| $1.56 |
Financing Details
Loan AmountThe total sum of money borrowed from a lender to finance a property purchase. Calculation:Purchase Price - Down Payment
Loan amount:
| $452,000 |
|---|---|
Loan to Value Ratio (LTV)Loan amount divided by the market value of the property. Calculation:Loan Amount / Market Value
Loan to value ratio:
| 80.0% |
Loan TypeThe type of loan (e.g., fixed, adjustable).
Loan type:
| Amortizing |
TermThe loan repayment period in years.
Term:
| 30 years |
Interest RateThe percentage a lender charges on the borrowed amount of a loan, determining the cost of borrowing money.
Interest rate:
| 6.625% |
Principal & Interest (PI)The principal is the portion of the loan payment that reduces the loan balance. The interest is the lender's charge for borrowing money. Calculation:(P * r * (1 + r) ** n) / ((1 + r) ** n - 1) Where:
P = Loan amount (principal)
Principal & interest:
| $2,894 |
Property TaxesAnnual taxes levied by local governments on real estate properties. These taxes fund public services like schools, roads, and emergency services.
Property tax:
| $812 |
InsuranceThe costs for insurance coverage to protect against financial losses due to risks like fire, natural disasters, theft, liability, or tenant-related damages. Calculation:Assumes 7% of gross rental income, unless insurance rates are specified.
Insurance:
| $273 |
Private Mortgage Insurance (PMI)A fee that borrowers pay when they take out a conventional loan with a loan-to-value (LTV) ratio above 80%.
Private mortgage insurance (PMI):
| $0 |
Monthly PaymentThe fixed amount a borrower pays each month to repay a loan. It typically includes principal and interest (P&I) and may also cover property taxes, insurance, HOA fees, and PMI if escrowed. Monthly payment:
| $3,979 |
Operating Income
| % Rent | Monthly | Yearly | |
|---|---|---|---|
Gross RentThe total rental income received from tenants before deducting any expenses. Includes base rent, late fees, pet fees, parking fees, and other recurring charges.
Gross rent:
| $3,900 | $46,800 | |
Vacancy LossExpected loss of rent due to vacancies.
Vacancy loss:
(6%)
| 6% | -$234 | -$2,808 |
Operating IncomeGross rental income minus vacancy loss. Calculation:Gross rent - Vacancy loss
Operating income:
| $3,666 | $43,992 |
Operating Expenses
| % Rent | Monthly | Yearly | |
|---|---|---|---|
Property TaxesAnnual taxes levied by local governments on real estate properties. These taxes fund public services like schools, roads, and emergency services. | 21% | -$812 | -$9,748 |
InsuranceThe costs for insurance coverage to protect against financial losses due to risks like fire, natural disasters, theft, liability, or tenant-related damages. Calculation:Assumes 7% of gross rental income, unless insurance rates are specified. | 7% | -$273 | -$3,276 |
Property ManagementThe costs associated with hiring a property manager to handle the day-to-day operations of a rental property. Includes management fees, leasing fes, eviction fees, etc. Calculation:Assumes 8% of gross rental income. | 8% | -$312 | -$3,744 |
Repairs & MaintenanceOngoing costs for routine upkeep and minor fixes needed to keep a property in good working condition. Calculation:Assumes 5% of gross rental income. Varies by property age and condition. | 5% | -$195 | -$2,340 |
Capital ExpensesLarge, infrequent costs for major improvements or replacements, like a new roof, HVAC system, or appliances. Calculation:Assumes 5% of gross rental income. Varies by property age. | 5% | -$195 | -$2,340 |
HOA FeesRegular dues paid to a Homeowners Association for community maintenance, amenities, and management. Similar fees include: Condo Association Fees, Co-op Maintenance Fees, etc. | 2% | -$82 | -$984 |
Operating ExpensesRecurring costs required to maintain and manage a rental property, including property taxes, insurance, maintenance, repairs, utilities (if paid by the owner), property management fees, and other day-to-day expenses. Calculation:Insurance + Property Taxes + Property Management + Repairs & Maintenance + Capital Expenditures + HOA Fees | 48% | -$1,869 | -$22,432 |
Cash Flow
| Monthly | Yearly | |
|---|---|---|
Net Operating Income (NOI)The income generated from a property after deducting all operating expenses but before deducting mortgage payments, taxes, and capital expenditures. Calculation:Gross Operating Income - Operating Expenses
Net operating income:
| $1,797 | $21,564 |
Mortgage PaymentThe fixed amount a borrower pays each month to repay a loan. It typically includes principal and interest (P&I) and may also cover property taxes, insurance, HOA fees, and PMI if escrowed. | -$2,894 | -$34,728 |
Cash FlowNet Operating Income (NOI) minus mortgage payments. Calculation:NOI - Mortgage Payments | -$1,097 | -$13,164 |