
$1,750,000
Investment Summary
- Monthly Cash Flow
- -$5,478
- Cap Rate
- 2.4%
- Cash-on-Cash Return
- -16.3%
- Debt Coverage Ratio
- 0.39
- Internal Rate of Return (5 years)
- -11.8%
Cash Flow
Net Operating Income (NOI) minus mortgage payments.
Calculation:
NOI - Mortgage Payments
Cap Rate (Market Value)
Capitalization Rate is a rate of return that compares the yearly Net Operating Income (NOI) to the market value.
Calculation:
NOI / Market Value
Cash-on-Cash Return (CoC)
Annual Cash Flow / Cash Invested
Calculation:
Annual cash flow divided by initial cash invested.
Debt Coverage Ratio (DCR)
Net Operating Income (NOI) divided by total debt payments.
Calculation:
NOI / Total Debt Payments
Internal Rate of Return (IRR)
A metric for assessing profitability over time. IRR is the discount rate at which the net present value (NPV) of all future cash flows (positive and negative) from an investment equals zero — including both periodic cash flow (such as rent) and a projected sale at the end of the holding period. It represents the expected annualized return, accounting for income, expenses, and the recovery of capital through a future sale.
Property Description
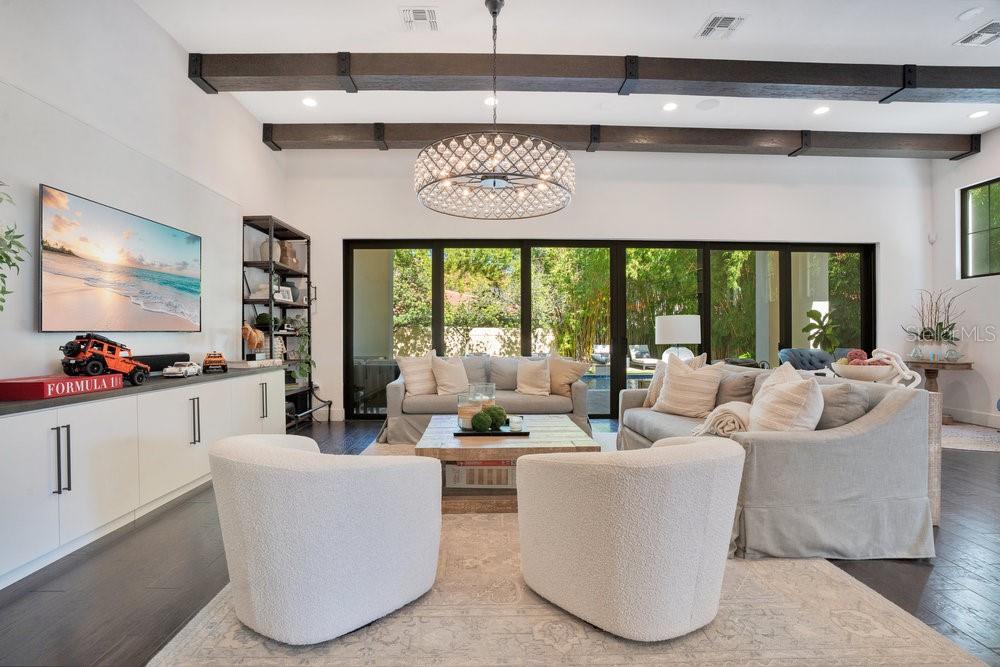
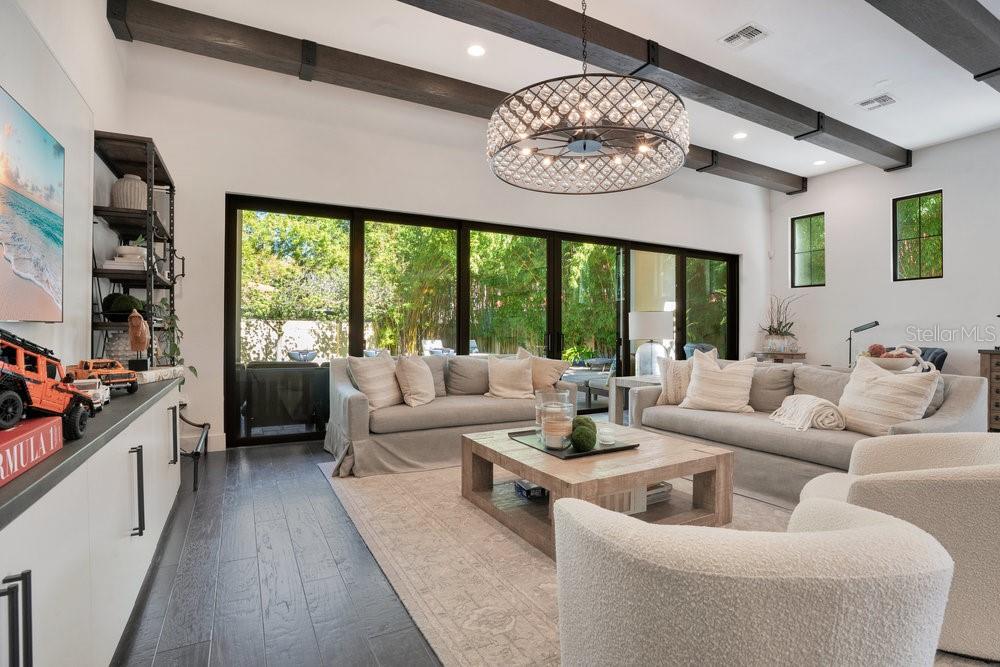
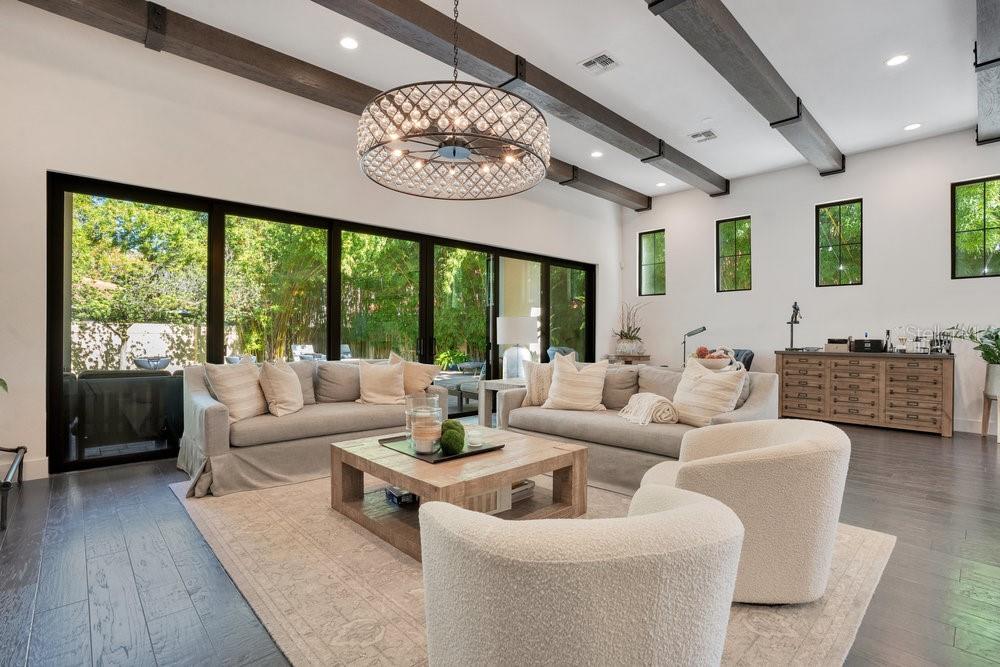
Don’t miss out on this rare opportunity to own a beautiful home situated on the largest lot in the gated community The Residences at Dellagio. This home is loaded with customized upgrades throughout. The entrance leads to the arched front door welcoming you to the foyer with marble basket weaved and wood pattern floors. The contemporary open floorplan with high ceilings throughout, faux wood beams, Restoration Hardware light fixtures, and walls of sliding glass doors flood the home with natural daylight. Your fully equipped kitchen is a chef’s delight with an extended island, pendant lighting, stainless steel apron sink, Jenn Air appliances that includes a custom fitted refrigerator, natural gas cooktop, vented hood, double ovens, dishwasher, and an adjacent wine cellar with glass entry. Walk-in butler pantry is perfect for your coffee station and smoothies featuring custom cabinetry with a full-size dishwasher, sink, and a reverse osmosis water filter. Dining room is elegant with doors opening up to an outdoor sitting area featuring a linear gas fireplace and privacy wall decorated with hand painted tiles. The living room has an unobstructed wall to wall sliding glass doors extending to the covered lanai that invites you to the heated pool featuring fire & waterfall bowls and a sundeck. Get ready to enjoy all those barbeques from the summer kitchen that includes granite counters, sink, commercial grade burner, a Green Egg, grill, and refrigerator. The upper level features a gorgeous master suite, huge walk-in closet, and a luxurious bathroom with dual vanities, a spa- like shower and free-standing bath tub. The large bonus room with built-in cabinets creates an additional casual & relaxing living space that can be used for a gym/office/media room. Additional two bedrooms are en-suites with their own bathrooms and walk-in closets. Laundry room is conveniently located on the same level of the bedrooms with built-in sink & cabinetry. One of the great benefits of owning this larger quarter acre lot is the extended paved driveway which can easily accommodate six cars. The entire backyard is fenced with two side gates offering the ultimate sanctuary to relax and enjoy Florida living at its finest. In addition you can use Dellagio resident only pool featuring a cabana and gathering area. The neighborhood is zoned for top rated schools, next door to the famous “Restaurant Row”, golf courses, close proximity to Universal Studios, Disney World, and the international airport. Best location in town. Don’t miss out on this remarkable property. Be sure to click on the virtual tour link
Build Your Team
Quickly find investor-friendly professionals who can help you succeed in real estate investing at any stage of the investing journey.


Agents
Match with investor-friendly agents who can help you find, analyze, and close your next deal


Lenders
Get the best funding…find investor-friendly lenders who specialize in your deal strategy


Property Managers
Transition to passive investing. Find a trusted property management partnership that lasts.


Tax Pros & Accountants
Taxes and financial reporting made easy—find experts to create tax savings strategies, file taxes, and more
Location
Property Details
Parking
- Description: Driveway, Garage Door Opener, Ground Level, Off Street
- Details: Driveway, Garage Door Opener, Off Street, Attached
- Garage Spaces: 2
- Spaces Total: 0
Bedroom Information
- # of Bedrooms: 3
Bathroom Information
- # of Baths (Full): 3
- # of Baths (Partial): 1
- # of Baths (Total): 4.0
Interior Features
- # of Rooms: 7
- # of Stories: 2
Exterior Features
- Exterior Walls Materials: Stucco
- Foundation: Slab
- Roof Type: Gable or Hip
- Roof Material: Tile
- Pool: Yes
HOA
- Has HOA: Yes
- Association: Carlos Echevarria, Manager
- HOA Fee: $385/monthly
Land Information
- Land Use: Residential
- Land Use Subtype: Single Family Residential
Lot Information
- Parcel ID: 272328202000340
- Lot Size: 10239 sqft
Property Information
- Property Type: Single Family Residence
- Style: Contemporary, Mediterranean
- Year Built: 2016
Tax Information
- Annual Tax: $21,447
Utilities
- Water & Sewer: Public
- Heating: Central, Electric, Zoned
- Cooling: Central Air, Zoned
Location
- County: Orange
Listing Details
Investment Summary
- Monthly Cash Flow
- -$5,478
- Cap Rate
- 2.4%
- Cash-on-Cash Return
- -16.3%
- Debt Coverage Ratio
- 0.39
- Internal Rate of Return (5 years)
- -11.8%
Cash Flow
Net Operating Income (NOI) minus mortgage payments.
Calculation:
NOI - Mortgage Payments
Cap Rate (Market Value)
Capitalization Rate is a rate of return that compares the yearly Net Operating Income (NOI) to the market value.
Calculation:
NOI / Market Value
Cash-on-Cash Return (CoC)
Annual Cash Flow / Cash Invested
Calculation:
Annual cash flow divided by initial cash invested.
Debt Coverage Ratio (DCR)
Net Operating Income (NOI) divided by total debt payments.
Calculation:
NOI / Total Debt Payments
Internal Rate of Return (IRR)
A metric for assessing profitability over time. IRR is the discount rate at which the net present value (NPV) of all future cash flows (positive and negative) from an investment equals zero — including both periodic cash flow (such as rent) and a projected sale at the end of the holding period. It represents the expected annualized return, accounting for income, expenses, and the recovery of capital through a future sale.
Purchase Details
Purchase PriceThe price paid for the property. Purchase price:
| $1,750,000 |
|---|---|
Amount FinancedThe amount of the purchase financed through a loan. Amount financed:
| -$1,400,000 |
Down paymentThe initial payment made towards the purchase. Down payment:
| $350,000 |
Closing CostsFees and expenses associated with purchasing a property, typically ranging from 2% to 5% of the home’s purchase price, paid at the end of a home purchase to cover services like lending, title transfer, and taxes. Closing costs:
| $52,500 |
Rehab CostsCosts incurred to repair or improve the property, including: roof, flooring, exterior siding, kitchen, exterior paint, bathrooms, etc. Rehab costs:
| $0 |
Initial Cash InvestedThe total initial cash invested in the property. Calculation:Down payment + Buying costs + Rehab costs Initial cash invested:
| $402,500 |
Square Feet (SQFT)The total square footage of the property. Square feet:
| 3,519 |
Cost Per Square FootCost per square foot of the property. Calculation:Purchase Price / Square Feet Cost per square foot:
| $497 |
Monthly Rent Per Square FootMonthly rent divided by the number of square feet. This ratio helps investors compare rental income efficiency across properties, markets, and unit sizes Calculation:Monthly Rent / Square Feet Monthly rent per square foot:
| $2.33 |
Financing Details
Loan AmountThe total sum of money borrowed from a lender to finance a property purchase. Calculation:Purchase Price - Down Payment
Loan amount:
| $1,400,000 |
|---|---|
Loan to Value Ratio (LTV)Loan amount divided by the market value of the property. Calculation:Loan Amount / Market Value
Loan to value ratio:
| 80.0% |
Loan TypeThe type of loan (e.g., fixed, adjustable).
Loan type:
| Amortizing |
TermThe loan repayment period in years.
Term:
| 30 years |
Interest RateThe percentage a lender charges on the borrowed amount of a loan, determining the cost of borrowing money.
Interest rate:
| 6.625% |
Principal & Interest (PI)The principal is the portion of the loan payment that reduces the loan balance. The interest is the lender's charge for borrowing money. Calculation:(P * r * (1 + r) ** n) / ((1 + r) ** n - 1) Where:
P = Loan amount (principal)
Principal & interest:
| $8,964 |
Property TaxesAnnual taxes levied by local governments on real estate properties. These taxes fund public services like schools, roads, and emergency services.
Property tax:
| $1,787 |
InsuranceThe costs for insurance coverage to protect against financial losses due to risks like fire, natural disasters, theft, liability, or tenant-related damages. Calculation:Assumes 7% of gross rental income, unless insurance rates are specified.
Insurance:
| $574 |
Private Mortgage Insurance (PMI)A fee that borrowers pay when they take out a conventional loan with a loan-to-value (LTV) ratio above 80%.
Private mortgage insurance (PMI):
| $0 |
Monthly PaymentThe fixed amount a borrower pays each month to repay a loan. It typically includes principal and interest (P&I) and may also cover property taxes, insurance, HOA fees, and PMI if escrowed. Monthly payment:
| $11,325 |
Operating Income
| % Rent | Monthly | Yearly | |
|---|---|---|---|
Gross RentThe total rental income received from tenants before deducting any expenses. Includes base rent, late fees, pet fees, parking fees, and other recurring charges.
Gross rent:
| $8,200 | $98,400 | |
Vacancy LossExpected loss of rent due to vacancies.
Vacancy loss:
(6%)
| 6% | -$492 | -$5,904 |
Operating IncomeGross rental income minus vacancy loss. Calculation:Gross rent - Vacancy loss
Operating income:
| $7,708 | $92,496 |
Operating Expenses
| % Rent | Monthly | Yearly | |
|---|---|---|---|
Property TaxesAnnual taxes levied by local governments on real estate properties. These taxes fund public services like schools, roads, and emergency services. | 22% | -$1,787 | -$21,447 |
InsuranceThe costs for insurance coverage to protect against financial losses due to risks like fire, natural disasters, theft, liability, or tenant-related damages. Calculation:Assumes 7% of gross rental income, unless insurance rates are specified. | 7% | -$574 | -$6,888 |
Property ManagementThe costs associated with hiring a property manager to handle the day-to-day operations of a rental property. Includes management fees, leasing fes, eviction fees, etc. Calculation:Assumes 8% of gross rental income. | 8% | -$656 | -$7,872 |
Repairs & MaintenanceOngoing costs for routine upkeep and minor fixes needed to keep a property in good working condition. Calculation:Assumes 5% of gross rental income. Varies by property age and condition. | 5% | -$410 | -$4,920 |
Capital ExpensesLarge, infrequent costs for major improvements or replacements, like a new roof, HVAC system, or appliances. Calculation:Assumes 5% of gross rental income. Varies by property age. | 5% | -$410 | -$4,920 |
HOA FeesRegular dues paid to a Homeowners Association for community maintenance, amenities, and management. Similar fees include: Condo Association Fees, Co-op Maintenance Fees, etc. | 5% | -$385 | -$4,620 |
Operating ExpensesRecurring costs required to maintain and manage a rental property, including property taxes, insurance, maintenance, repairs, utilities (if paid by the owner), property management fees, and other day-to-day expenses. Calculation:Insurance + Property Taxes + Property Management + Repairs & Maintenance + Capital Expenditures + HOA Fees | 51% | -$4,222 | -$50,667 |
Cash Flow
| Monthly | Yearly | |
|---|---|---|
Net Operating Income (NOI)The income generated from a property after deducting all operating expenses but before deducting mortgage payments, taxes, and capital expenditures. Calculation:Gross Operating Income - Operating Expenses
Net operating income:
| $3,486 | $41,832 |
Mortgage PaymentThe fixed amount a borrower pays each month to repay a loan. It typically includes principal and interest (P&I) and may also cover property taxes, insurance, HOA fees, and PMI if escrowed. | -$8,964 | -$107,568 |
Cash FlowNet Operating Income (NOI) minus mortgage payments. Calculation:NOI - Mortgage Payments | $5,478 | $65,736 |