
$1,199,000
Investment Summary
- Monthly Cash Flow
- -$4,380
- Cap Rate
- 1.8%
- Cash-on-Cash Return
- -19.1%
- Debt Coverage Ratio
- 0.29
- Internal Rate of Return (5 years)
- -14.4%
Cash Flow
Net Operating Income (NOI) minus mortgage payments.
Calculation:
NOI - Mortgage Payments
Cap Rate (Market Value)
Capitalization Rate is a rate of return that compares the yearly Net Operating Income (NOI) to the market value.
Calculation:
NOI / Market Value
Cash-on-Cash Return (CoC)
Annual Cash Flow / Cash Invested
Calculation:
Annual cash flow divided by initial cash invested.
Debt Coverage Ratio (DCR)
Net Operating Income (NOI) divided by total debt payments.
Calculation:
NOI / Total Debt Payments
Internal Rate of Return (IRR)
A metric for assessing profitability over time. IRR is the discount rate at which the net present value (NPV) of all future cash flows (positive and negative) from an investment equals zero — including both periodic cash flow (such as rent) and a projected sale at the end of the holding period. It represents the expected annualized return, accounting for income, expenses, and the recovery of capital through a future sale.
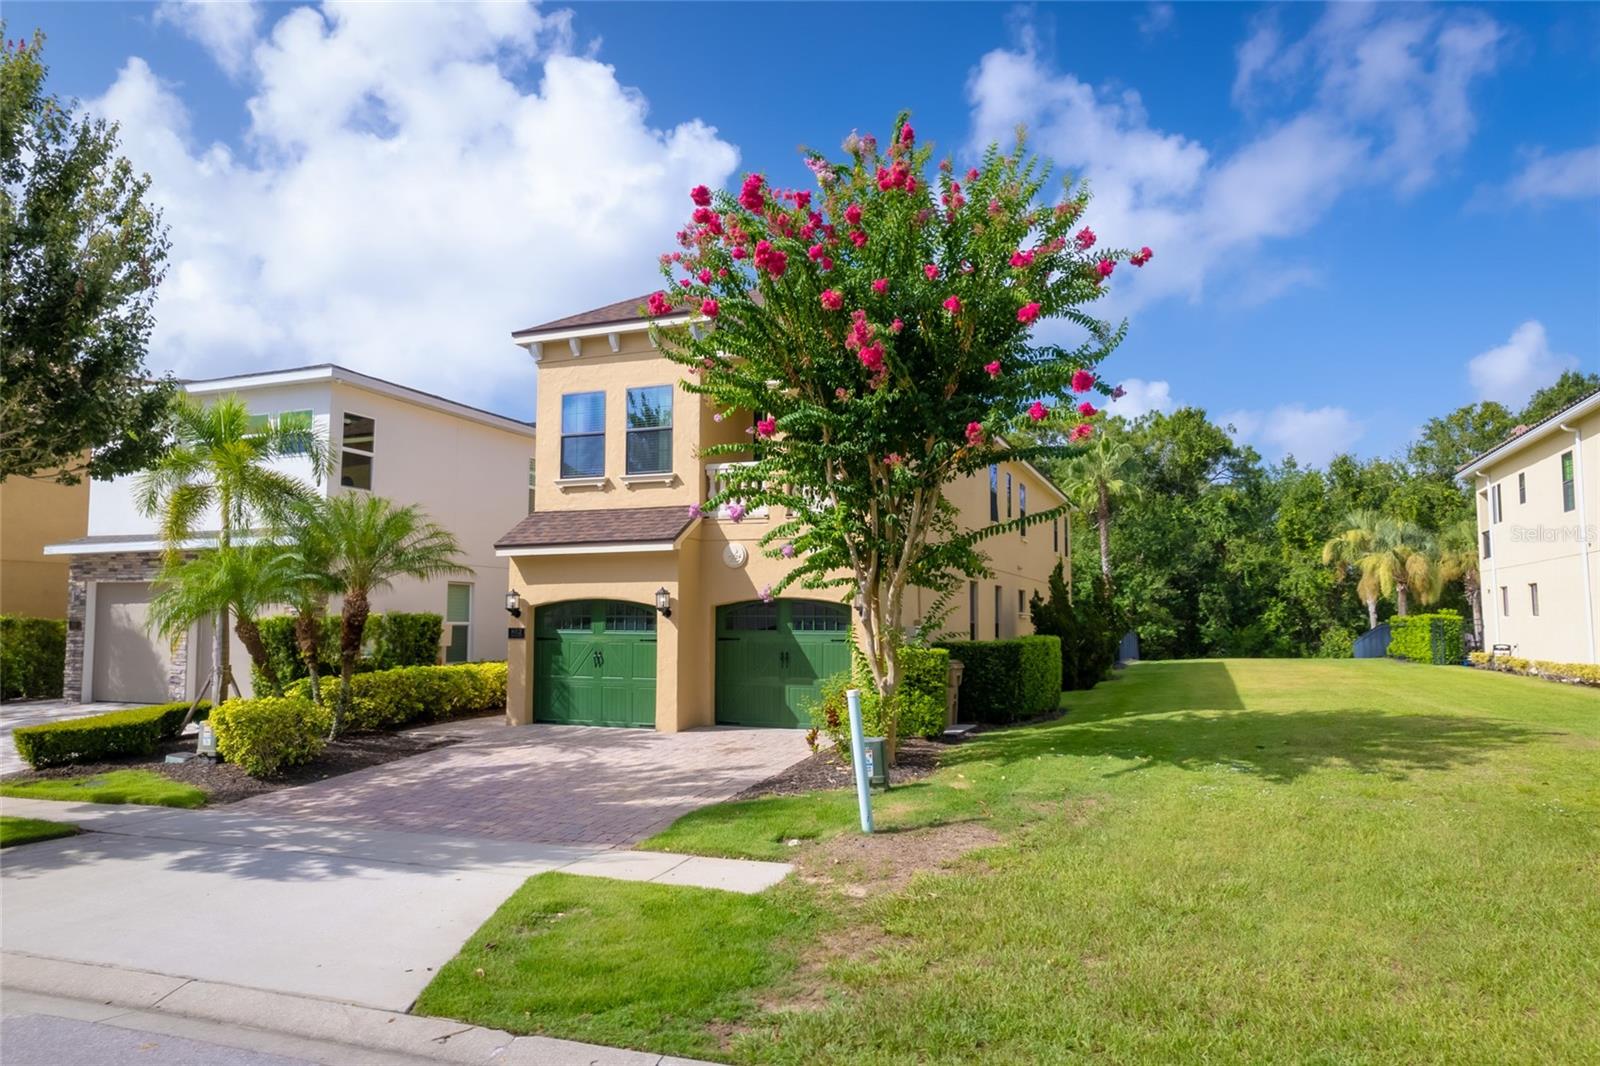
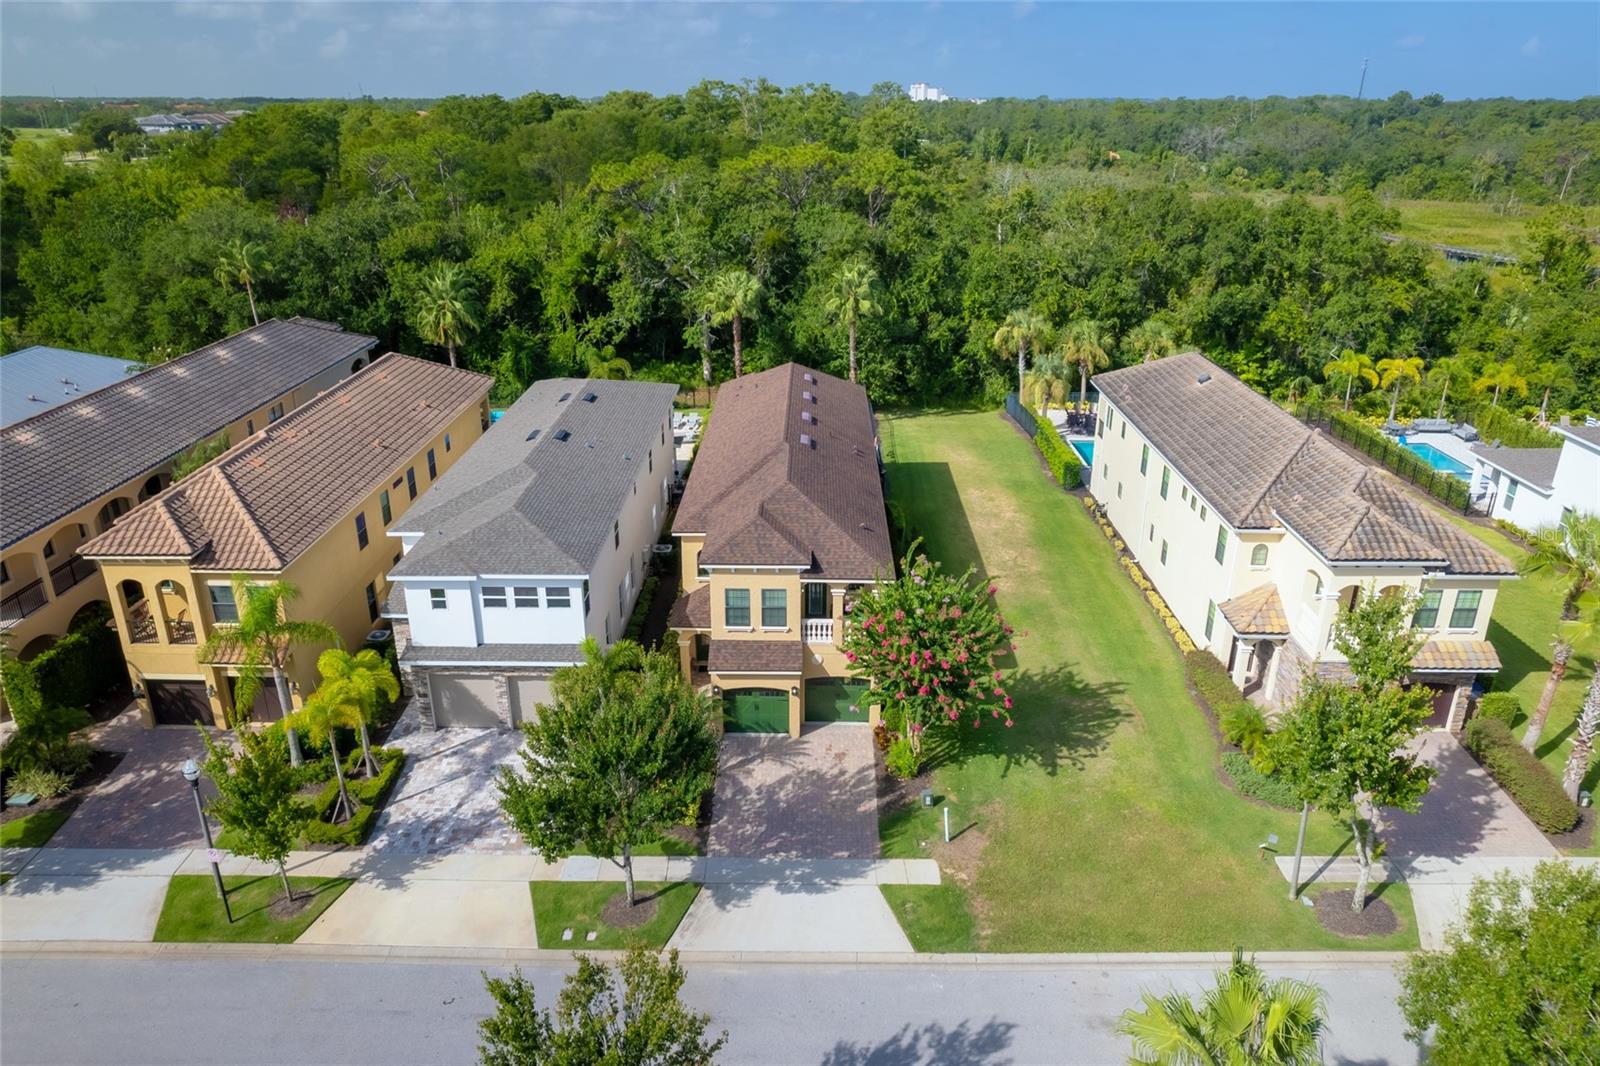
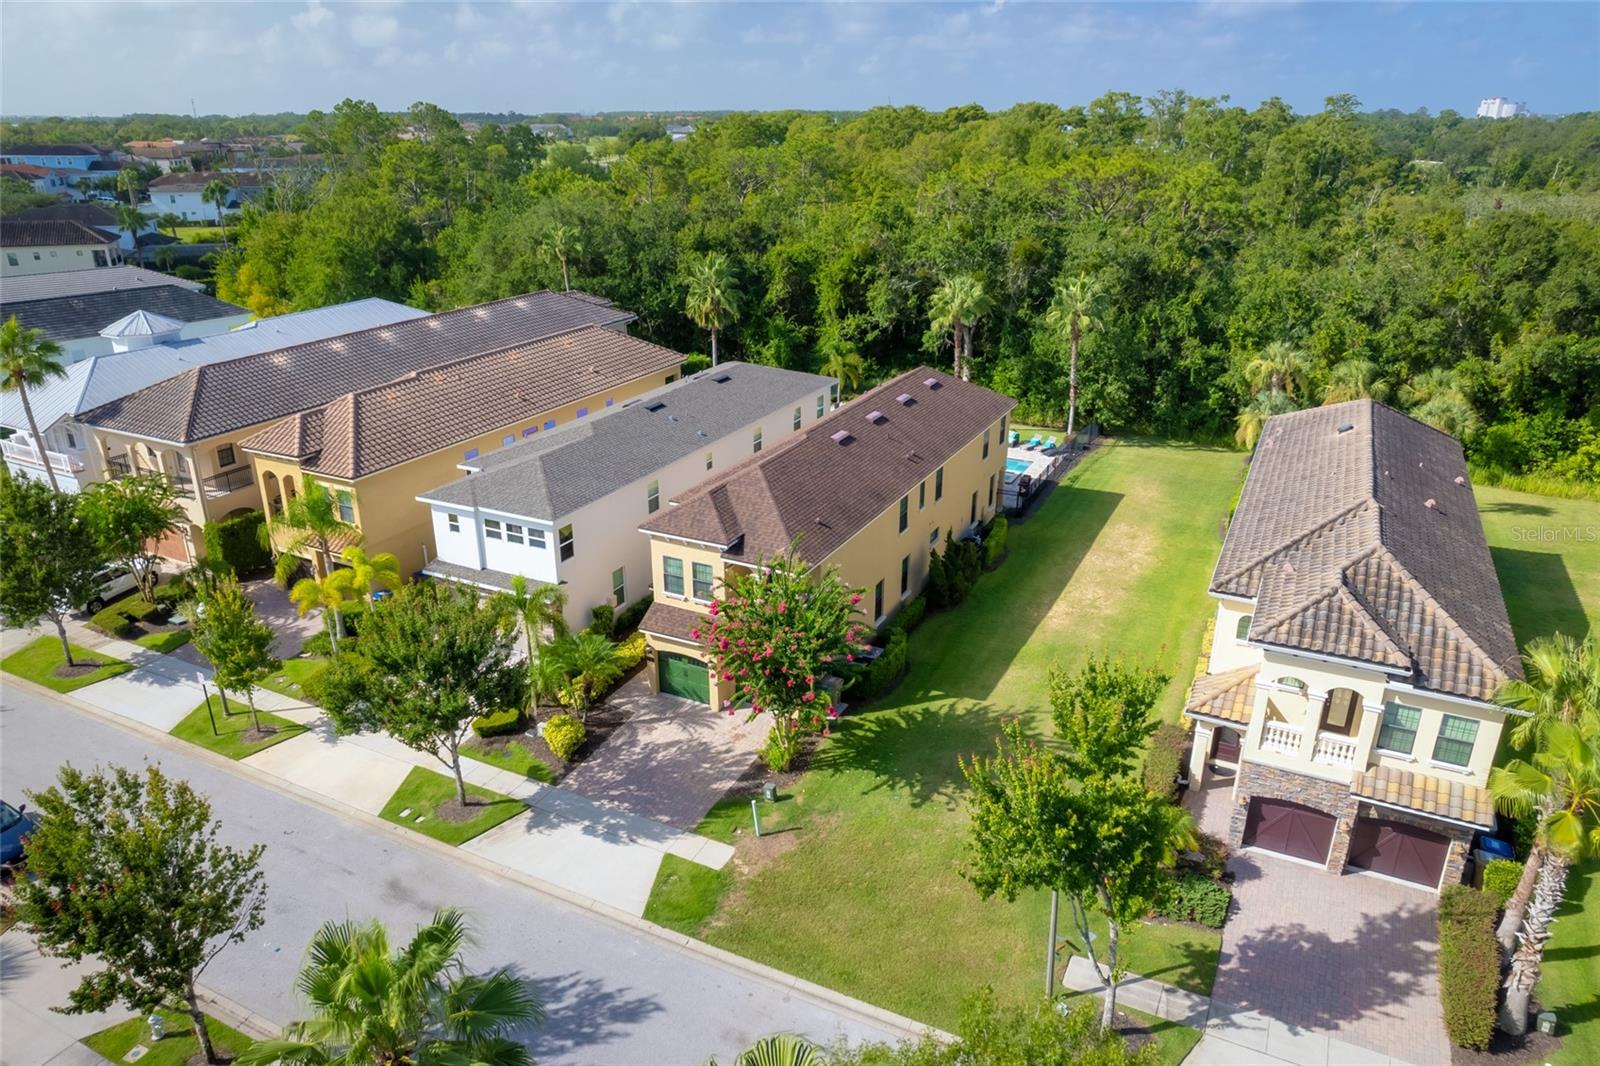
Property Description
Welcome to an extraordinary investment opportunity in the heart of Central Florida’s premier vacation destination—Reunion Resort. This fully furnished 5-bedroom, 5.5-bath luxury home is a turn-key income-producing powerhouse already booked well into 2026, offering immediate returns for the savvy investor. Each bedroom features its own en-suite bath, and the spacious primary suite on the first level boasts dual sinks, a soaking tub, and a separate shower for true resort-style living. Designed for maximum guest appeal, this home features soaring 10-foot ceilings, a dramatic vaulted entry, and an open-concept layout that flows seamlessly from the living space to the kitchen, where granite countertops, stainless steel appliances, 42-inch cabinets, and a large island with a high bar area create a central hub for entertaining. The open space offers lots of windows and a four-panel sliding glass door that floods the home with natural light and opens up to a private pool oasis overlooking a peaceful wooded preserve—ideal for relaxing after a day at the parks. The backyard retreat showcases a heated pool with an attached hot tub spa, surrounded by ample lounge seating for sunbathing, along with a covered patio featuring an outdoor dining table and chairs, and a built-in grill—perfect for entertaining, relaxing, or enjoying Florida’s sunshine year-round. Recent upgrades include a new roof in 2020, a new pool pump and heater in 2023, an AC pipe cleaning system installed in 2024, and a brand-new washer and dryer in 2025, ensuring the property is not only beautiful but also meticulously maintained. The home comes fully furnished and includes a Ring doorbell and exterior security cameras for added peace of mind. With a two-car garage and additional driveway parking, this home is ready to host multiple guests or extended family comfortably. A key highlight of this property is the collection of professionally designed themed bedrooms that elevate the guest experience and enhance rental appeal. Guests can set sail in the vibrant Captain Mickey suite, drift into tranquility in the breezy nautical-inspired room, unwind in the lush jungle retreat, feel like royalty in the elegant princess escape, or dream of adventures in the globally inspired travel-themed room with double beds—each one crafted to delight guests of all ages. Centrally located on the second floor is a dedicated theatre and game area featuring nine plush theatre chairs, blackout curtains, and ample space for relaxation or movie nights, making it a true entertainment hub. Reunion Resort delivers a five-star experience with championship golf courses, on-site dining, multiple resort-style pools, a water park with a lazy river, miniature golf, tennis courts, a fitness center, and miles of walking trails. Just minutes from Disney and with quick access to I-4, 429, and 192, this home checks every box for an investor seeking consistent rental income in a high-demand location. Whether you're looking to expand your short-term rental portfolio or secure a magical family retreat with exceptional earning potential, this is the opportunity you've been waiting for!
Build Your Team
Quickly find investor-friendly professionals who can help you succeed in real estate investing at any stage of the investing journey.


Agents
Match with investor-friendly agents who can help you find, analyze, and close your next deal


Lenders
Get the best funding…find investor-friendly lenders who specialize in your deal strategy


Property Managers
Transition to passive investing. Find a trusted property management partnership that lasts.


Tax Pros & Accountants
Taxes and financial reporting made easy—find experts to create tax savings strategies, file taxes, and more
Location
Property Details
Parking
- Description: Covered, GarageDoorOpener
- Details: Driveway, Attached
- Garage Spaces: 2
- Spaces Total: 0
Bedroom Information
- # of Bedrooms: 5
Bathroom Information
- # of Baths (Full): 5
- # of Baths (Total): 6.0
Interior Features
- # of Rooms: 15
- # of Stories: 2
Exterior Features
- Exterior Walls Materials: Concrete Block
- Foundation: Slab
- Roof Type: Gable or Hip
- Roof Material: Shingle
- Pool: Yes
- Pool Community: Yes
HOA
- Has HOA: Yes
- Association: John Kingsley
- HOA Fee: $520/monthly
Land Information
- Land Use: Residential
- Land Use Subtype: Single Family Residential
Lot Information
- Parcel ID: 352527489200012120
- Lot Size: 6142 sqft
Property Information
- Property Type: Single Family Residence
- Year Built: 2014
Tax Information
- Annual Tax: $13,183
Utilities
- Water & Sewer: Public
- Heating: Central
- Cooling: Central Air
Location
- County: Osceola
Listing Details
Investment Summary
- Monthly Cash Flow
- -$4,380
- Cap Rate
- 1.8%
- Cash-on-Cash Return
- -19.1%
- Debt Coverage Ratio
- 0.29
- Internal Rate of Return (5 years)
- -14.4%
Cash Flow
Net Operating Income (NOI) minus mortgage payments.
Calculation:
NOI - Mortgage Payments
Cap Rate (Market Value)
Capitalization Rate is a rate of return that compares the yearly Net Operating Income (NOI) to the market value.
Calculation:
NOI / Market Value
Cash-on-Cash Return (CoC)
Annual Cash Flow / Cash Invested
Calculation:
Annual cash flow divided by initial cash invested.
Debt Coverage Ratio (DCR)
Net Operating Income (NOI) divided by total debt payments.
Calculation:
NOI / Total Debt Payments
Internal Rate of Return (IRR)
A metric for assessing profitability over time. IRR is the discount rate at which the net present value (NPV) of all future cash flows (positive and negative) from an investment equals zero — including both periodic cash flow (such as rent) and a projected sale at the end of the holding period. It represents the expected annualized return, accounting for income, expenses, and the recovery of capital through a future sale.
Purchase Details
Purchase PriceThe price paid for the property. Purchase price:
| $1,199,000 |
|---|---|
Amount FinancedThe amount of the purchase financed through a loan. Amount financed:
| -$959,200 |
Down paymentThe initial payment made towards the purchase. Down payment:
| $239,800 |
Closing CostsFees and expenses associated with purchasing a property, typically ranging from 2% to 5% of the home’s purchase price, paid at the end of a home purchase to cover services like lending, title transfer, and taxes. Closing costs:
| $35,970 |
Rehab CostsCosts incurred to repair or improve the property, including: roof, flooring, exterior siding, kitchen, exterior paint, bathrooms, etc. Rehab costs:
| $0 |
Initial Cash InvestedThe total initial cash invested in the property. Calculation:Down payment + Buying costs + Rehab costs Initial cash invested:
| $275,770 |
Square Feet (SQFT)The total square footage of the property. Square feet:
| 3,401 |
Cost Per Square FootCost per square foot of the property. Calculation:Purchase Price / Square Feet Cost per square foot:
| $353 |
Monthly Rent Per Square FootMonthly rent divided by the number of square feet. This ratio helps investors compare rental income efficiency across properties, markets, and unit sizes Calculation:Monthly Rent / Square Feet Monthly rent per square foot:
| $1.44 |
Financing Details
Loan AmountThe total sum of money borrowed from a lender to finance a property purchase. Calculation:Purchase Price - Down Payment
Loan amount:
| $959,200 |
|---|---|
Loan to Value Ratio (LTV)Loan amount divided by the market value of the property. Calculation:Loan Amount / Market Value
Loan to value ratio:
| 80.0% |
Loan TypeThe type of loan (e.g., fixed, adjustable).
Loan type:
| Amortizing |
TermThe loan repayment period in years.
Term:
| 30 years |
Interest RateThe percentage a lender charges on the borrowed amount of a loan, determining the cost of borrowing money.
Interest rate:
| 6.625% |
Principal & Interest (PI)The principal is the portion of the loan payment that reduces the loan balance. The interest is the lender's charge for borrowing money. Calculation:(P * r * (1 + r) ** n) / ((1 + r) ** n - 1) Where:
P = Loan amount (principal)
Principal & interest:
| $6,142 |
Property TaxesAnnual taxes levied by local governments on real estate properties. These taxes fund public services like schools, roads, and emergency services.
Property tax:
| $1,099 |
InsuranceThe costs for insurance coverage to protect against financial losses due to risks like fire, natural disasters, theft, liability, or tenant-related damages. Calculation:Assumes 7% of gross rental income, unless insurance rates are specified.
Insurance:
| $343 |
Private Mortgage Insurance (PMI)A fee that borrowers pay when they take out a conventional loan with a loan-to-value (LTV) ratio above 80%.
Private mortgage insurance (PMI):
| $0 |
Monthly PaymentThe fixed amount a borrower pays each month to repay a loan. It typically includes principal and interest (P&I) and may also cover property taxes, insurance, HOA fees, and PMI if escrowed. Monthly payment:
| $7,584 |
Operating Income
| % Rent | Monthly | Yearly | |
|---|---|---|---|
Gross RentThe total rental income received from tenants before deducting any expenses. Includes base rent, late fees, pet fees, parking fees, and other recurring charges.
Gross rent:
| $4,900 | $58,800 | |
Vacancy LossExpected loss of rent due to vacancies.
Vacancy loss:
(6%)
| 6% | -$294 | -$3,528 |
Operating IncomeGross rental income minus vacancy loss. Calculation:Gross rent - Vacancy loss
Operating income:
| $4,606 | $55,272 |
Operating Expenses
| % Rent | Monthly | Yearly | |
|---|---|---|---|
Property TaxesAnnual taxes levied by local governments on real estate properties. These taxes fund public services like schools, roads, and emergency services. | 22% | -$1,099 | -$13,183 |
InsuranceThe costs for insurance coverage to protect against financial losses due to risks like fire, natural disasters, theft, liability, or tenant-related damages. Calculation:Assumes 7% of gross rental income, unless insurance rates are specified. | 7% | -$343 | -$4,116 |
Property ManagementThe costs associated with hiring a property manager to handle the day-to-day operations of a rental property. Includes management fees, leasing fes, eviction fees, etc. Calculation:Assumes 8% of gross rental income. | 8% | -$392 | -$4,704 |
Repairs & MaintenanceOngoing costs for routine upkeep and minor fixes needed to keep a property in good working condition. Calculation:Assumes 5% of gross rental income. Varies by property age and condition. | 5% | -$245 | -$2,940 |
Capital ExpensesLarge, infrequent costs for major improvements or replacements, like a new roof, HVAC system, or appliances. Calculation:Assumes 5% of gross rental income. Varies by property age. | 5% | -$245 | -$2,940 |
HOA FeesRegular dues paid to a Homeowners Association for community maintenance, amenities, and management. Similar fees include: Condo Association Fees, Co-op Maintenance Fees, etc. | 11% | -$520 | -$6,240 |
Operating ExpensesRecurring costs required to maintain and manage a rental property, including property taxes, insurance, maintenance, repairs, utilities (if paid by the owner), property management fees, and other day-to-day expenses. Calculation:Insurance + Property Taxes + Property Management + Repairs & Maintenance + Capital Expenditures + HOA Fees | 58% | -$2,844 | -$34,123 |
Cash Flow
| Monthly | Yearly | |
|---|---|---|
Net Operating Income (NOI)The income generated from a property after deducting all operating expenses but before deducting mortgage payments, taxes, and capital expenditures. Calculation:Gross Operating Income - Operating Expenses
Net operating income:
| $1,762 | $21,144 |
Mortgage PaymentThe fixed amount a borrower pays each month to repay a loan. It typically includes principal and interest (P&I) and may also cover property taxes, insurance, HOA fees, and PMI if escrowed. | -$6,142 | -$73,704 |
Cash FlowNet Operating Income (NOI) minus mortgage payments. Calculation:NOI - Mortgage Payments | $4,380 | $52,560 |