$13,950,000
Investment Summary
- Monthly Cash Flow
- -$63,980
- Cap Rate
- 0.2%
- Cash-on-Cash Return
- -23.9%
- Debt Coverage Ratio
- 0.03
- Internal Rate of Return (5 years)
- -19.1%
Cash Flow
Net Operating Income (NOI) minus mortgage payments.
Calculation:
NOI - Mortgage Payments
Cap Rate (Market Value)
Capitalization Rate is a rate of return that compares the yearly Net Operating Income (NOI) to the market value.
Calculation:
NOI / Market Value
Cash-on-Cash Return (CoC)
Annual Cash Flow / Cash Invested
Calculation:
Annual cash flow divided by initial cash invested.
Debt Coverage Ratio (DCR)
Net Operating Income (NOI) divided by total debt payments.
Calculation:
NOI / Total Debt Payments
Internal Rate of Return (IRR)
A metric for assessing profitability over time. IRR is the discount rate at which the net present value (NPV) of all future cash flows (positive and negative) from an investment equals zero — including both periodic cash flow (such as rent) and a projected sale at the end of the holding period. It represents the expected annualized return, accounting for income, expenses, and the recovery of capital through a future sale.
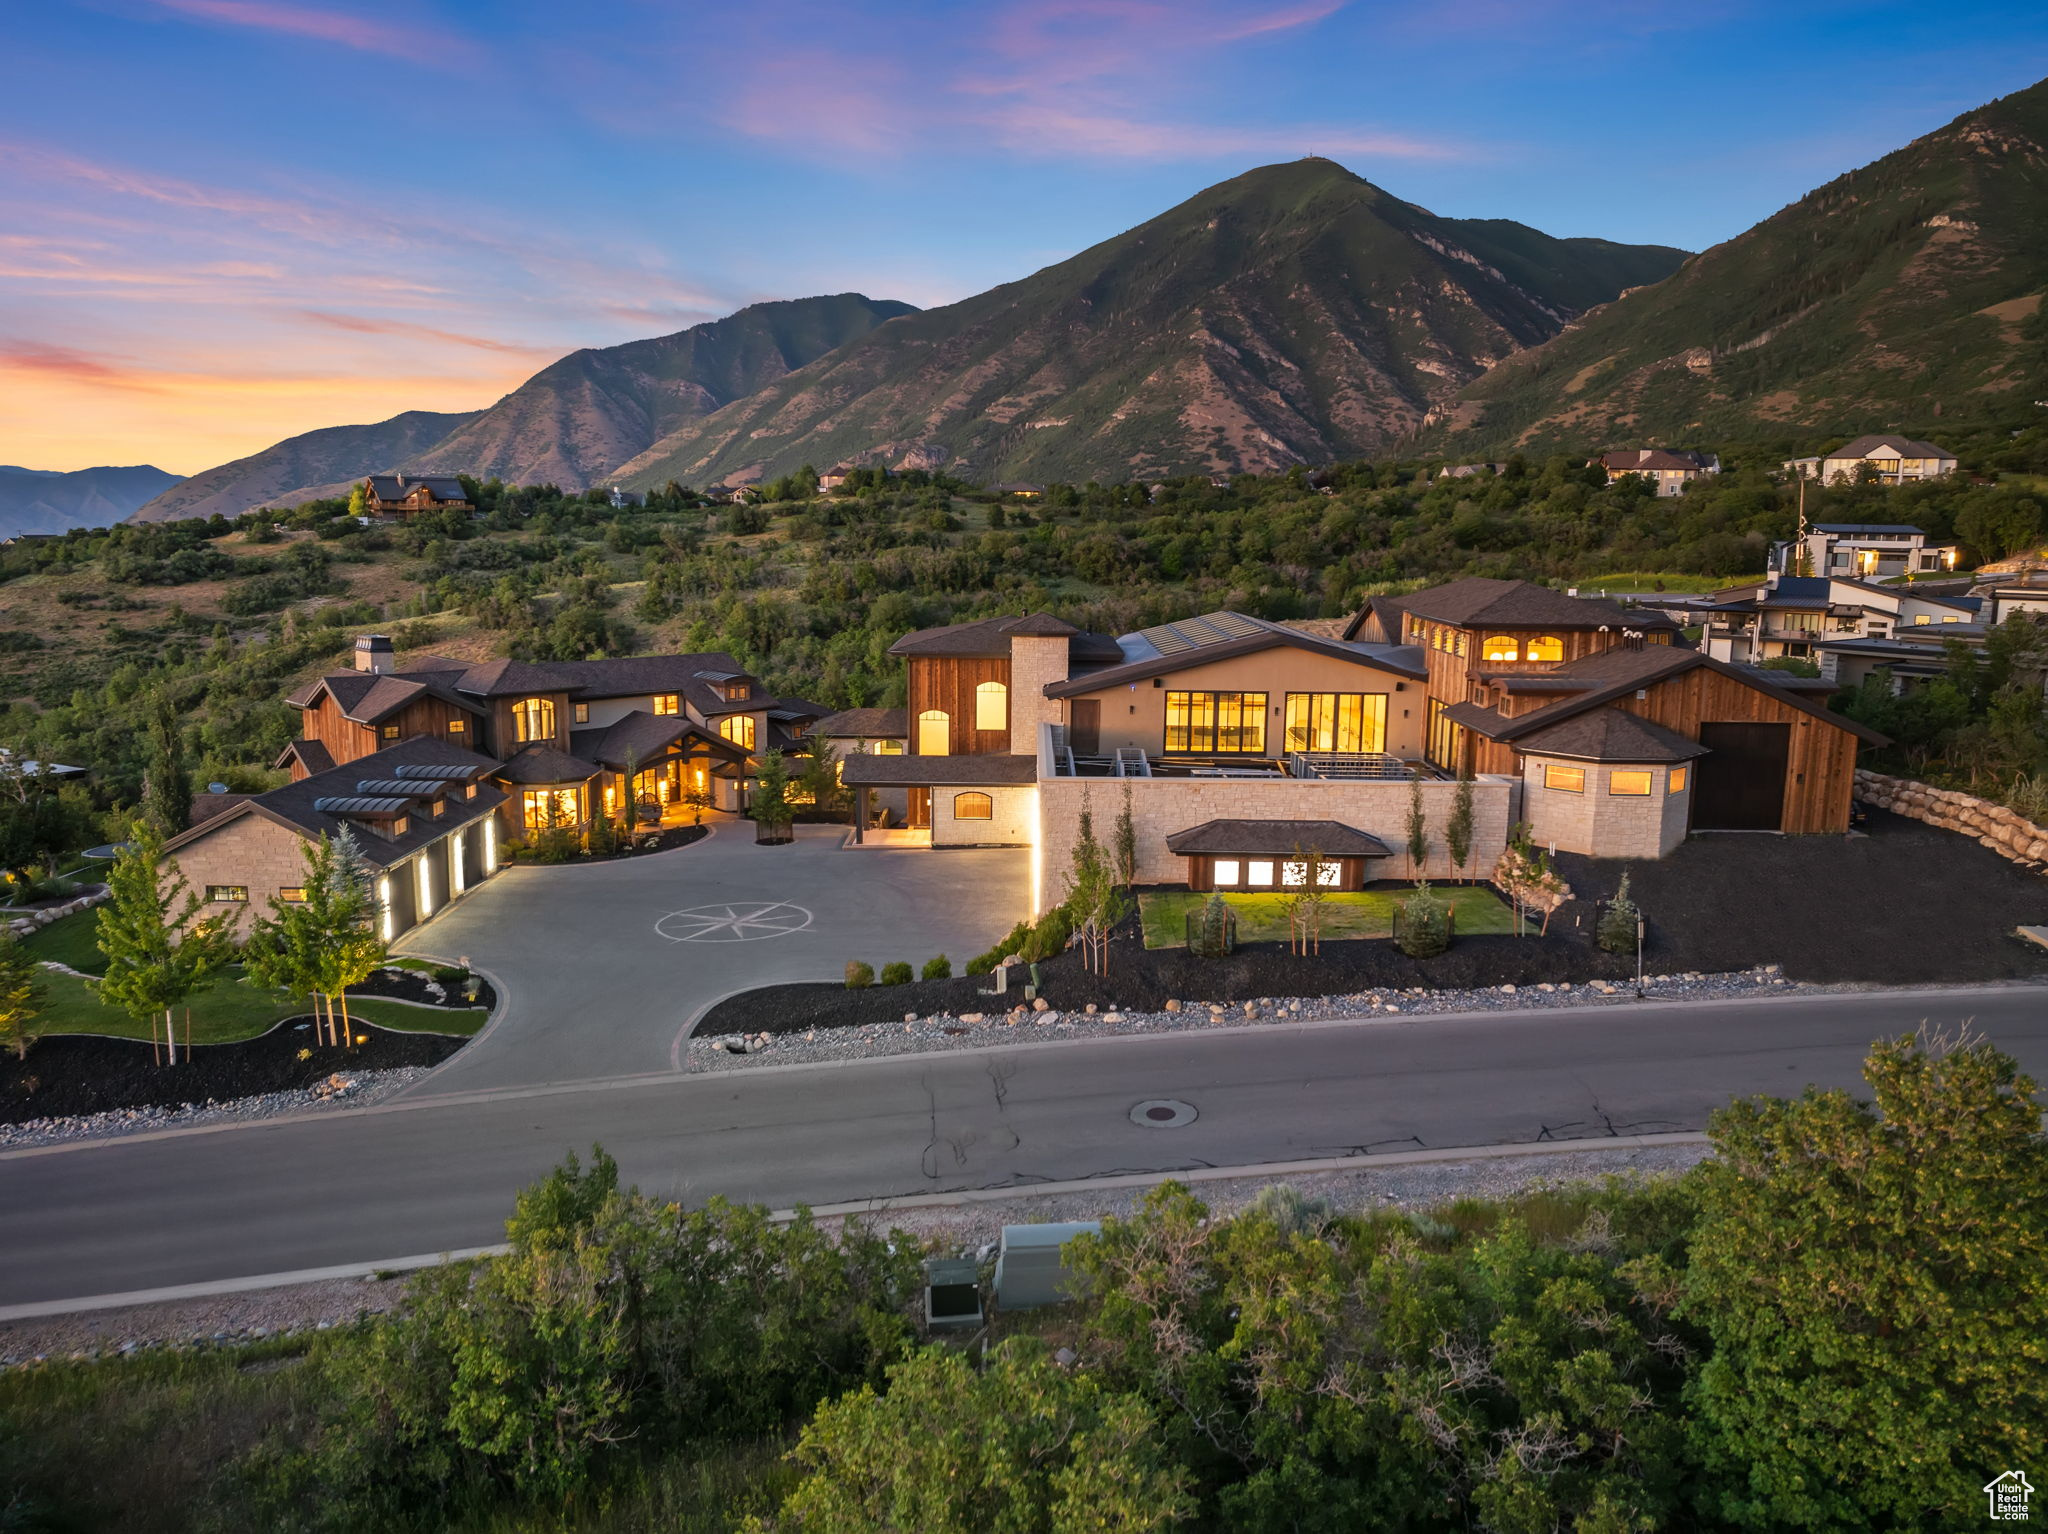
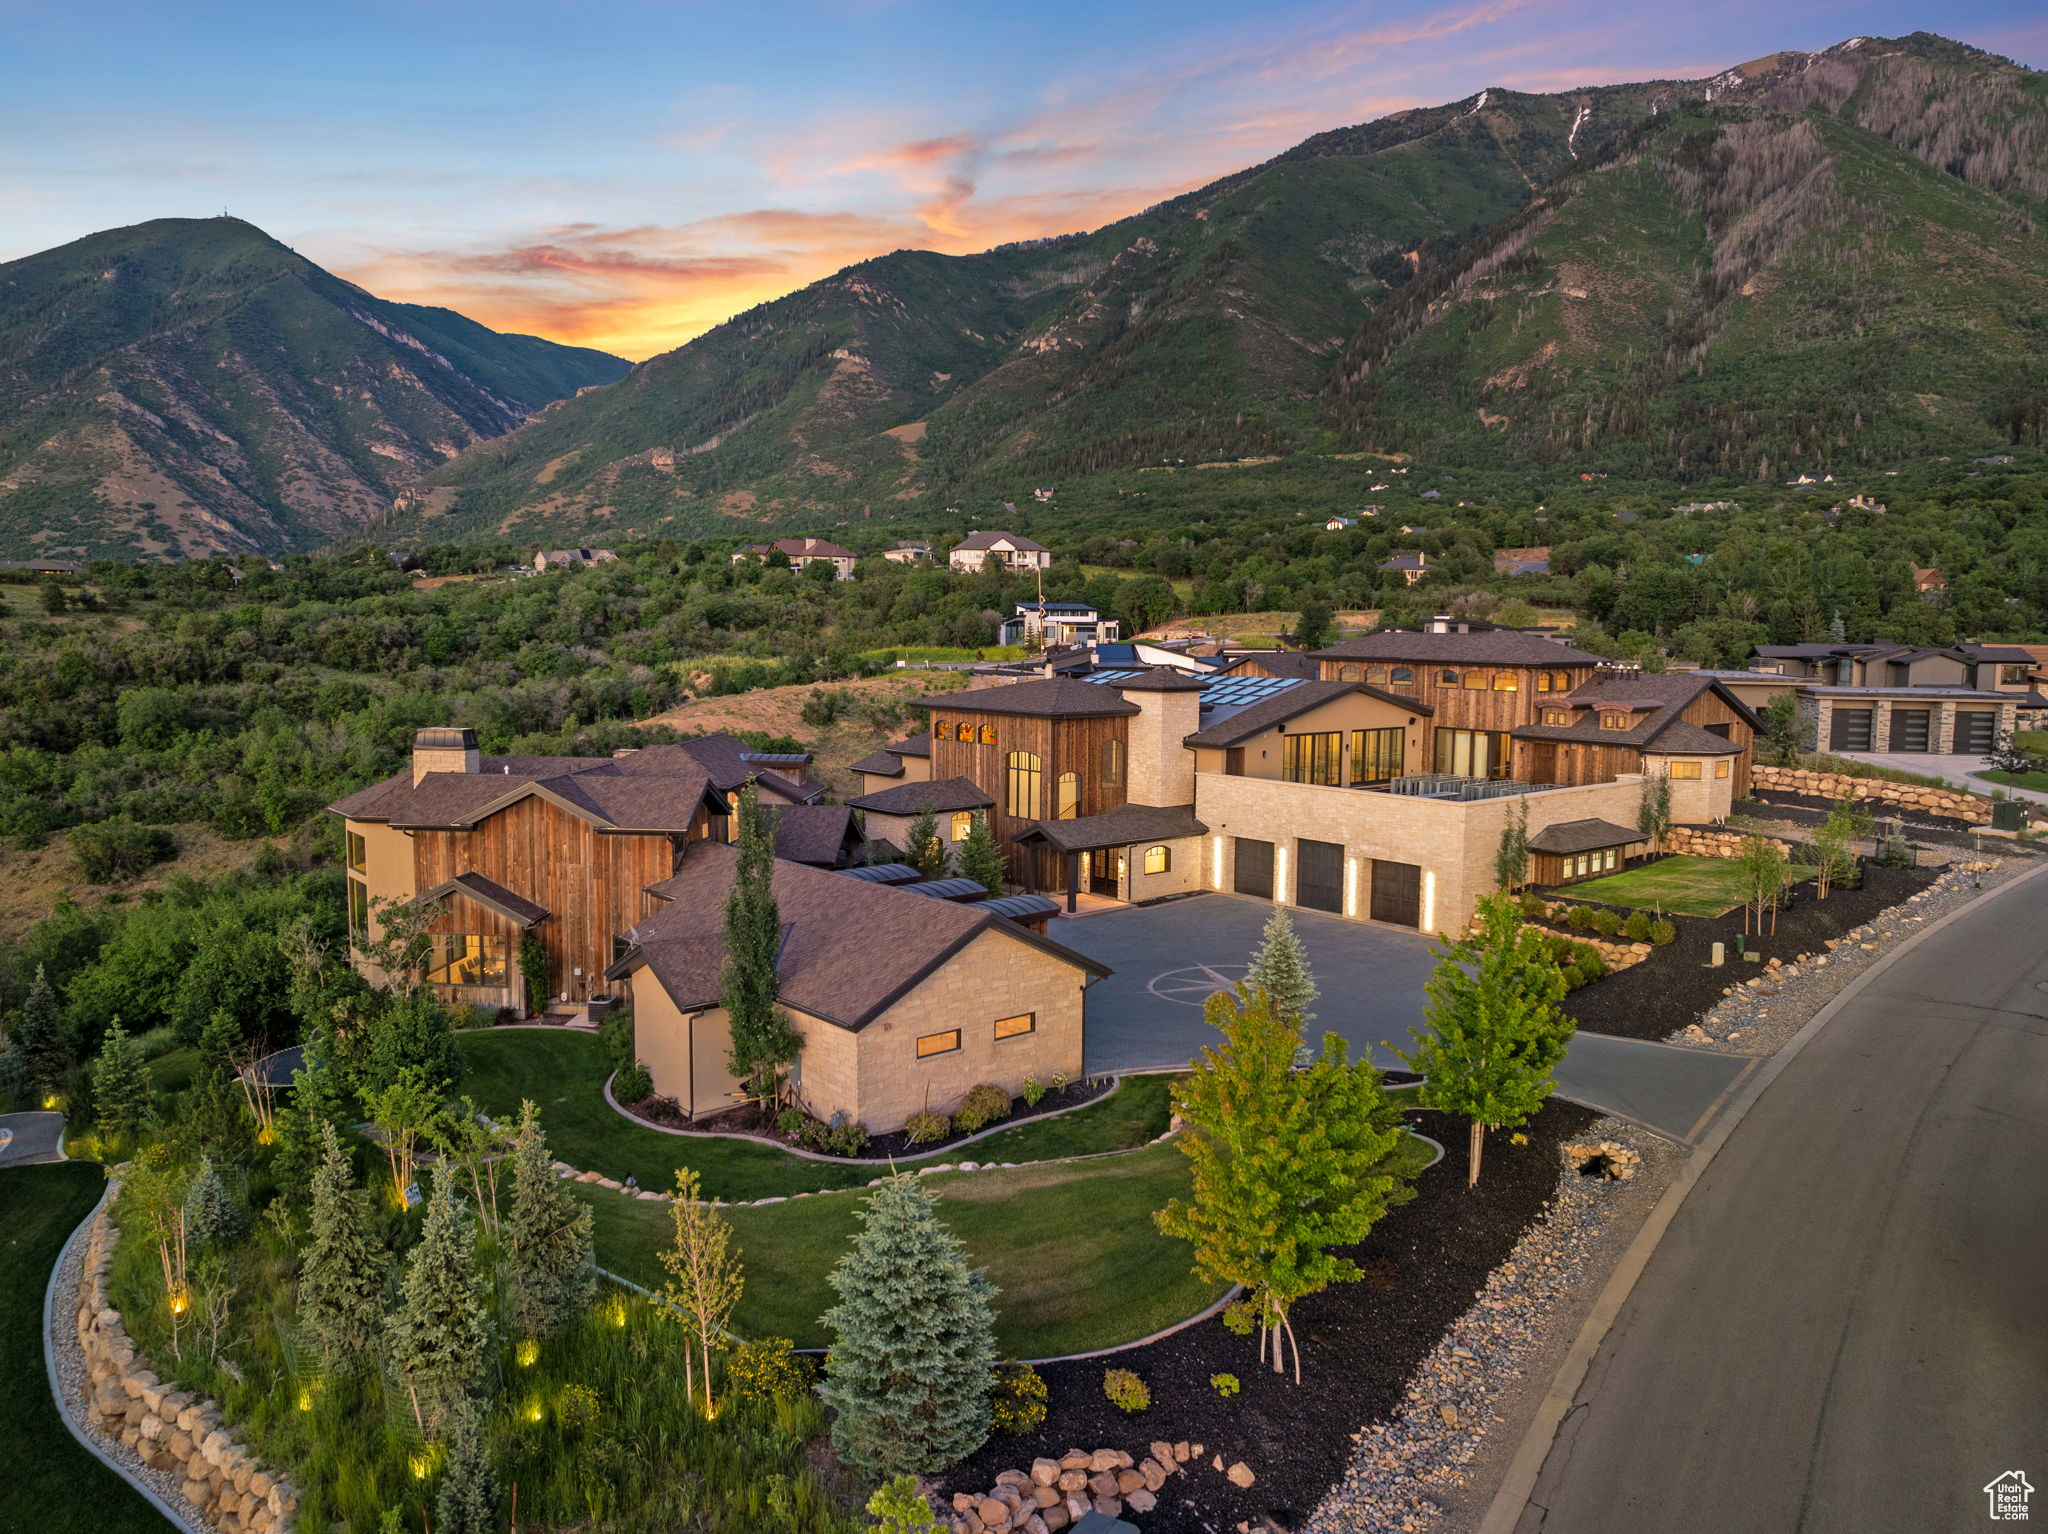
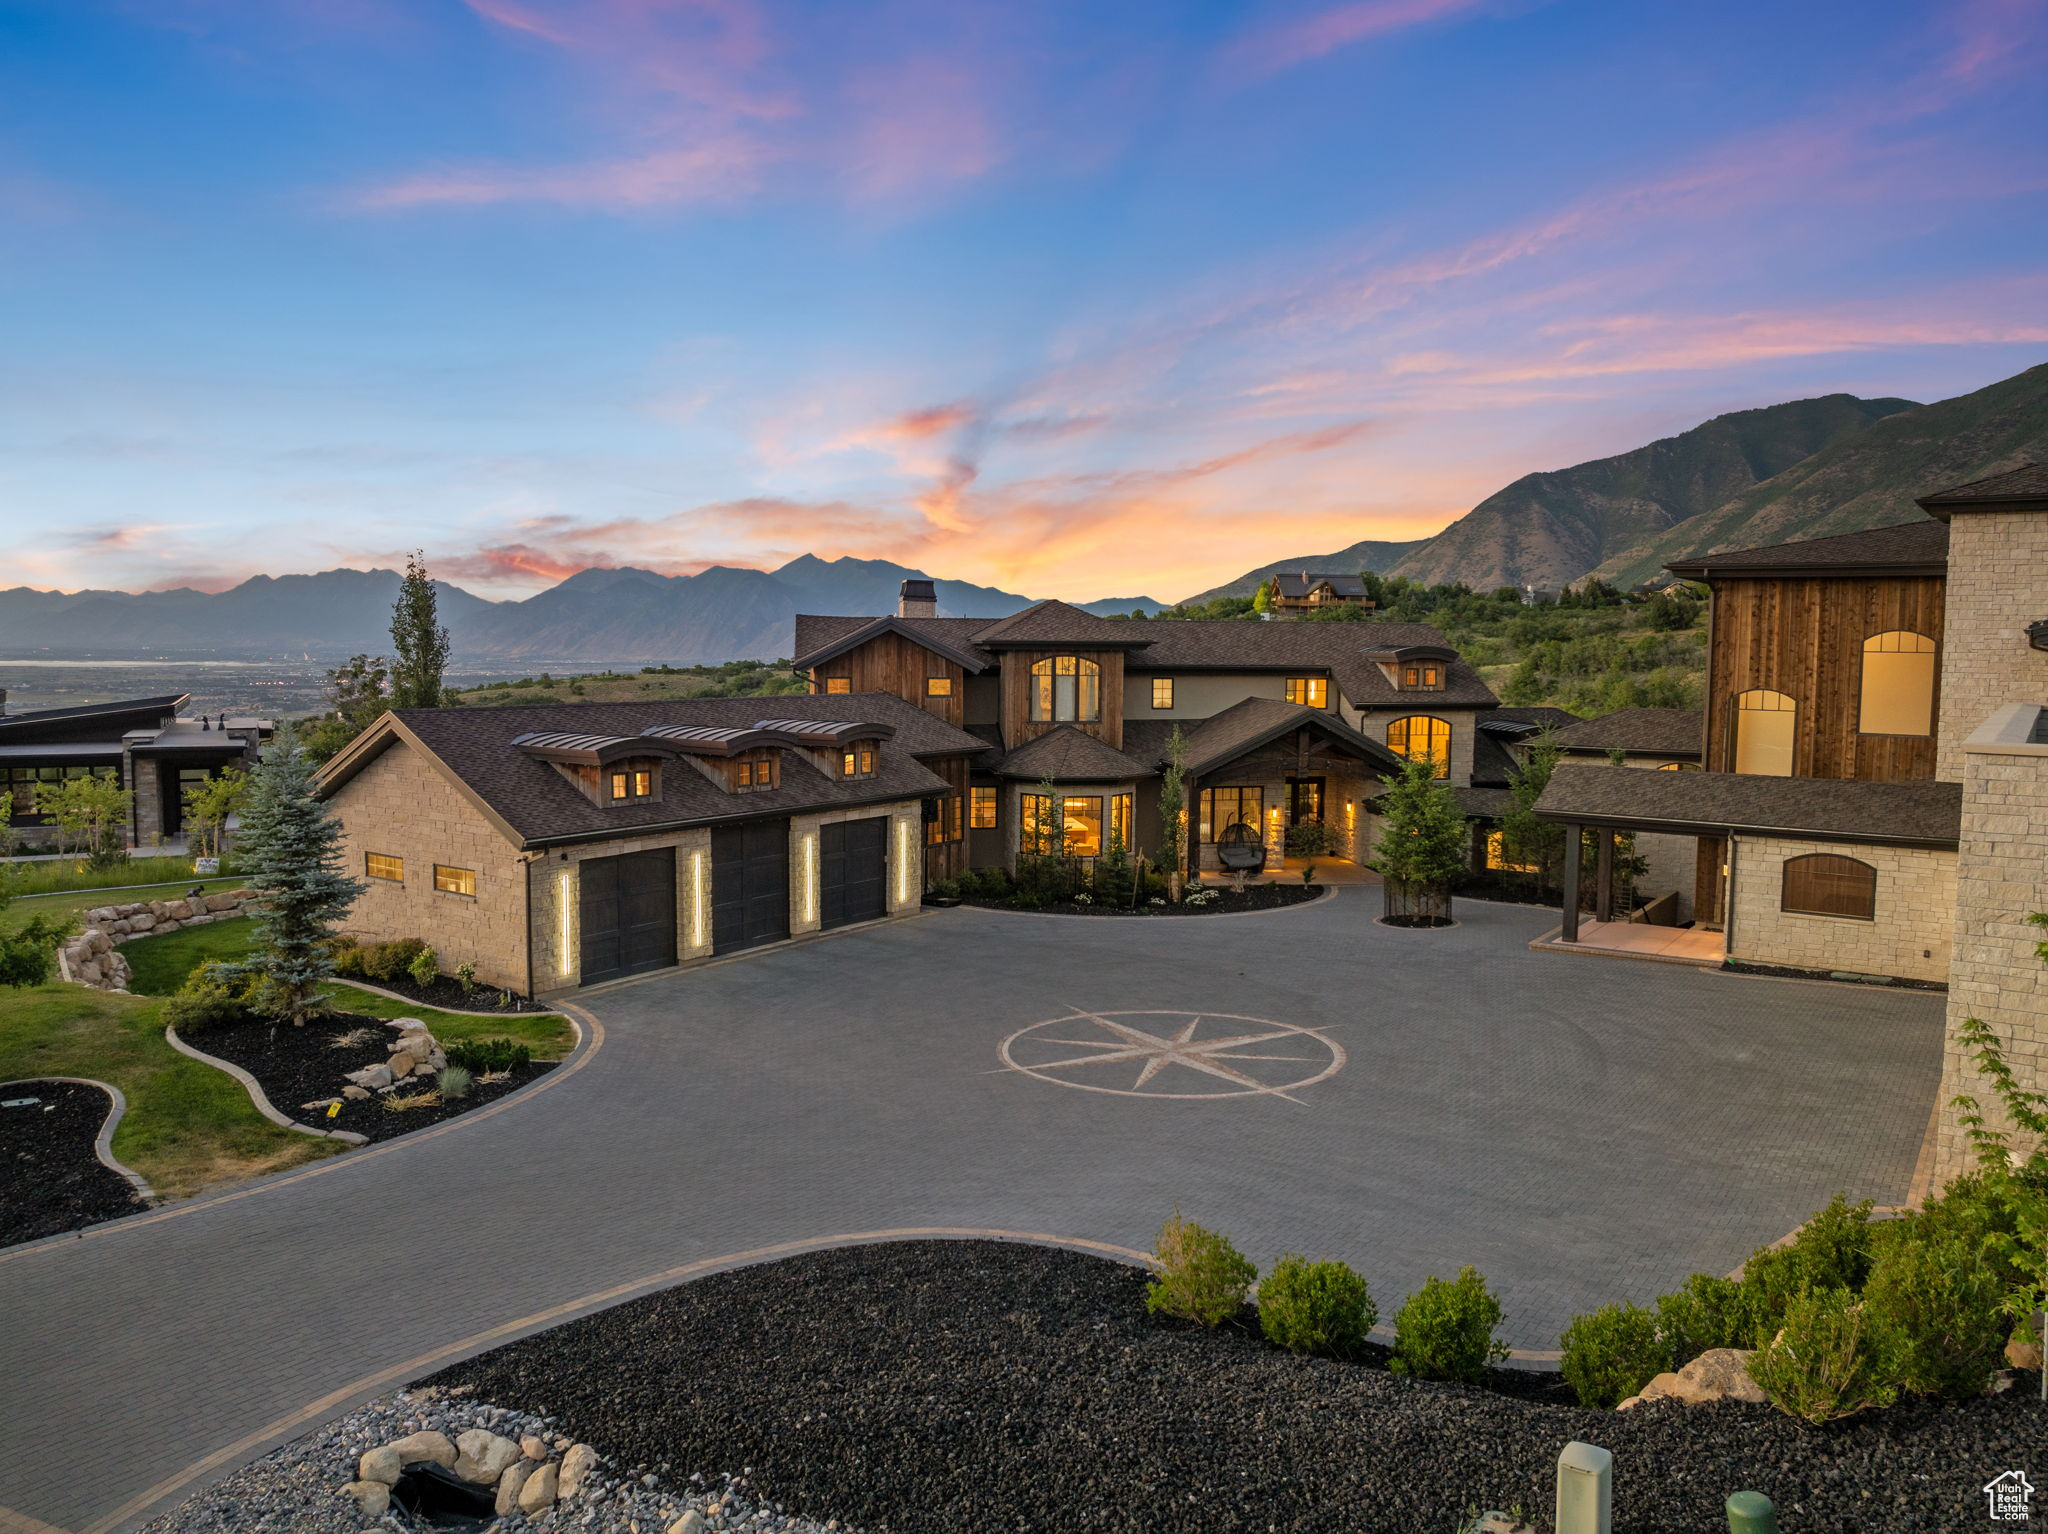
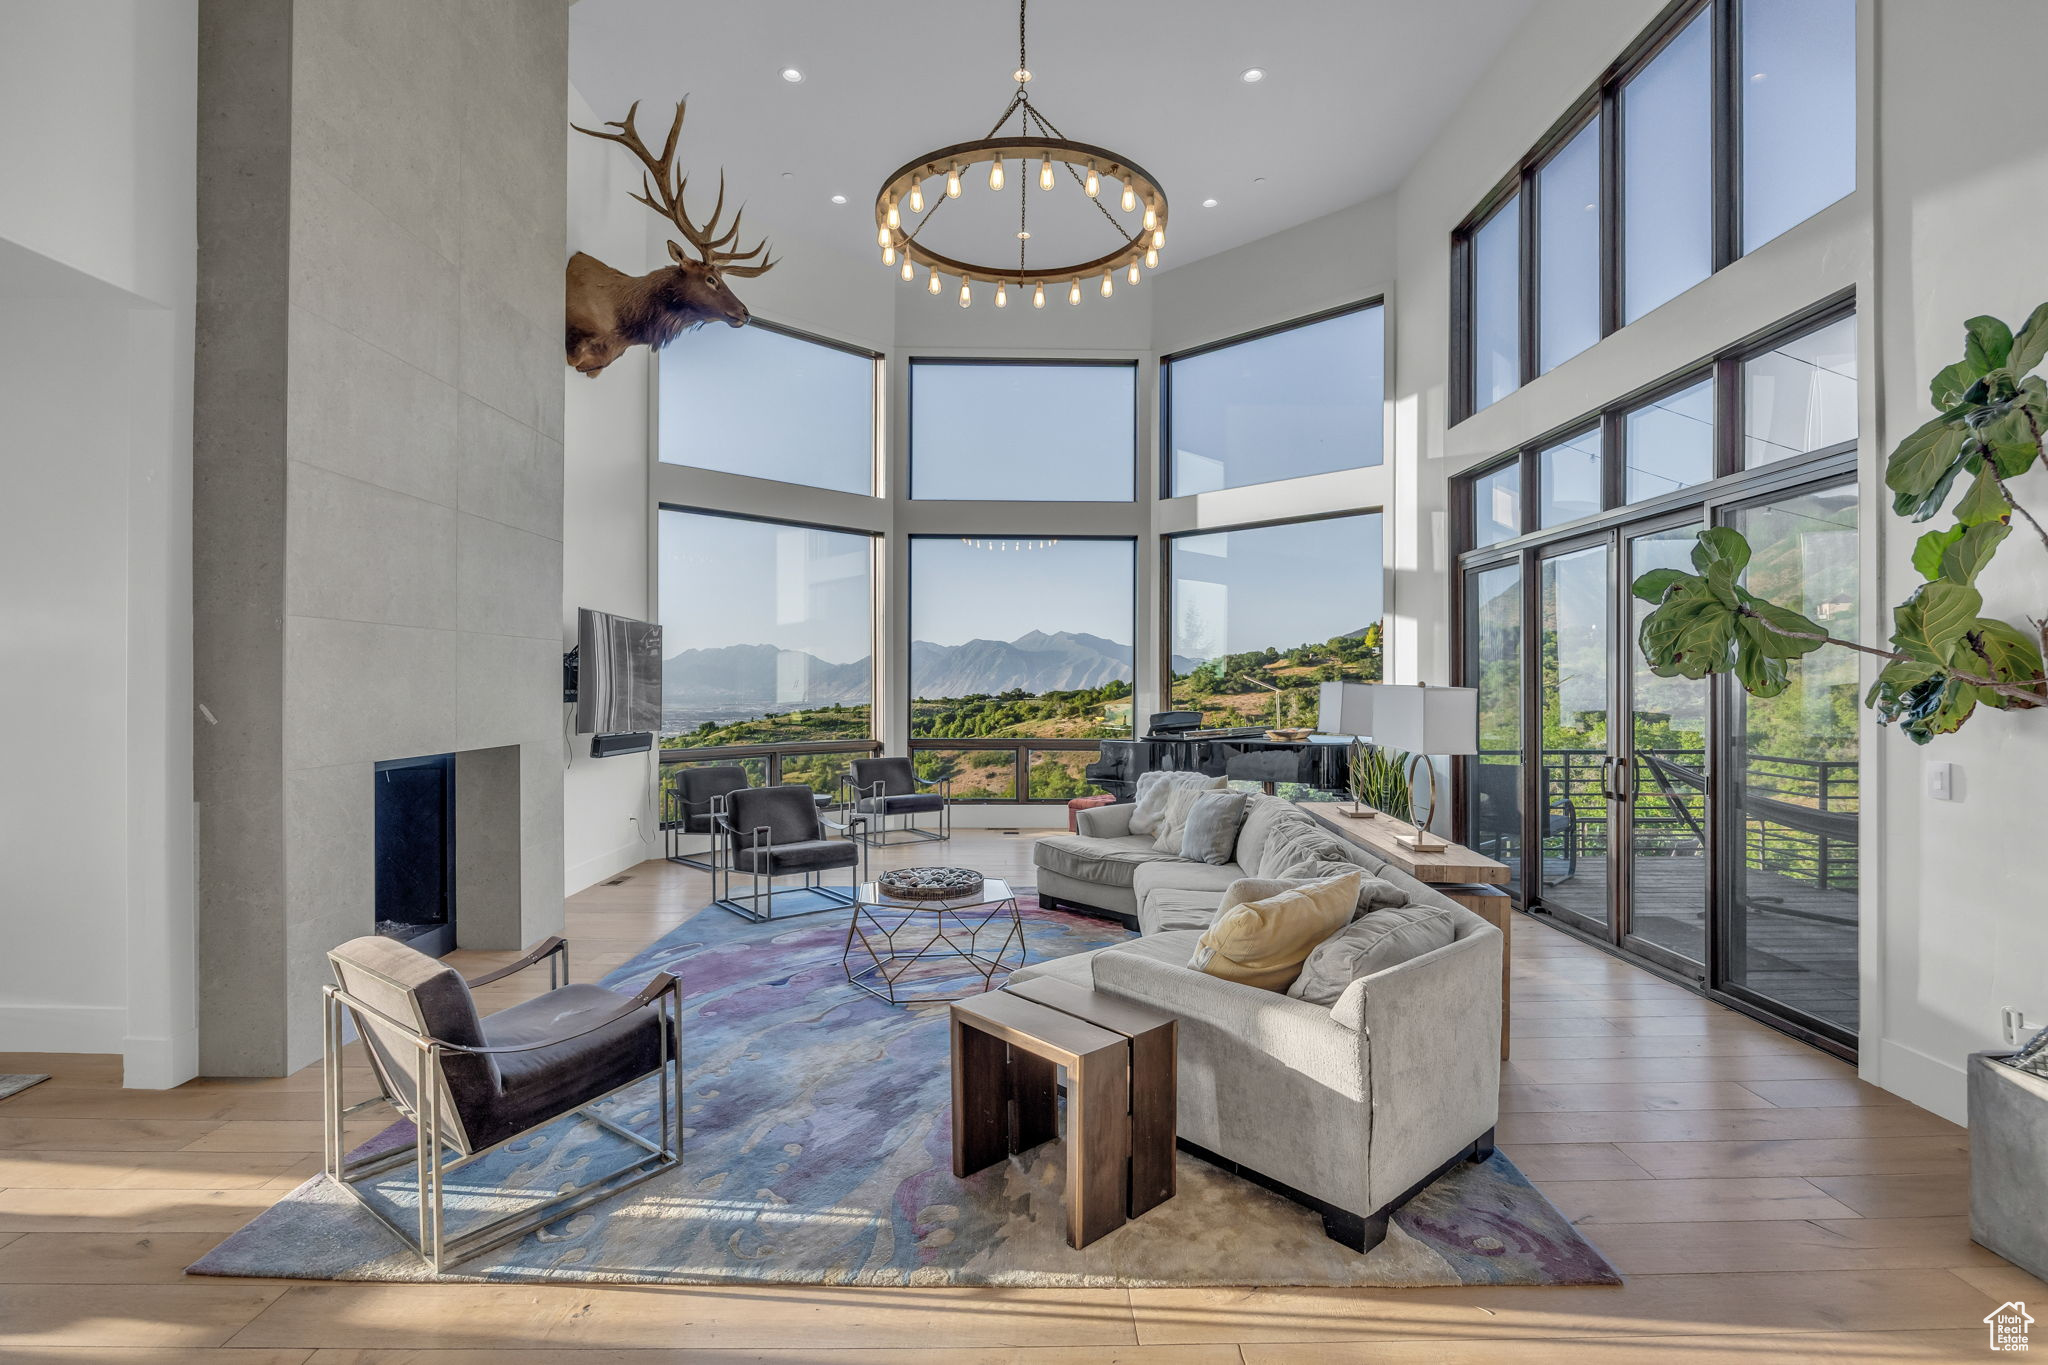
Property Description
Welcome to one of Utah's most extraordinary private estates, set within the prestigious gated community of Summit Creek in Woodland Hills. Designed by renowned architect Kevin Price through the vision of Real Estate YouTube star Kris Krohn, this masterpiece was created to exceed expectations with limitless potential. The compound is thoughtfully composed of two distinct wings that together offer an unparalleled living and entertaining experience. The 8,500-square-foot private family wing is a stunning retreat in itself, featuring five bedrooms, a gourmet kitchen, a spectacular great room with double-story glass walls framing panoramic mountain vistas, an elegant office, and refined living spaces. This wing also includes a 3-car garage for daily convenience. The recently completed 20,000-square-foot addition is where the estate transcends anything else on the market. Conceived as a place where imagination becomes reality, this wing delivers an almost cinematic level of luxury and flexibility. At its heart is a show-stopping indoor pool with a world-class hydraulic floor system that transforms into a grand ballroom-an engineering marvel inspired by The O Theater at the Bellagio in Las Vegas. An ultra-luxury spa retreat offers a dry sauna, steam room, massage room, float room, and more, creating a true wellness destination at home. The addition also includes a true executive office suite and separate conference room, ready to host everything from corporate meetings to creative collaborations, along with a dedicated racquetball space for sport and recreation, and large chef's kitchen for entertaining. Throughout the space, stunning galleries and walls are designed to showcase art, crystal collections, or installations, giving it the feel of a private museum. For car enthusiasts, a sprawling display garage accommodates 13 cars, complete with lounge areas and elevated presentation platforms perfect for collectors or those seeking to impress. Additional unfinished space offers the opportunity to build the ultimate gym, including a professional-grade triple-story climbing wall. This estate is designed to suit a visionary buyer-whether it becomes an extended family compound, a corporate retreat, an entertainer's dream, or the ultimate venue for any celebrity to host podcasts, productions, and events on an epic scale. Beyond the property itself, Summit Creek offers Utah County's premier gated mountain living, with amenities that include pickleball courts, a state-of-the-art fitness center, an outdoor pool facility with breathtaking mountain scenery, a community clubhouse, and an extensive network of private trails and open space. Residents enjoy excellent access to everything that makes Utah special, with a short drive to Provo Airport, world-class skiing at Sundance Resort, top-tier medical facilities, shopping, dining, and endless outdoor recreation. This is not just a home, it is a private kingdom of possibility.
Build Your Team
Quickly find investor-friendly professionals who can help you succeed in real estate investing at any stage of the investing journey.


Agents
Match with investor-friendly agents who can help you find, analyze, and close your next deal


Lenders
Get the best funding…find investor-friendly lenders who specialize in your deal strategy


Property Managers
Transition to passive investing. Find a trusted property management partnership that lasts.


Tax Pros & Accountants
Taxes and financial reporting made easy—find experts to create tax savings strategies, file taxes, and more
Location
Property Details
Parking
- Description: Attached Garage
- Details: RV Access/Parking
- Garage Spaces: 13
- Spaces Total: 23
Bedroom Information
- # of Bedrooms: 6
Bathroom Information
- # of Baths (Full): 2
- # of Baths (Partial): 2
- # of Baths (Total): 10.0
Interior Features
- # of Rooms: 35
- # of Stories: 3
- Basement: Yes
- Basement Description: Daylight
- Fireplace: Yes
Exterior Features
- Exterior Walls Materials: Stucco
- Roof Type: Gable
- Roof Material: Asphalt
HOA
- Has HOA: Yes
- HOA Fee: $340/monthly
Land Information
- Land Use: Residential
- Land Use Subtype: Single Family Residential
Lot Information
- Parcel ID: 668040001
- Lot Size: 71438 sqft
Property Information
- Property Type: Single Family Residence
- Year Built: 2017
Tax Information
- Annual Tax: $466
Utilities
- Heating: Central, Natural Gas, Forced Air, Hot Water
- Cooling: Central Air
Location
- County: Utah
Listing Details
Investment Summary
- Monthly Cash Flow
- -$63,980
- Cap Rate
- 0.2%
- Cash-on-Cash Return
- -23.9%
- Debt Coverage Ratio
- 0.03
- Internal Rate of Return (5 years)
- -19.1%
Cash Flow
Net Operating Income (NOI) minus mortgage payments.
Calculation:
NOI - Mortgage Payments
Cap Rate (Market Value)
Capitalization Rate is a rate of return that compares the yearly Net Operating Income (NOI) to the market value.
Calculation:
NOI / Market Value
Cash-on-Cash Return (CoC)
Annual Cash Flow / Cash Invested
Calculation:
Annual cash flow divided by initial cash invested.
Debt Coverage Ratio (DCR)
Net Operating Income (NOI) divided by total debt payments.
Calculation:
NOI / Total Debt Payments
Internal Rate of Return (IRR)
A metric for assessing profitability over time. IRR is the discount rate at which the net present value (NPV) of all future cash flows (positive and negative) from an investment equals zero — including both periodic cash flow (such as rent) and a projected sale at the end of the holding period. It represents the expected annualized return, accounting for income, expenses, and the recovery of capital through a future sale.
Purchase Details
Purchase PriceThe price paid for the property. Purchase price:
| $13,950,000 |
|---|---|
Amount FinancedThe amount of the purchase financed through a loan. Amount financed:
| -$11,160,000 |
Down paymentThe initial payment made towards the purchase. Down payment:
| $2,790,000 |
Closing CostsFees and expenses associated with purchasing a property, typically ranging from 2% to 5% of the home’s purchase price, paid at the end of a home purchase to cover services like lending, title transfer, and taxes. Closing costs:
| $418,500 |
Rehab CostsCosts incurred to repair or improve the property, including: roof, flooring, exterior siding, kitchen, exterior paint, bathrooms, etc. Rehab costs:
| $0 |
Initial Cash InvestedThe total initial cash invested in the property. Calculation:Down payment + Buying costs + Rehab costs Initial cash invested:
| $3,208,500 |
Square Feet (SQFT)The total square footage of the property. Square feet:
| 23,460 |
Cost Per Square FootCost per square foot of the property. Calculation:Purchase Price / Square Feet Cost per square foot:
| $595 |
Monthly Rent Per Square FootMonthly rent divided by the number of square feet. This ratio helps investors compare rental income efficiency across properties, markets, and unit sizes Calculation:Monthly Rent / Square Feet Monthly rent per square foot:
| $0.15 |
Financing Details
Loan AmountThe total sum of money borrowed from a lender to finance a property purchase. Calculation:Purchase Price - Down Payment
Loan amount:
| $11,160,000 |
|---|---|
Loan to Value Ratio (LTV)Loan amount divided by the market value of the property. Calculation:Loan Amount / Market Value
Loan to value ratio:
| 80.0% |
Loan TypeThe type of loan (e.g., fixed, adjustable).
Loan type:
| Amortizing |
TermThe loan repayment period in years.
Term:
| 30 years |
Interest RateThe percentage a lender charges on the borrowed amount of a loan, determining the cost of borrowing money.
Interest rate:
| 5.875% |
Principal & Interest (PI)The principal is the portion of the loan payment that reduces the loan balance. The interest is the lender's charge for borrowing money. Calculation:(P * r * (1 + r) ** n) / ((1 + r) ** n - 1) Where:
P = Loan amount (principal)
Principal & interest:
| $66,016 |
Property TaxesAnnual taxes levied by local governments on real estate properties. These taxes fund public services like schools, roads, and emergency services.
Property tax:
| $39 |
InsuranceThe costs for insurance coverage to protect against financial losses due to risks like fire, natural disasters, theft, liability, or tenant-related damages. Calculation:Assumes 7% of gross rental income, unless insurance rates are specified.
Insurance:
| $245 |
Private Mortgage Insurance (PMI)A fee that borrowers pay when they take out a conventional loan with a loan-to-value (LTV) ratio above 80%.
Private mortgage insurance (PMI):
| $0 |
Monthly PaymentThe fixed amount a borrower pays each month to repay a loan. It typically includes principal and interest (P&I) and may also cover property taxes, insurance, HOA fees, and PMI if escrowed. Monthly payment:
| $66,300 |
Operating Income
| % Rent | Monthly | Yearly | |
|---|---|---|---|
Gross RentThe total rental income received from tenants before deducting any expenses. Includes base rent, late fees, pet fees, parking fees, and other recurring charges.
Gross rent:
| $3,500 | $42,000 | |
Vacancy LossExpected loss of rent due to vacancies.
Vacancy loss:
(6%)
| 6% | -$210 | -$2,520 |
Operating IncomeGross rental income minus vacancy loss. Calculation:Gross rent - Vacancy loss
Operating income:
| $3,290 | $39,480 |
Operating Expenses
| % Rent | Monthly | Yearly | |
|---|---|---|---|
Property TaxesAnnual taxes levied by local governments on real estate properties. These taxes fund public services like schools, roads, and emergency services. | 1% | -$39 | -$466 |
InsuranceThe costs for insurance coverage to protect against financial losses due to risks like fire, natural disasters, theft, liability, or tenant-related damages. Calculation:Assumes 7% of gross rental income, unless insurance rates are specified. | 7% | -$245 | -$2,940 |
Property ManagementThe costs associated with hiring a property manager to handle the day-to-day operations of a rental property. Includes management fees, leasing fes, eviction fees, etc. Calculation:Assumes 8% of gross rental income. | 8% | -$280 | -$3,360 |
Repairs & MaintenanceOngoing costs for routine upkeep and minor fixes needed to keep a property in good working condition. Calculation:Assumes 5% of gross rental income. Varies by property age and condition. | 5% | -$175 | -$2,100 |
Capital ExpensesLarge, infrequent costs for major improvements or replacements, like a new roof, HVAC system, or appliances. Calculation:Assumes 5% of gross rental income. Varies by property age. | 5% | -$175 | -$2,100 |
HOA FeesRegular dues paid to a Homeowners Association for community maintenance, amenities, and management. Similar fees include: Condo Association Fees, Co-op Maintenance Fees, etc. | 10% | -$340 | -$4,080 |
Operating ExpensesRecurring costs required to maintain and manage a rental property, including property taxes, insurance, maintenance, repairs, utilities (if paid by the owner), property management fees, and other day-to-day expenses. Calculation:Insurance + Property Taxes + Property Management + Repairs & Maintenance + Capital Expenditures + HOA Fees | 36% | -$1,254 | -$15,046 |
Cash Flow
| Monthly | Yearly | |
|---|---|---|
Net Operating Income (NOI)The income generated from a property after deducting all operating expenses but before deducting mortgage payments, taxes, and capital expenditures. Calculation:Gross Operating Income - Operating Expenses
Net operating income:
| $2,036 | $24,432 |
Mortgage PaymentThe fixed amount a borrower pays each month to repay a loan. It typically includes principal and interest (P&I) and may also cover property taxes, insurance, HOA fees, and PMI if escrowed. | -$66,016 | -$792,192 |
Cash FlowNet Operating Income (NOI) minus mortgage payments. Calculation:NOI - Mortgage Payments | -$63,980 | -$767,760 |