$1,575,000
Investment Summary
- Monthly Cash Flow
- -$3,617
- Cap Rate
- 3.4%
- Cash-on-Cash Return
- -12.0%
- Debt Coverage Ratio
- 0.55
- Internal Rate of Return (5 years)
- -7.6%
Cash Flow
Net Operating Income (NOI) minus mortgage payments.
Calculation:
NOI - Mortgage Payments
Cap Rate (Market Value)
Capitalization Rate is a rate of return that compares the yearly Net Operating Income (NOI) to the market value.
Calculation:
NOI / Market Value
Cash-on-Cash Return (CoC)
Annual Cash Flow / Cash Invested
Calculation:
Annual cash flow divided by initial cash invested.
Debt Coverage Ratio (DCR)
Net Operating Income (NOI) divided by total debt payments.
Calculation:
NOI / Total Debt Payments
Internal Rate of Return (IRR)
A metric for assessing profitability over time. IRR is the discount rate at which the net present value (NPV) of all future cash flows (positive and negative) from an investment equals zero — including both periodic cash flow (such as rent) and a projected sale at the end of the holding period. It represents the expected annualized return, accounting for income, expenses, and the recovery of capital through a future sale.
Property Description
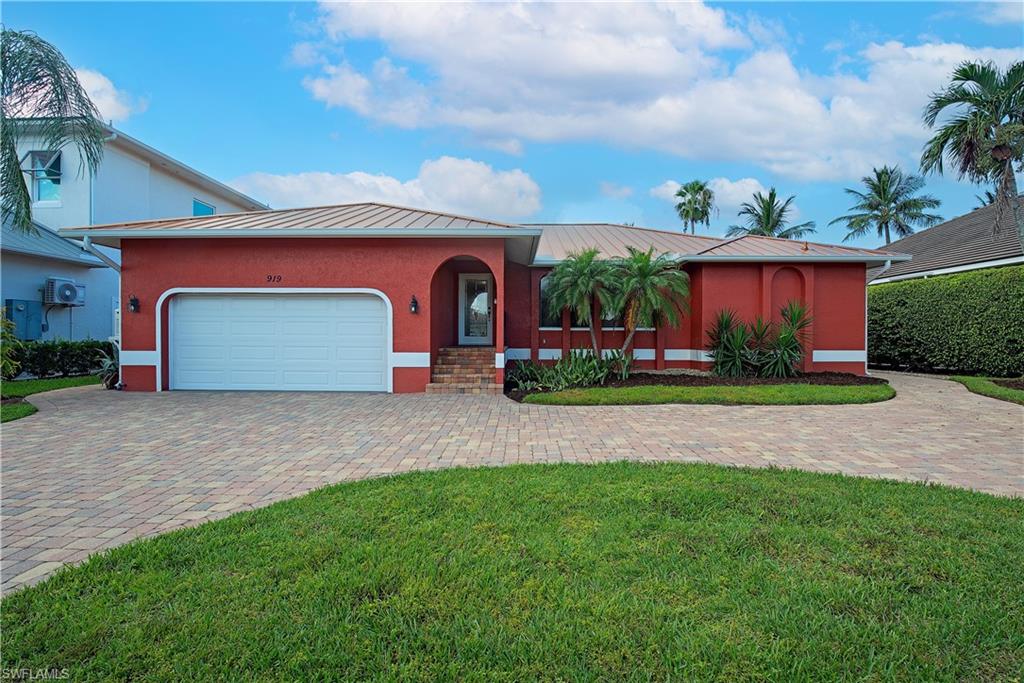
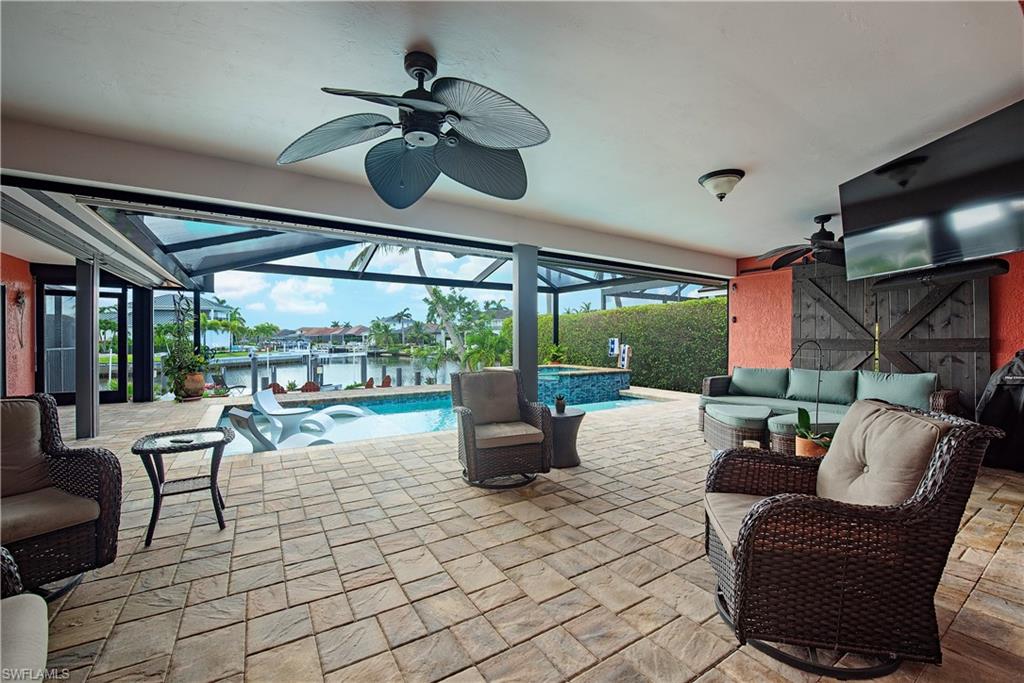
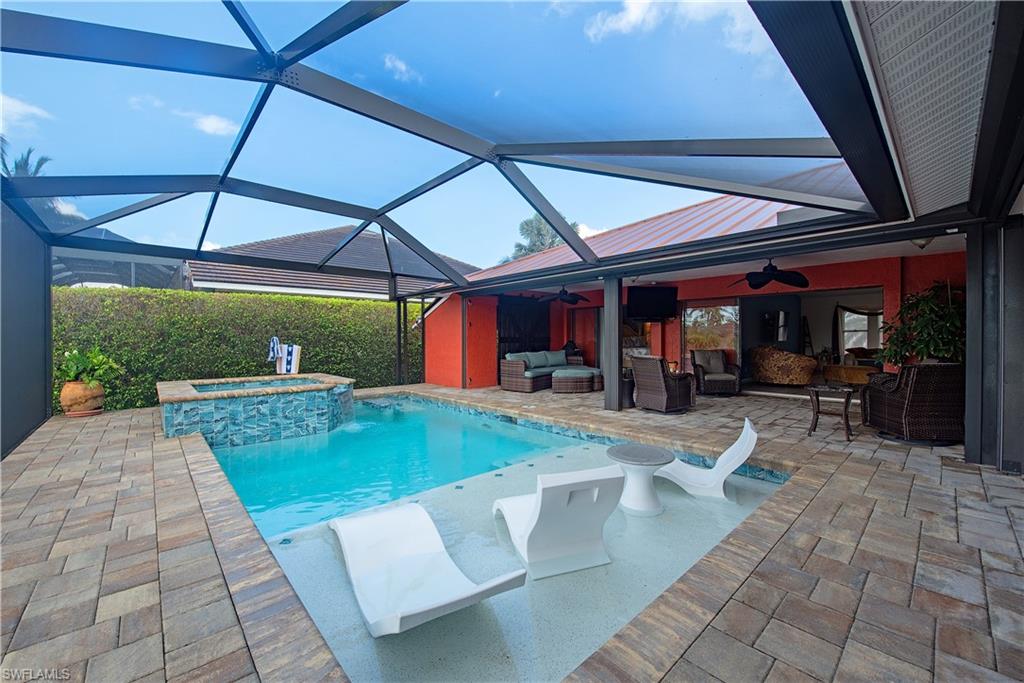
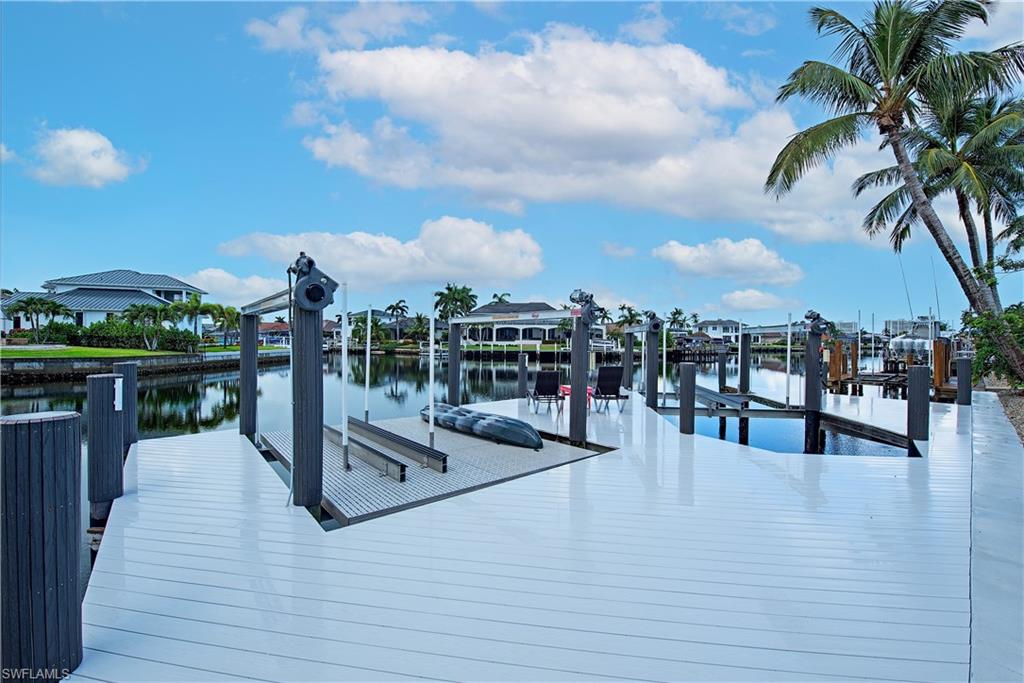
Welcome home to one of Marco Island's best-kept secrets — a sun-soaked, move-in-ready waterfront retreat offering the perfect blend of comfort, privacy, and island charm. This lovingly remodeled (2015) 2-bedroom + flex space, 3-bath home is ready just in time for seasonal living or year-round enjoyment. With its southern exposure, wide-water views at the convergence of canals, and dolphins and manatees as your daily neighbors, this home invites you to slow down and savor the natural beauty of coastal life. Tucked on a quiet street just 2 miles from the beach and walking distance to restaurants, shops, parks, and the seasonal weekly farmers market, the location offers a welcoming entry into a tight-knit, no-HOA community where friendliness is the local currency and every sunset feels like a private show. Inside, the home features a freshly painted interior (ceilings, walls, and trim) and a light-filled open-concept layout designed for effortless living and entertaining. The kitchen includes a breakfast bar that flows into the spacious great room, perfect for morning coffee or evening wine with friends. You'll find: • A private guest suite with its own ensuite bath • A flex space ideal for a home office or 3rd sleeping space • A full pool bath/laundry room that's also connected to the owner's suite The primary bedroom includes a custom walk-in closet with a built-in island (8 full-size drawers + 4 smaller drawers), making dressers optional. The ensuite bath features a bidet and walk-in shower for spa-like ease. Outdoors, this home is a true oasis: Heated pool + spa with multi-color LED lighting controlled via aqualink, 3-piece in-pool Ledge Lounger furniture included, New picture window lanai screens + 15' x 30' covered space, Separate room off lanai for storing pool and fishing gear, 20' x 30' paved patio overlooking the water for dining, lounging, or stargazing, Private dock with 2 remote-control lifts: • 14,000 lb boat lift • 7,000 lb jet ski/kayak lift, 80-foot seawall, underwater lights, and your own artificial reef. The home is equipped with high-end upgrades to make life easy and secure: • Whole-home generator (500-gallon propane tank, full at closing) • Metal roof and Storm Smart screen for lanai protection • Ring cameras front and back • 2-car garage with app controlled garage door opener, epoxy floors, auto-lift storage, and adjustable shelving, • Circular driveway for easy guest access Personal touches add charm: • Mango and fig trees ready for harvest • A rare staghorn fern, a living sculpture that thrives without soil • Unique mailbox and turtle yard art that bring a bit of whimsy to your curb appeal. Whether you're seeking a full-time residence, seasonal retreat, or a luxury rental opportunity, this home is ready to welcome you — just in time for the coming season.
Build Your Team
Quickly find investor-friendly professionals who can help you succeed in real estate investing at any stage of the investing journey.


Agents
Match with investor-friendly agents who can help you find, analyze, and close your next deal


Lenders
Get the best funding…find investor-friendly lenders who specialize in your deal strategy


Property Managers
Transition to passive investing. Find a trusted property management partnership that lasts.


Tax Pros & Accountants
Taxes and financial reporting made easy—find experts to create tax savings strategies, file taxes, and more
Location
Property Details
Parking
- Details: Garage Door Opener, Paved, Circular Driveway, Attached
- Garage Spaces: 2
- Spaces Total: 2
Bedroom Information
- # of Bedrooms: 2
Bathroom Information
- # of Baths (Full): 3
- # of Baths (Total): 3.0
Interior Features
- # of Rooms: 3
- # of Stories: 1
Exterior Features
- Roof Material: Metal
- Pool: Yes
Land Information
- Land Use: Residential
- Land Use Subtype: Single Family Residential
Lot Information
- Parcel ID: 57397480001
- Lot Size: 9583 sqft
Property Information
- Property Type: Single Family Residence
- Style: Ranch, Single Family
- Year Built: 1987
Tax Information
- Annual Tax: $12,824
Utilities
- Heating: Central, Electric
- Cooling: Ceiling Fan(s)
Location
- County: Collier
Listing Details
Investment Summary
- Monthly Cash Flow
- -$3,617
- Cap Rate
- 3.4%
- Cash-on-Cash Return
- -12.0%
- Debt Coverage Ratio
- 0.55
- Internal Rate of Return (5 years)
- -7.6%
Cash Flow
Net Operating Income (NOI) minus mortgage payments.
Calculation:
NOI - Mortgage Payments
Cap Rate (Market Value)
Capitalization Rate is a rate of return that compares the yearly Net Operating Income (NOI) to the market value.
Calculation:
NOI / Market Value
Cash-on-Cash Return (CoC)
Annual Cash Flow / Cash Invested
Calculation:
Annual cash flow divided by initial cash invested.
Debt Coverage Ratio (DCR)
Net Operating Income (NOI) divided by total debt payments.
Calculation:
NOI / Total Debt Payments
Internal Rate of Return (IRR)
A metric for assessing profitability over time. IRR is the discount rate at which the net present value (NPV) of all future cash flows (positive and negative) from an investment equals zero — including both periodic cash flow (such as rent) and a projected sale at the end of the holding period. It represents the expected annualized return, accounting for income, expenses, and the recovery of capital through a future sale.
Purchase Details
Purchase PriceThe price paid for the property. Purchase price:
| $1,575,000 |
|---|---|
Amount FinancedThe amount of the purchase financed through a loan. Amount financed:
| -$1,260,000 |
Down paymentThe initial payment made towards the purchase. Down payment:
| $315,000 |
Closing CostsFees and expenses associated with purchasing a property, typically ranging from 2% to 5% of the home’s purchase price, paid at the end of a home purchase to cover services like lending, title transfer, and taxes. Closing costs:
| $47,250 |
Rehab CostsCosts incurred to repair or improve the property, including: roof, flooring, exterior siding, kitchen, exterior paint, bathrooms, etc. Rehab costs:
| $0 |
Initial Cash InvestedThe total initial cash invested in the property. Calculation:Down payment + Buying costs + Rehab costs Initial cash invested:
| $362,250 |
Square Feet (SQFT)The total square footage of the property. Square feet:
| 2,175 |
Cost Per Square FootCost per square foot of the property. Calculation:Purchase Price / Square Feet Cost per square foot:
| $724 |
Monthly Rent Per Square FootMonthly rent divided by the number of square feet. This ratio helps investors compare rental income efficiency across properties, markets, and unit sizes Calculation:Monthly Rent / Square Feet Monthly rent per square foot:
| $3.68 |
Financing Details
Loan AmountThe total sum of money borrowed from a lender to finance a property purchase. Calculation:Purchase Price - Down Payment
Loan amount:
| $1,260,000 |
|---|---|
Loan to Value Ratio (LTV)Loan amount divided by the market value of the property. Calculation:Loan Amount / Market Value
Loan to value ratio:
| 80.0% |
Loan TypeThe type of loan (e.g., fixed, adjustable).
Loan type:
| Amortizing |
TermThe loan repayment period in years.
Term:
| 30 years |
Interest RateThe percentage a lender charges on the borrowed amount of a loan, determining the cost of borrowing money.
Interest rate:
| 6.625% |
Principal & Interest (PI)The principal is the portion of the loan payment that reduces the loan balance. The interest is the lender's charge for borrowing money. Calculation:(P * r * (1 + r) ** n) / ((1 + r) ** n - 1) Where:
P = Loan amount (principal)
Principal & interest:
| $8,068 |
Property TaxesAnnual taxes levied by local governments on real estate properties. These taxes fund public services like schools, roads, and emergency services.
Property tax:
| $1,069 |
InsuranceThe costs for insurance coverage to protect against financial losses due to risks like fire, natural disasters, theft, liability, or tenant-related damages. Calculation:Assumes 7% of gross rental income, unless insurance rates are specified.
Insurance:
| $560 |
Private Mortgage Insurance (PMI)A fee that borrowers pay when they take out a conventional loan with a loan-to-value (LTV) ratio above 80%.
Private mortgage insurance (PMI):
| $0 |
Monthly PaymentThe fixed amount a borrower pays each month to repay a loan. It typically includes principal and interest (P&I) and may also cover property taxes, insurance, HOA fees, and PMI if escrowed. Monthly payment:
| $9,697 |
Operating Income
| % Rent | Monthly | Yearly | |
|---|---|---|---|
Gross RentThe total rental income received from tenants before deducting any expenses. Includes base rent, late fees, pet fees, parking fees, and other recurring charges.
Gross rent:
| $8,000 | $96,000 | |
Vacancy LossExpected loss of rent due to vacancies.
Vacancy loss:
(6%)
| 6% | -$480 | -$5,760 |
Operating IncomeGross rental income minus vacancy loss. Calculation:Gross rent - Vacancy loss
Operating income:
| $7,520 | $90,240 |
Operating Expenses
| % Rent | Monthly | Yearly | |
|---|---|---|---|
Property TaxesAnnual taxes levied by local governments on real estate properties. These taxes fund public services like schools, roads, and emergency services. | 13% | -$1,069 | -$12,825 |
InsuranceThe costs for insurance coverage to protect against financial losses due to risks like fire, natural disasters, theft, liability, or tenant-related damages. Calculation:Assumes 7% of gross rental income, unless insurance rates are specified. | 7% | -$560 | -$6,720 |
Property ManagementThe costs associated with hiring a property manager to handle the day-to-day operations of a rental property. Includes management fees, leasing fes, eviction fees, etc. Calculation:Assumes 8% of gross rental income. | 8% | -$640 | -$7,680 |
Repairs & MaintenanceOngoing costs for routine upkeep and minor fixes needed to keep a property in good working condition. Calculation:Assumes 5% of gross rental income. Varies by property age and condition. | 5% | -$400 | -$4,800 |
Capital ExpensesLarge, infrequent costs for major improvements or replacements, like a new roof, HVAC system, or appliances. Calculation:Assumes 5% of gross rental income. Varies by property age. | 5% | -$400 | -$4,800 |
HOA FeesRegular dues paid to a Homeowners Association for community maintenance, amenities, and management. Similar fees include: Condo Association Fees, Co-op Maintenance Fees, etc. | n/a | n/a | n/a |
Operating ExpensesRecurring costs required to maintain and manage a rental property, including property taxes, insurance, maintenance, repairs, utilities (if paid by the owner), property management fees, and other day-to-day expenses. Calculation:Insurance + Property Taxes + Property Management + Repairs & Maintenance + Capital Expenditures + HOA Fees | 38% | -$3,069 | -$36,825 |
Cash Flow
| Monthly | Yearly | |
|---|---|---|
Net Operating Income (NOI)The income generated from a property after deducting all operating expenses but before deducting mortgage payments, taxes, and capital expenditures. Calculation:Gross Operating Income - Operating Expenses
Net operating income:
| $4,451 | $53,412 |
Mortgage PaymentThe fixed amount a borrower pays each month to repay a loan. It typically includes principal and interest (P&I) and may also cover property taxes, insurance, HOA fees, and PMI if escrowed. | -$8,068 | -$96,816 |
Cash FlowNet Operating Income (NOI) minus mortgage payments. Calculation:NOI - Mortgage Payments | -$3,617 | -$43,404 |