

$4,175,000
Investment Summary
- Monthly Cash Flow
- -$18,663
- Cap Rate
- 0.8%
- Cash-on-Cash Return
- -23.3%
- Debt Coverage Ratio
- 0.13
- Internal Rate of Return (5 years)
- -18.5%
Cash Flow
Net Operating Income (NOI) minus mortgage payments.
Calculation:
NOI - Mortgage Payments
Cap Rate (Market Value)
Capitalization Rate is a rate of return that compares the yearly Net Operating Income (NOI) to the market value.
Calculation:
NOI / Market Value
Cash-on-Cash Return (CoC)
Annual Cash Flow / Cash Invested
Calculation:
Annual cash flow divided by initial cash invested.
Debt Coverage Ratio (DCR)
Net Operating Income (NOI) divided by total debt payments.
Calculation:
NOI / Total Debt Payments
Internal Rate of Return (IRR)
A metric for assessing profitability over time. IRR is the discount rate at which the net present value (NPV) of all future cash flows (positive and negative) from an investment equals zero — including both periodic cash flow (such as rent) and a projected sale at the end of the holding period. It represents the expected annualized return, accounting for income, expenses, and the recovery of capital through a future sale.
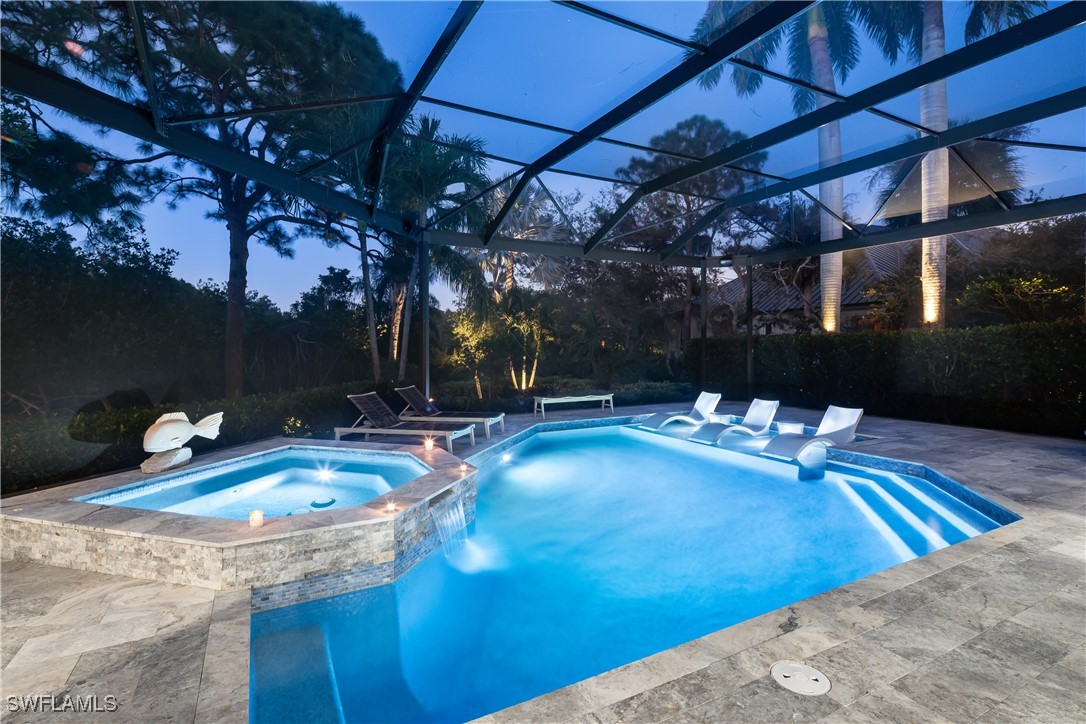
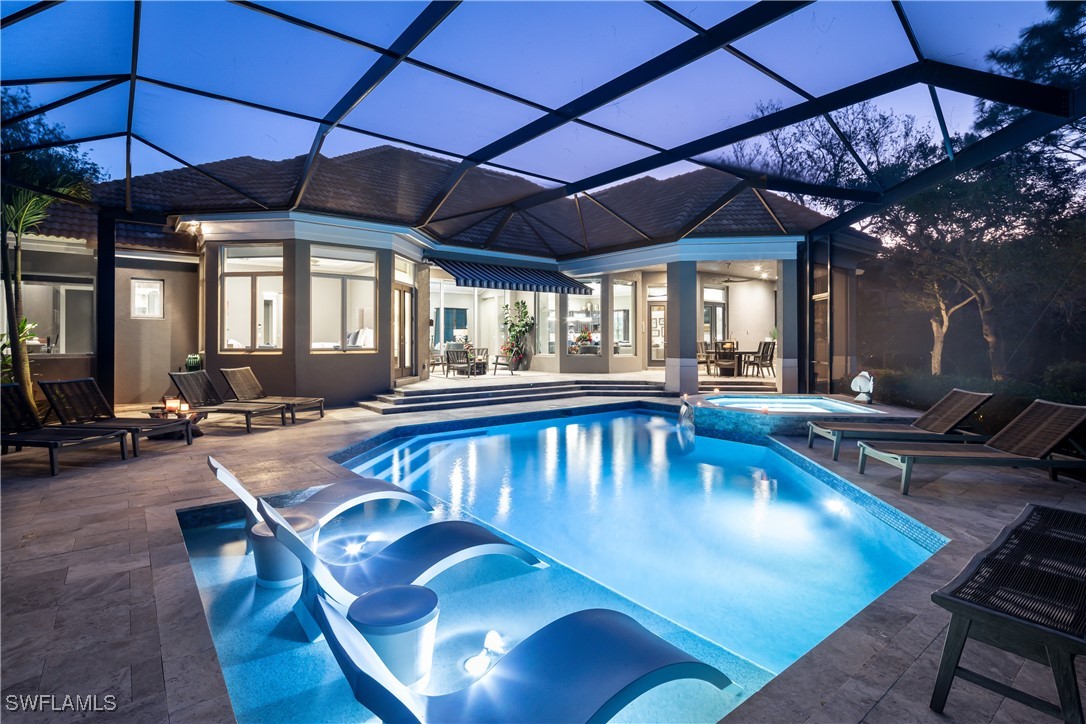
Property Description
Welcome to 927 Barcarmil Way. This dreamy single family home is tucked away in the tree lined drives of Colliers Reserve. 224 custom homes comprise this exclusive Golfing & Country club community awarded “The World’s First Audubon Signature Sanctuary Community”. Conveniently located just minutes from premier dining and world class shopping, championship golfing and the sparkling Vanderbilt Beach, this home is a rare find. This residence offers an A/C Garage and is over 4,400 sq ft under air and has been completely remodeled – interior & exterior, and has a plethora of customized features to suit. Four En Suite quarters have been thoughtfully created keeping comfort and privacy in the forefront. Many spacious walk-in closets and Five custom baths are unique to each suite. Detailed elements of marble, quartz, stone, wood, metal and glass combine throughout the home, a pleasing continuation of nature in these comfortable spaces. An upstairs suite features a private screened lanai and a lovely bonus space, well-lit and hidden from the main floor, it is a perfect work space, den or game area. Off the gracious and inviting family room, the custom kitchen is set with a stunningly sleek and modern design with specialty crafted cabinetry topped in gentle lighting and glass accents which oversee the cozy gathering spaces. Appealing stone countertops gleam along with the professional quality appliances – SubZero refrigeration, Thermidor gas burner stove with a griddle, wine cooler and expansive storage create ease and convenience. A wonderful vast marble island is the center piece. Two linear fireplaces, excellent lighting and sound create the perfect ambiance and warmth in the home. Enjoy sweeping lines both inside and out. Expansive wall of windows and sliding glass invite sumptuous comfortable spaces. Soaring well-lit ceilings flow into the spa like travertine lanai deck. Within the picture frame screening, enjoy falling water sounds from the spa and a newly enlarged pool with plenty of lounge areas and a fountained sun deck. The area also has a generous grill, beverage fridge, stone counters and quiet fans to enjoy your serene outdoor experience. Beyond the pool area stretches a decadent backyard space along the Cocahatchee River backwaters. Adventures await you with a private lighted boat dock with a cleaning station, perfect for a jet ski, kayak or small fishing craft. Awarded as one of “American’s Healthiest communities, a vast array of amenities are available – a fully remodeled clubhouse and 18 hole Arthur Hills championship golf course with pro shop, state-of-the-art fitness center and training staff, bocce ball courts, pickle ball courts, Har-Tru tennis courts, dog park, heated pools and fine dining! Come Enjoy!
Build Your Team
Quickly find investor-friendly professionals who can help you succeed in real estate investing at any stage of the investing journey.


Agents
Match with investor-friendly agents who can help you find, analyze, and close your next deal


Lenders
Get the best funding…find investor-friendly lenders who specialize in your deal strategy


Property Managers
Transition to passive investing. Find a trusted property management partnership that lasts.


Tax Pros & Accountants
Taxes and financial reporting made easy—find experts to create tax savings strategies, file taxes, and more
Location
Property Details
Parking
- Description: Garage
- Details: Attached, Garage, Golf Cart Garage, Garage Door Opener
- Garage Spaces: 3
- Spaces Total: 0
Bedroom Information
- # of Bedrooms: 4
Bathroom Information
- # of Baths (Full): 4
- # of Baths (Total): 5.0
Interior Features
- # of Rooms: 10
- # of Stories: 2
- Fireplace: Yes
Exterior Features
- Roof Material: Tile
- Pool: Yes
HOA
- Has HOA: Yes
- HOA Fee: $8,520/annually
Land Information
- Land Use: Residential
- Land Use Subtype: Single Family Residential
Lot Information
- Parcel ID: 27185007202
- Lot Size: 0 sqft
Property Information
- Property Type: Single Family Residence
- Style: Contemporary
- Year Built: 1996
Tax Information
- Annual Tax: $18,413
Utilities
- Water & Sewer: Public
- Heating: Central, Electric
- Cooling: Central Air, Ceiling Fan(s), Electric
Location
- County: Collier
Listing Details
Investment Summary
- Monthly Cash Flow
- -$18,663
- Cap Rate
- 0.8%
- Cash-on-Cash Return
- -23.3%
- Debt Coverage Ratio
- 0.13
- Internal Rate of Return (5 years)
- -18.5%
Cash Flow
Net Operating Income (NOI) minus mortgage payments.
Calculation:
NOI - Mortgage Payments
Cap Rate (Market Value)
Capitalization Rate is a rate of return that compares the yearly Net Operating Income (NOI) to the market value.
Calculation:
NOI / Market Value
Cash-on-Cash Return (CoC)
Annual Cash Flow / Cash Invested
Calculation:
Annual cash flow divided by initial cash invested.
Debt Coverage Ratio (DCR)
Net Operating Income (NOI) divided by total debt payments.
Calculation:
NOI / Total Debt Payments
Internal Rate of Return (IRR)
A metric for assessing profitability over time. IRR is the discount rate at which the net present value (NPV) of all future cash flows (positive and negative) from an investment equals zero — including both periodic cash flow (such as rent) and a projected sale at the end of the holding period. It represents the expected annualized return, accounting for income, expenses, and the recovery of capital through a future sale.
Purchase Details
Purchase PriceThe price paid for the property. Purchase price:
| $4,175,000 |
|---|---|
Amount FinancedThe amount of the purchase financed through a loan. Amount financed:
| -$3,340,000 |
Down paymentThe initial payment made towards the purchase. Down payment:
| $835,000 |
Closing CostsFees and expenses associated with purchasing a property, typically ranging from 2% to 5% of the home’s purchase price, paid at the end of a home purchase to cover services like lending, title transfer, and taxes. Closing costs:
| $125,250 |
Rehab CostsCosts incurred to repair or improve the property, including: roof, flooring, exterior siding, kitchen, exterior paint, bathrooms, etc. Rehab costs:
| $0 |
Initial Cash InvestedThe total initial cash invested in the property. Calculation:Down payment + Buying costs + Rehab costs Initial cash invested:
| $960,250 |
Square Feet (SQFT)The total square footage of the property. Square feet:
| 4,271 |
Cost Per Square FootCost per square foot of the property. Calculation:Purchase Price / Square Feet Cost per square foot:
| $978 |
Monthly Rent Per Square FootMonthly rent divided by the number of square feet. This ratio helps investors compare rental income efficiency across properties, markets, and unit sizes Calculation:Monthly Rent / Square Feet Monthly rent per square foot:
| $1.69 |
Financing Details
Loan AmountThe total sum of money borrowed from a lender to finance a property purchase. Calculation:Purchase Price - Down Payment
Loan amount:
| $3,340,000 |
|---|---|
Loan to Value Ratio (LTV)Loan amount divided by the market value of the property. Calculation:Loan Amount / Market Value
Loan to value ratio:
| 80.0% |
Loan TypeThe type of loan (e.g., fixed, adjustable).
Loan type:
| Amortizing |
TermThe loan repayment period in years.
Term:
| 30 years |
Interest RateThe percentage a lender charges on the borrowed amount of a loan, determining the cost of borrowing money.
Interest rate:
| 6.625% |
Principal & Interest (PI)The principal is the portion of the loan payment that reduces the loan balance. The interest is the lender's charge for borrowing money. Calculation:(P * r * (1 + r) ** n) / ((1 + r) ** n - 1) Where:
P = Loan amount (principal)
Principal & interest:
| $21,386 |
Property TaxesAnnual taxes levied by local governments on real estate properties. These taxes fund public services like schools, roads, and emergency services.
Property tax:
| $1,535 |
InsuranceThe costs for insurance coverage to protect against financial losses due to risks like fire, natural disasters, theft, liability, or tenant-related damages. Calculation:Assumes 7% of gross rental income, unless insurance rates are specified.
Insurance:
| $504 |
Private Mortgage Insurance (PMI)A fee that borrowers pay when they take out a conventional loan with a loan-to-value (LTV) ratio above 80%.
Private mortgage insurance (PMI):
| $0 |
Monthly PaymentThe fixed amount a borrower pays each month to repay a loan. It typically includes principal and interest (P&I) and may also cover property taxes, insurance, HOA fees, and PMI if escrowed. Monthly payment:
| $23,425 |
Operating Income
| % Rent | Monthly | Yearly | |
|---|---|---|---|
Gross RentThe total rental income received from tenants before deducting any expenses. Includes base rent, late fees, pet fees, parking fees, and other recurring charges.
Gross rent:
| $7,200 | $86,400 | |
Vacancy LossExpected loss of rent due to vacancies.
Vacancy loss:
(6%)
| 6% | -$432 | -$5,184 |
Operating IncomeGross rental income minus vacancy loss. Calculation:Gross rent - Vacancy loss
Operating income:
| $6,768 | $81,216 |
Operating Expenses
| % Rent | Monthly | Yearly | |
|---|---|---|---|
Property TaxesAnnual taxes levied by local governments on real estate properties. These taxes fund public services like schools, roads, and emergency services. | 21% | -$1,535 | -$18,414 |
InsuranceThe costs for insurance coverage to protect against financial losses due to risks like fire, natural disasters, theft, liability, or tenant-related damages. Calculation:Assumes 7% of gross rental income, unless insurance rates are specified. | 7% | -$504 | -$6,048 |
Property ManagementThe costs associated with hiring a property manager to handle the day-to-day operations of a rental property. Includes management fees, leasing fes, eviction fees, etc. Calculation:Assumes 8% of gross rental income. | 8% | -$576 | -$6,912 |
Repairs & MaintenanceOngoing costs for routine upkeep and minor fixes needed to keep a property in good working condition. Calculation:Assumes 5% of gross rental income. Varies by property age and condition. | 5% | -$360 | -$4,320 |
Capital ExpensesLarge, infrequent costs for major improvements or replacements, like a new roof, HVAC system, or appliances. Calculation:Assumes 5% of gross rental income. Varies by property age. | 5% | -$360 | -$4,320 |
HOA FeesRegular dues paid to a Homeowners Association for community maintenance, amenities, and management. Similar fees include: Condo Association Fees, Co-op Maintenance Fees, etc. | 10% | -$710 | -$8,520 |
Operating ExpensesRecurring costs required to maintain and manage a rental property, including property taxes, insurance, maintenance, repairs, utilities (if paid by the owner), property management fees, and other day-to-day expenses. Calculation:Insurance + Property Taxes + Property Management + Repairs & Maintenance + Capital Expenditures + HOA Fees | 56% | -$4,045 | -$48,534 |
Cash Flow
| Monthly | Yearly | |
|---|---|---|
Net Operating Income (NOI)The income generated from a property after deducting all operating expenses but before deducting mortgage payments, taxes, and capital expenditures. Calculation:Gross Operating Income - Operating Expenses
Net operating income:
| $2,723 | $32,676 |
Mortgage PaymentThe fixed amount a borrower pays each month to repay a loan. It typically includes principal and interest (P&I) and may also cover property taxes, insurance, HOA fees, and PMI if escrowed. | -$21,386 | -$256,632 |
Cash FlowNet Operating Income (NOI) minus mortgage payments. Calculation:NOI - Mortgage Payments | $18,663 | $223,956 |