$849,900
Investment Summary
- Monthly Cash Flow
- -$1,285
- Cap Rate
- 4.3%
- Cash-on-Cash Return
- -7.9%
- Debt Coverage Ratio
- 0.70
- Internal Rate of Return (5 years)
- -3.6%
Cash Flow
Net Operating Income (NOI) minus mortgage payments.
Calculation:
NOI - Mortgage Payments
Cap Rate (Market Value)
Capitalization Rate is a rate of return that compares the yearly Net Operating Income (NOI) to the market value.
Calculation:
NOI / Market Value
Cash-on-Cash Return (CoC)
Annual Cash Flow / Cash Invested
Calculation:
Annual cash flow divided by initial cash invested.
Debt Coverage Ratio (DCR)
Net Operating Income (NOI) divided by total debt payments.
Calculation:
NOI / Total Debt Payments
Internal Rate of Return (IRR)
A metric for assessing profitability over time. IRR is the discount rate at which the net present value (NPV) of all future cash flows (positive and negative) from an investment equals zero — including both periodic cash flow (such as rent) and a projected sale at the end of the holding period. It represents the expected annualized return, accounting for income, expenses, and the recovery of capital through a future sale.
Property Description
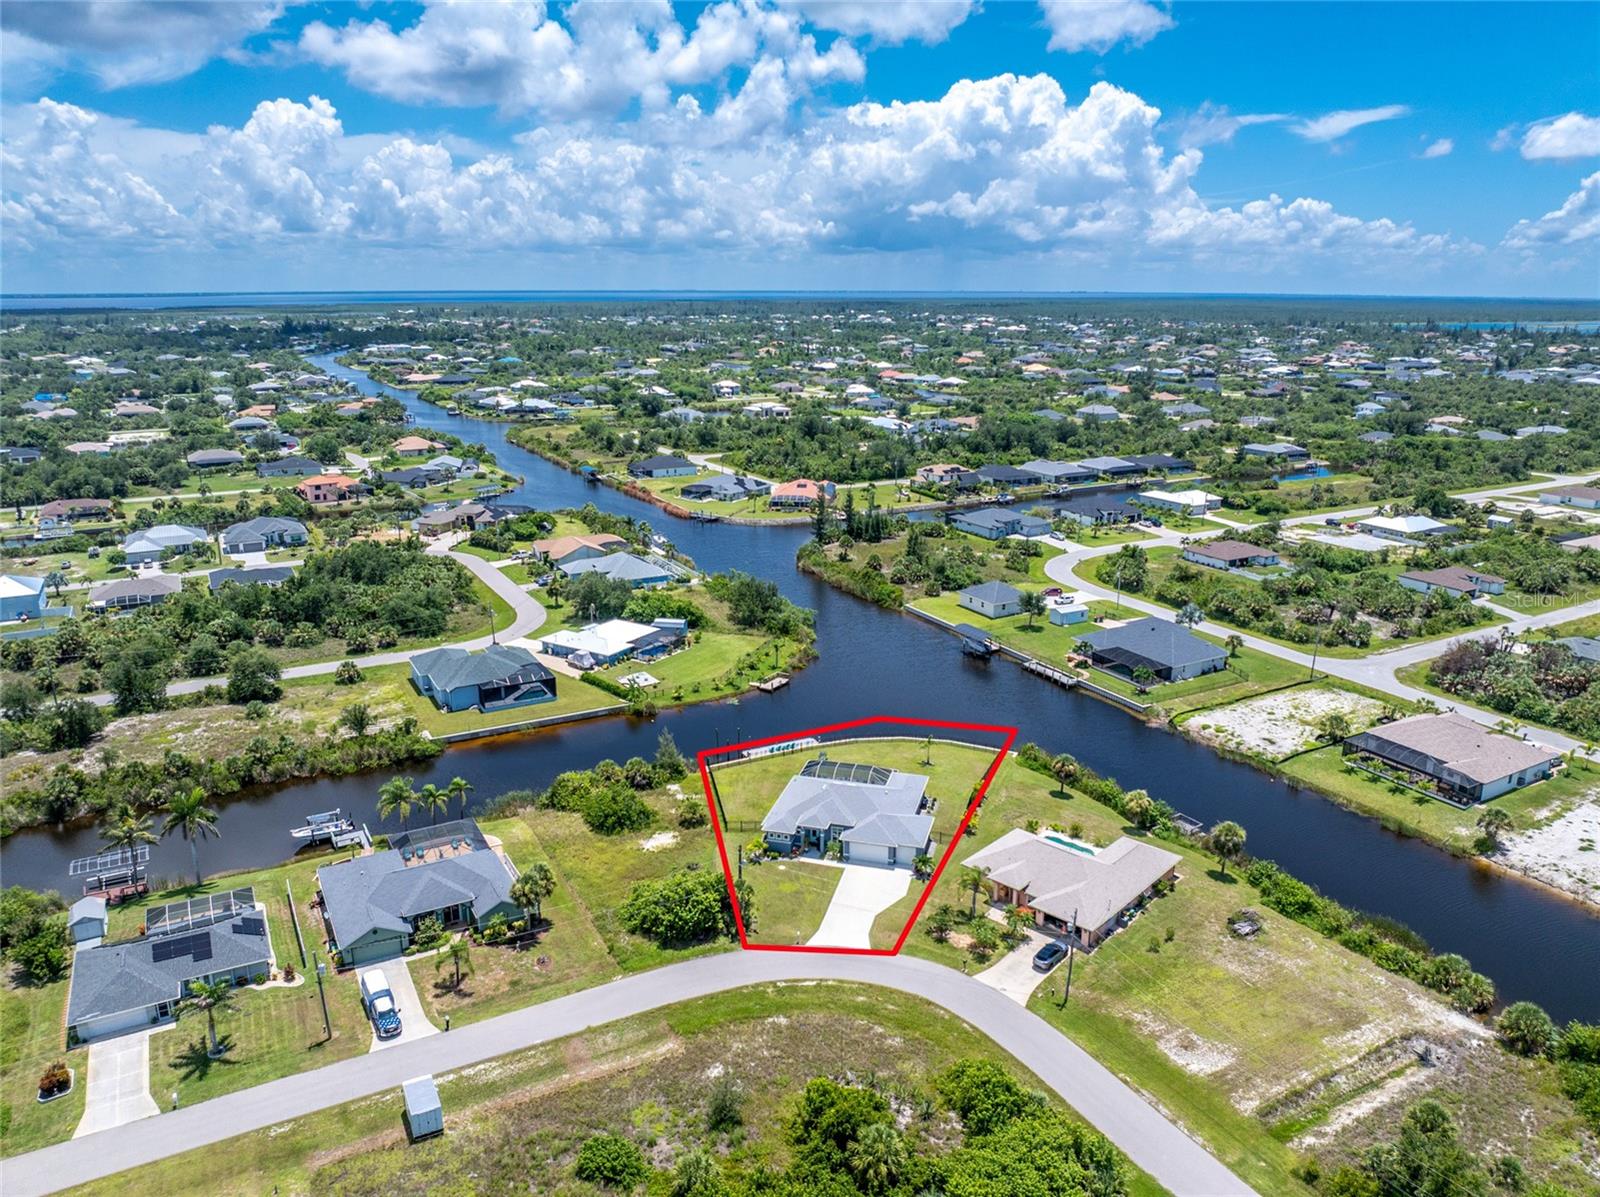
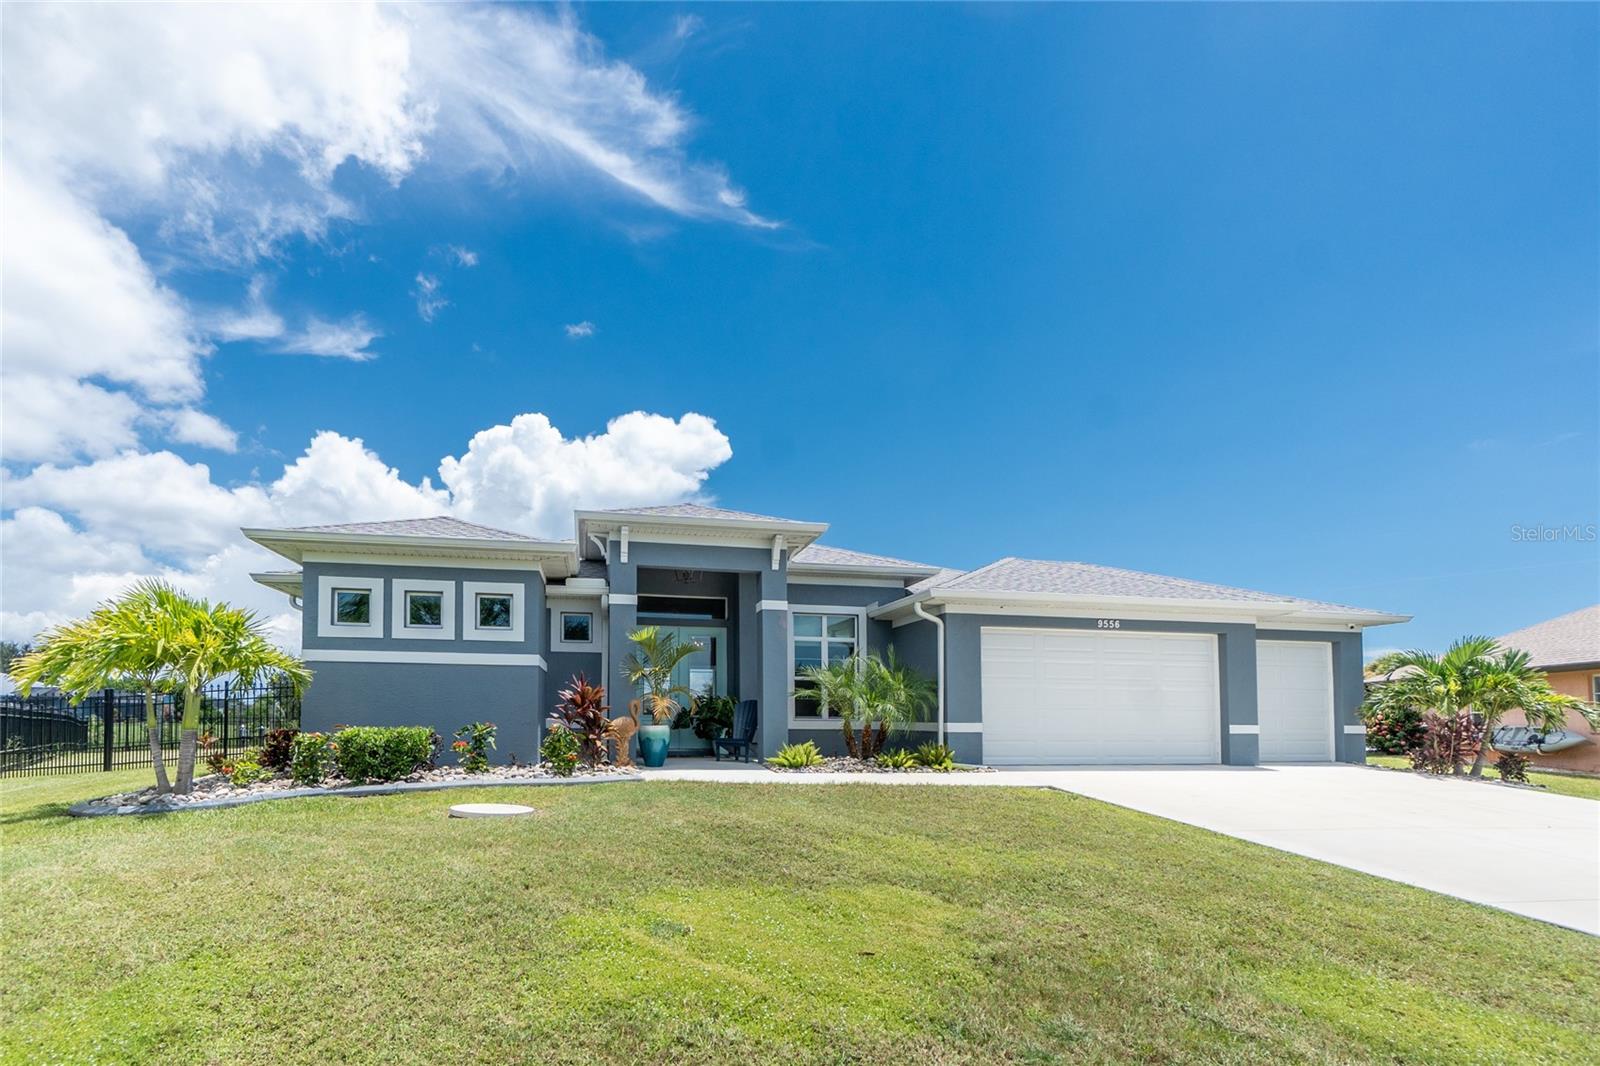
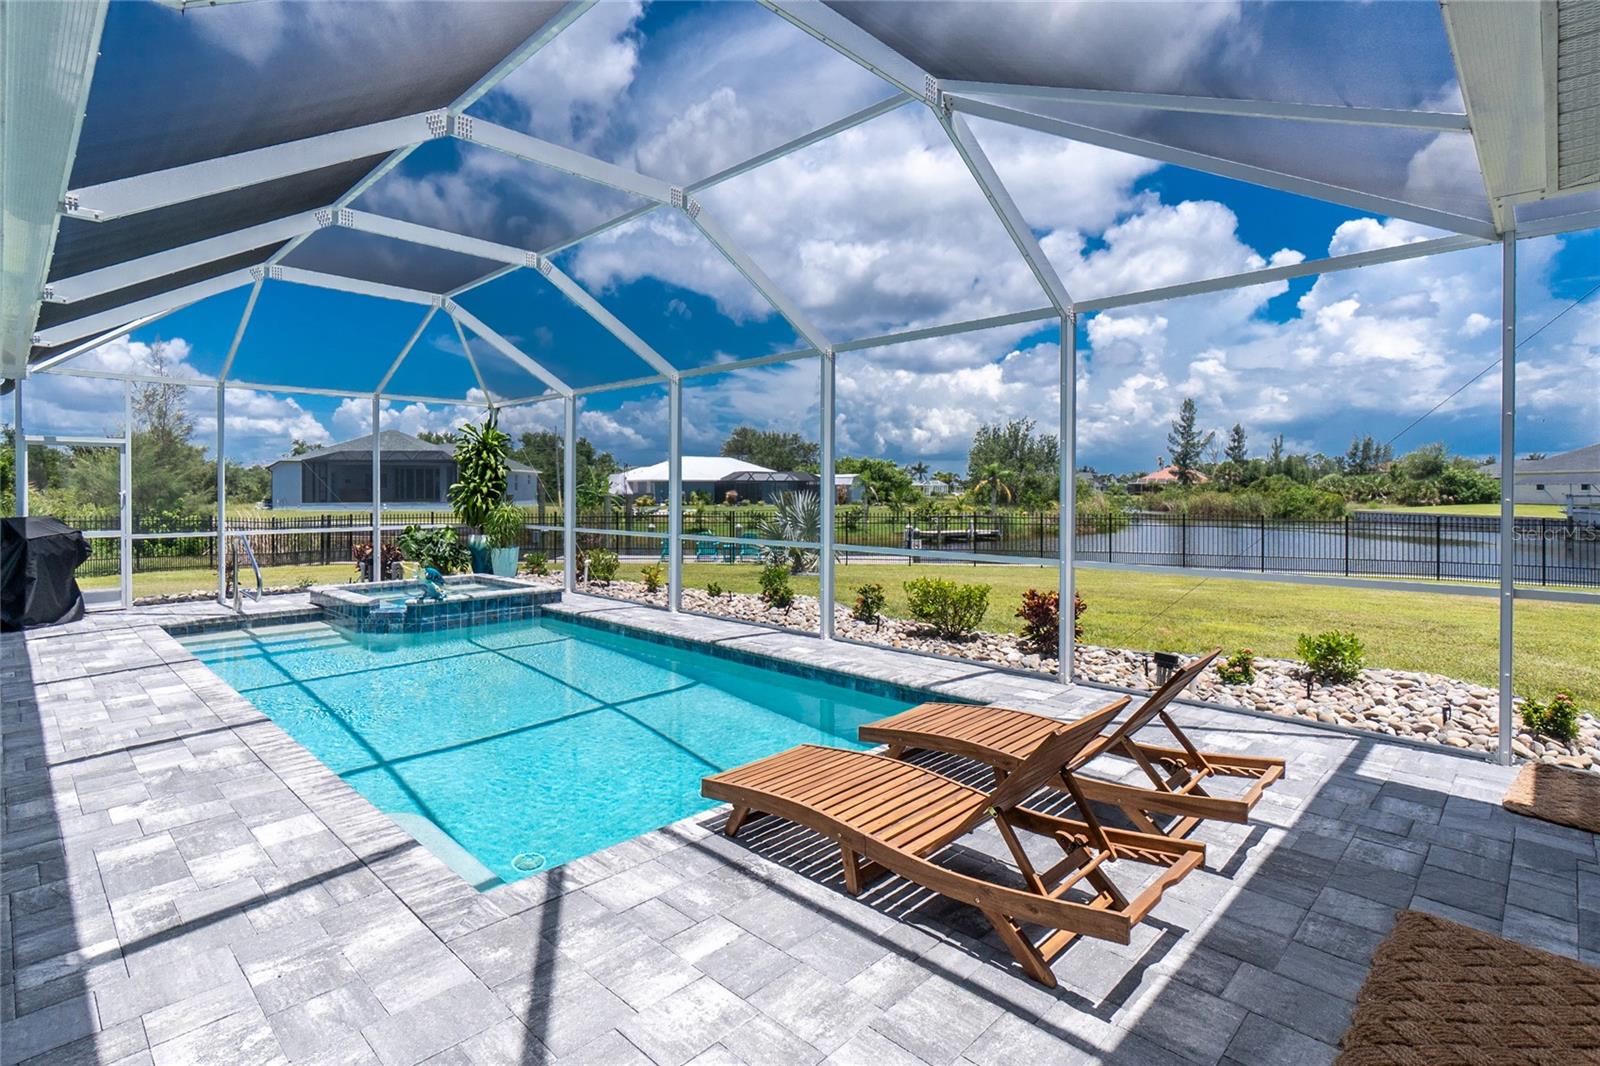
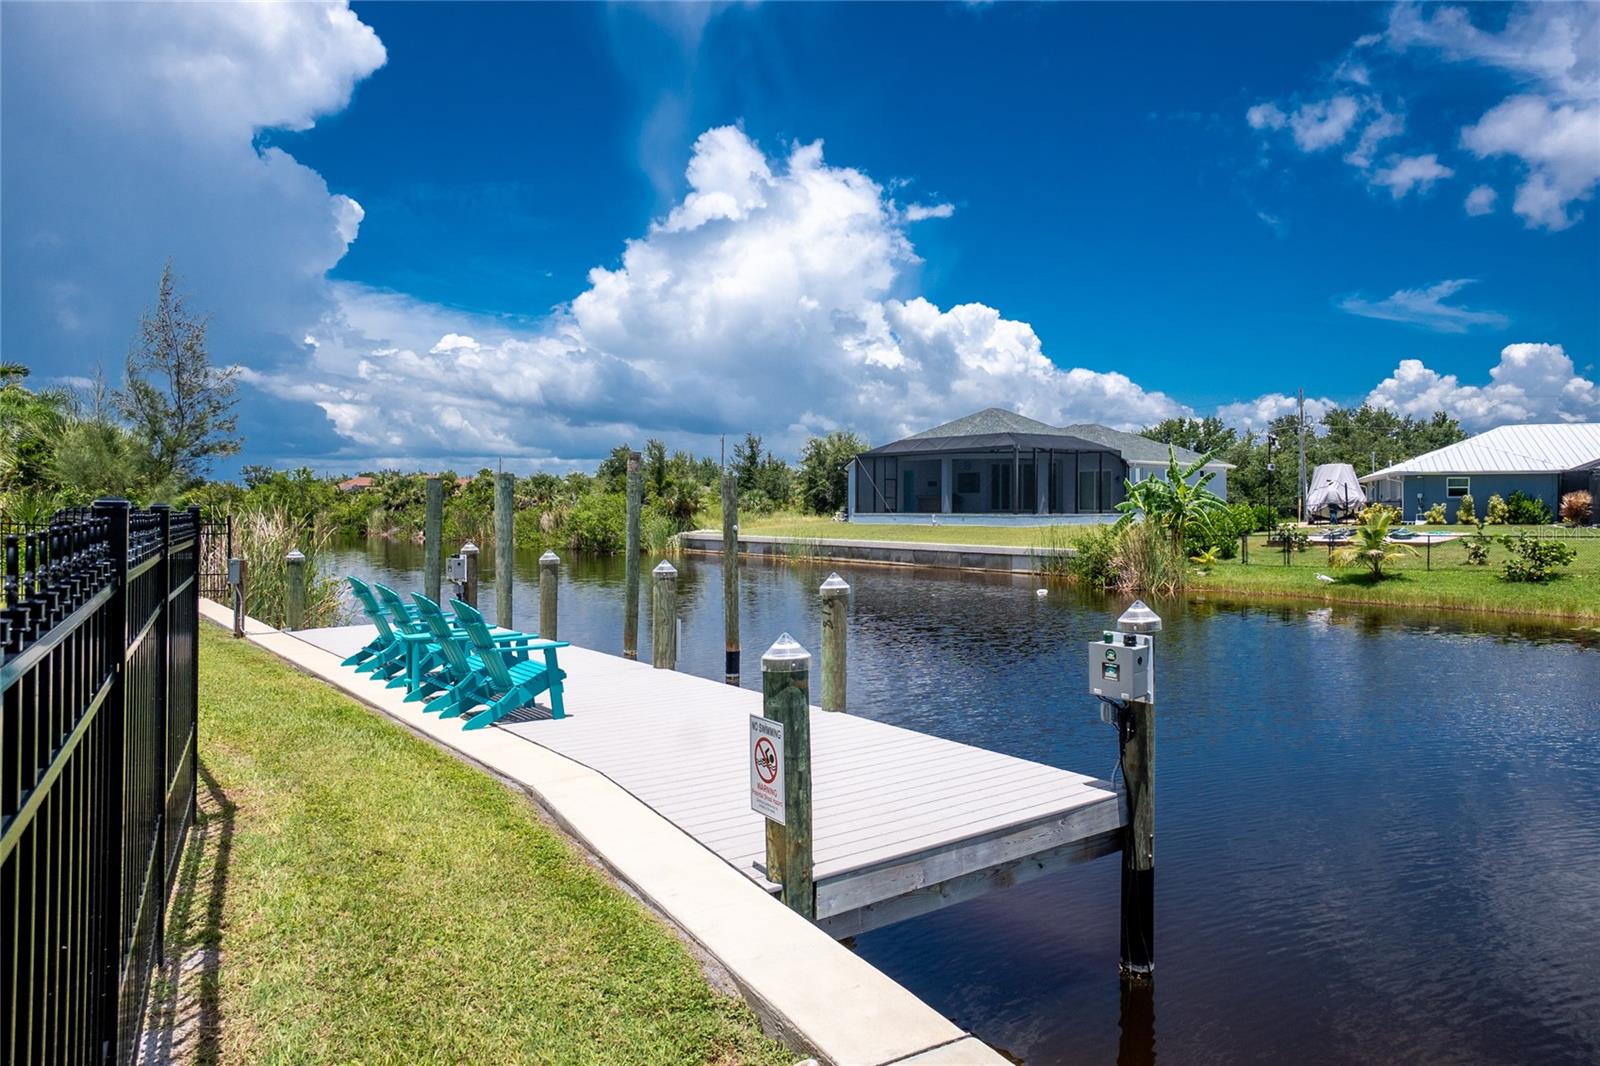
Live the Salt Life in This Boater’s Dream Pool Home in South Gulf Cove! This 2023 Quality Homes Tortuga Model features 3 bedrooms, 2 baths and a 3 car garage ensuring you have plenty of space for everyone. This incredible property offers 166 feet of water frontage where you can enjoy quick access to Charlotte Harbor and the Gulf for world-class fishing, relaxing on a sandbar or just having lunch on the waterfront! Outside you will find decorative accents and a double glass door entryway welcoming you to this designer styled home. Inside, you’ll love the coffered ceiling and wide open views of the pool and waterway beyond from the 8’ corner pocketing sliding glass doors. The open play layout is naturally light and bright with tall ceilings, stylish wood look tile floors, and tons of natural light throughout the home. The kitchen has everything you need for both entertaining and cooking including white shaker style cabinets, quartz counters, stainless steel appliances, a big center accent island, glass tile backsplash, and plenty of storage. Just off the kitchen is a great dining space with endless views of the pool and waterway. Just imagine enjoying your morning coffee with this scene as the backdrop. The primary suite feels like a private getaway with sliding doors to access the pool, double walk-in closets, a tray ceiling, and a luxurious bathroom with a huge fully tiled roman style walk-through shower and oversized lanai with double sinks. The spacious guest bedrooms both have reach in closets and one features sliders for pool access. The guest bathroom has a nicely tiled tub shower combo and just outside the door there is a convenient French door for easy pool use. You’ll love the split floor plan, giving guests their own space, and there’s a separate den with French doors that’s ideal for a home office or hobby room. The interior laundry room was well planned with cabinets and built-in utility sink. Step out to your own backyard paradise with a sparkling heated saltwater pool and spa, southern exposure for all-day sun, and a big screened lanai with brick pavers that’s perfect for entertaining. The waterfront has a composite dock with electric and green lights to attract the fish and is ready for your boat, jet ski, or kayak, and the lush landscaping with irrigation keeps everything looking great year-round. Impact windows, storm protection, black aluminum fenced backyard with privacy added via a vegetation wall, new landscaping rock, and upgraded fixtures, this home has all the extras. Tucked away in the quiet waterfront, HOA optional neighborhood of South Gulf Cove where you can join for a low fee and enjoy the many yearly activities, clubhouse and playground. There is also a public boat ramp nearby. Convenient to Boca Grande, Port Charlotte, Englewood, local marinas, beaches, restaurants, and golf, 9556 Galaxie is everything you’ve been looking for, and then some. Contact us today to schedule your private showing.
Build Your Team
Quickly find investor-friendly professionals who can help you succeed in real estate investing at any stage of the investing journey.


Agents
Match with investor-friendly agents who can help you find, analyze, and close your next deal


Lenders
Get the best funding…find investor-friendly lenders who specialize in your deal strategy


Property Managers
Transition to passive investing. Find a trusted property management partnership that lasts.


Tax Pros & Accountants
Taxes and financial reporting made easy—find experts to create tax savings strategies, file taxes, and more
Location
Property Details
Parking
- Description: Covered, Driveway, Garage Door Opener
- Details: Driveway, Garage Door Opener, Oversized, Attached
- Garage Spaces: 3
- Spaces Total: 0
Bedroom Information
- # of Bedrooms: 3
Bathroom Information
- # of Baths (Full): 2
- # of Baths (Total): 2.0
Interior Features
- # of Rooms: 11
- # of Stories: 1
Exterior Features
- Exterior Walls Materials: Composition/Composite
- Foundation: Slab
- Roof Material: Shingle
- Pool: Yes
HOA
- Association: South Gulf Cove HOA
Land Information
- Land Use: Residential
- Land Use Subtype: Single Family Residential
Lot Information
- Parcel ID: 412121453012
- Lot Size: 17958 sqft
Property Information
- Property Type: Single Family Residence
- Year Built: 2023
Tax Information
- Annual Tax: $11,199
Utilities
- Water & Sewer: Public
- Heating: Central, Electric
- Cooling: Central Air
Location
- County: Charlotte
Listing Details
Investment Summary
- Monthly Cash Flow
- -$1,285
- Cap Rate
- 4.3%
- Cash-on-Cash Return
- -7.9%
- Debt Coverage Ratio
- 0.70
- Internal Rate of Return (5 years)
- -3.6%
Cash Flow
Net Operating Income (NOI) minus mortgage payments.
Calculation:
NOI - Mortgage Payments
Cap Rate (Market Value)
Capitalization Rate is a rate of return that compares the yearly Net Operating Income (NOI) to the market value.
Calculation:
NOI / Market Value
Cash-on-Cash Return (CoC)
Annual Cash Flow / Cash Invested
Calculation:
Annual cash flow divided by initial cash invested.
Debt Coverage Ratio (DCR)
Net Operating Income (NOI) divided by total debt payments.
Calculation:
NOI / Total Debt Payments
Internal Rate of Return (IRR)
A metric for assessing profitability over time. IRR is the discount rate at which the net present value (NPV) of all future cash flows (positive and negative) from an investment equals zero — including both periodic cash flow (such as rent) and a projected sale at the end of the holding period. It represents the expected annualized return, accounting for income, expenses, and the recovery of capital through a future sale.
Purchase Details
Purchase PriceThe price paid for the property. Purchase price:
| $849,900 |
|---|---|
Amount FinancedThe amount of the purchase financed through a loan. Amount financed:
| -$679,920 |
Down paymentThe initial payment made towards the purchase. Down payment:
| $169,980 |
Closing CostsFees and expenses associated with purchasing a property, typically ranging from 2% to 5% of the home’s purchase price, paid at the end of a home purchase to cover services like lending, title transfer, and taxes. Closing costs:
| $25,497 |
Rehab CostsCosts incurred to repair or improve the property, including: roof, flooring, exterior siding, kitchen, exterior paint, bathrooms, etc. Rehab costs:
| $0 |
Initial Cash InvestedThe total initial cash invested in the property. Calculation:Down payment + Buying costs + Rehab costs Initial cash invested:
| $195,477 |
Square Feet (SQFT)The total square footage of the property. Square feet:
| 1,978 |
Cost Per Square FootCost per square foot of the property. Calculation:Purchase Price / Square Feet Cost per square foot:
| $430 |
Monthly Rent Per Square FootMonthly rent divided by the number of square feet. This ratio helps investors compare rental income efficiency across properties, markets, and unit sizes Calculation:Monthly Rent / Square Feet Monthly rent per square foot:
| $2.93 |
Financing Details
Loan AmountThe total sum of money borrowed from a lender to finance a property purchase. Calculation:Purchase Price - Down Payment
Loan amount:
| $679,920 |
|---|---|
Loan to Value Ratio (LTV)Loan amount divided by the market value of the property. Calculation:Loan Amount / Market Value
Loan to value ratio:
| 80.0% |
Loan TypeThe type of loan (e.g., fixed, adjustable).
Loan type:
| Amortizing |
TermThe loan repayment period in years.
Term:
| 30 years |
Interest RateThe percentage a lender charges on the borrowed amount of a loan, determining the cost of borrowing money.
Interest rate:
| 6.625% |
Principal & Interest (PI)The principal is the portion of the loan payment that reduces the loan balance. The interest is the lender's charge for borrowing money. Calculation:(P * r * (1 + r) ** n) / ((1 + r) ** n - 1) Where:
P = Loan amount (principal)
Principal & interest:
| $4,354 |
Property TaxesAnnual taxes levied by local governments on real estate properties. These taxes fund public services like schools, roads, and emergency services.
Property tax:
| $933 |
InsuranceThe costs for insurance coverage to protect against financial losses due to risks like fire, natural disasters, theft, liability, or tenant-related damages. Calculation:Assumes 7% of gross rental income, unless insurance rates are specified.
Insurance:
| $406 |
Private Mortgage Insurance (PMI)A fee that borrowers pay when they take out a conventional loan with a loan-to-value (LTV) ratio above 80%.
Private mortgage insurance (PMI):
| $0 |
Monthly PaymentThe fixed amount a borrower pays each month to repay a loan. It typically includes principal and interest (P&I) and may also cover property taxes, insurance, HOA fees, and PMI if escrowed. Monthly payment:
| $5,693 |
Operating Income
| % Rent | Monthly | Yearly | |
|---|---|---|---|
Gross RentThe total rental income received from tenants before deducting any expenses. Includes base rent, late fees, pet fees, parking fees, and other recurring charges.
Gross rent:
| $5,800 | $69,600 | |
Vacancy LossExpected loss of rent due to vacancies.
Vacancy loss:
(6%)
| 6% | -$348 | -$4,176 |
Operating IncomeGross rental income minus vacancy loss. Calculation:Gross rent - Vacancy loss
Operating income:
| $5,452 | $65,424 |
Operating Expenses
| % Rent | Monthly | Yearly | |
|---|---|---|---|
Property TaxesAnnual taxes levied by local governments on real estate properties. These taxes fund public services like schools, roads, and emergency services. | 16% | -$933 | -$11,200 |
InsuranceThe costs for insurance coverage to protect against financial losses due to risks like fire, natural disasters, theft, liability, or tenant-related damages. Calculation:Assumes 7% of gross rental income, unless insurance rates are specified. | 7% | -$406 | -$4,872 |
Property ManagementThe costs associated with hiring a property manager to handle the day-to-day operations of a rental property. Includes management fees, leasing fes, eviction fees, etc. Calculation:Assumes 8% of gross rental income. | 8% | -$464 | -$5,568 |
Repairs & MaintenanceOngoing costs for routine upkeep and minor fixes needed to keep a property in good working condition. Calculation:Assumes 5% of gross rental income. Varies by property age and condition. | 5% | -$290 | -$3,480 |
Capital ExpensesLarge, infrequent costs for major improvements or replacements, like a new roof, HVAC system, or appliances. Calculation:Assumes 5% of gross rental income. Varies by property age. | 5% | -$290 | -$3,480 |
HOA FeesRegular dues paid to a Homeowners Association for community maintenance, amenities, and management. Similar fees include: Condo Association Fees, Co-op Maintenance Fees, etc. | n/a | n/a | n/a |
Operating ExpensesRecurring costs required to maintain and manage a rental property, including property taxes, insurance, maintenance, repairs, utilities (if paid by the owner), property management fees, and other day-to-day expenses. Calculation:Insurance + Property Taxes + Property Management + Repairs & Maintenance + Capital Expenditures + HOA Fees | 41% | -$2,383 | -$28,600 |
Cash Flow
| Monthly | Yearly | |
|---|---|---|
Net Operating Income (NOI)The income generated from a property after deducting all operating expenses but before deducting mortgage payments, taxes, and capital expenditures. Calculation:Gross Operating Income - Operating Expenses
Net operating income:
| $3,069 | $36,828 |
Mortgage PaymentThe fixed amount a borrower pays each month to repay a loan. It typically includes principal and interest (P&I) and may also cover property taxes, insurance, HOA fees, and PMI if escrowed. | -$4,354 | -$52,248 |
Cash FlowNet Operating Income (NOI) minus mortgage payments. Calculation:NOI - Mortgage Payments | $1,285 | $15,420 |