


All Forum Posts by: Marius Olbrych
Marius Olbrych has started 18 posts and replied 19 times.
 Post: U.S. Housing & Palm Springs Area Market Outlook – August 2025
- Real Estate Agent
- Palm Desert, CA
- Posts 21
- Votes 4
@Aaron Zimmerman thank you!
Post: U.S. Housing & Palm Springs Area Market Outlook – August 2025
- Real Estate Agent
- Palm Desert, CA
- Posts 21
- Votes 4
National Trends, Local Opportunities, and Why the Coachella Valley Deserves a Closer Look
As of August 2025, the U.S. housing market is navigating a multi-layered shift. National indicators are sending mixed signals—rising foreclosures, falling mortgage rates, uneven inventory recovery—while local markets are revealing very different stories on the ground.
One of those local markets is the Coachella Valley (Palm Springs area), where I’m personally active as an investor and licensed agent. I’ve compiled this analysis to provide a snapshot of both the macro trends and how they’re playing out in our desert market.
National Snapshot: A Market in Transition
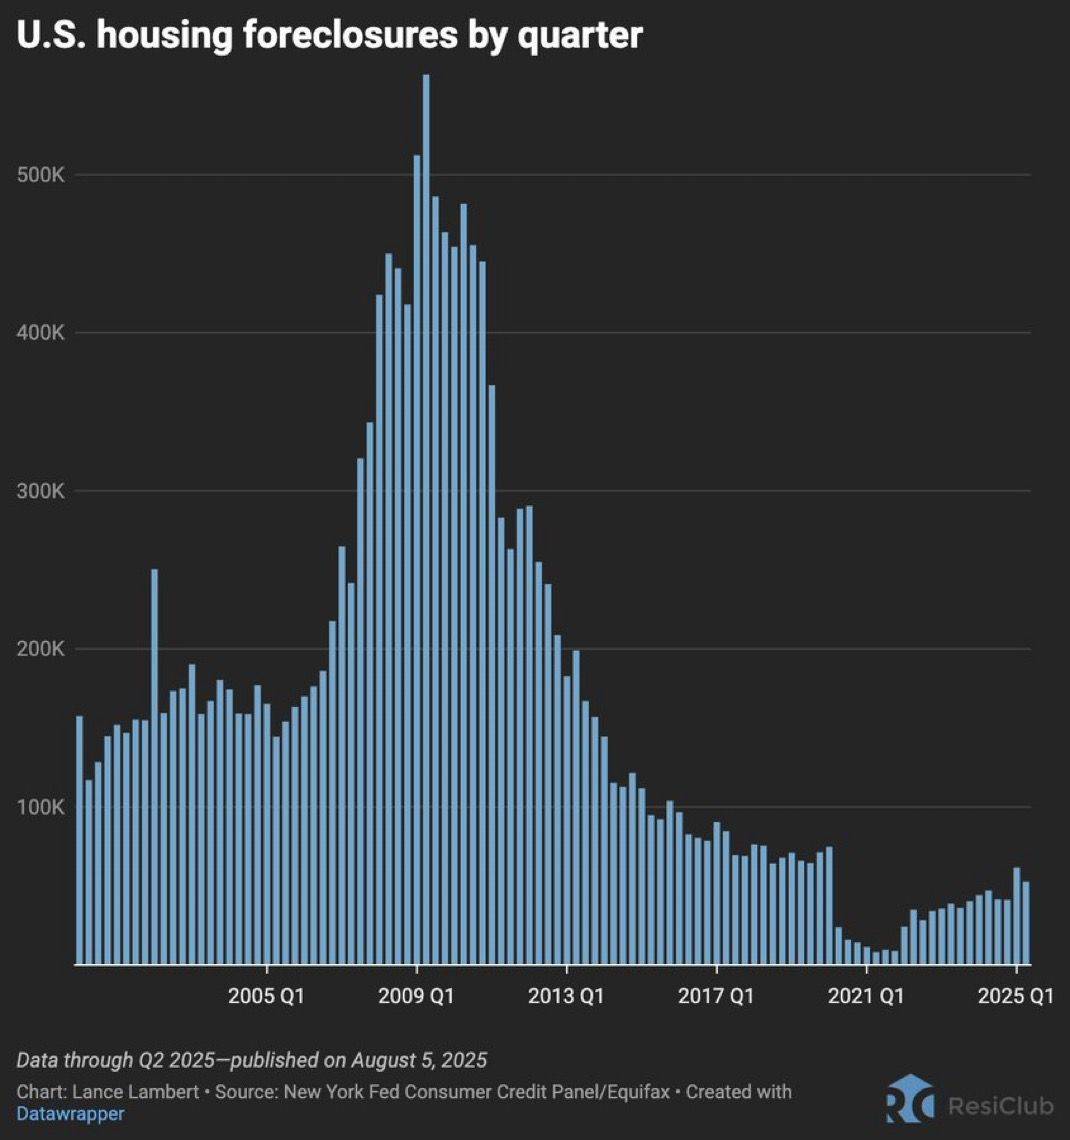
Foreclosures Are Increasing—But It’s Not 2008
Foreclosure activity has climbed steadily since 2021, now sitting at approximately 125,000 filings per quarter—more than double the lows seen a few years ago. That said, we’re still far from the crisis levels of 2008–2010 (which saw over 500,000 per quarter). The increase is more reflective of affordability pressure than systemic lending risk.
Mortgage Rates Falling, Fed Cut Expected
The 30-year fixed rate mortgage has dropped to just over 6.75%, the lowest level in the last four months. Analysts are projecting a 95% chance of a Fed rate cut in September, which may increase affordability further and bring more buyers off the sidelines.
Inventory Recovery Varies by Metro
Inventory is rebounding in some cities, while remaining tight in others. According to Realtor.com and ResiClub:
-
Up vs. 2019: Austin (+64%), Denver (+46%), Memphis (+48%)
-
Still Tight vs. 2019: New York (-46%), Los Angeles (-22%), Chicago (-60%)
Markets with growing inventory may begin to favor buyers again, especially if rates continue trending down. In low-supply metros, sellers still hold the edge—for now.
Coachella Valley (Palm Springs Area) Market Insights – July 2025
Drawing from the latest Greater Palm Springs Realtors (GPSR) report, here’s how the local numbers stack up:
Price Trends
-
Median Detached Home: $652,500 (down 1.9% YoY)
-
Median Attached Home (condos/townhomes): $450,000 (down 1.7%)
Prices remain relatively stable despite seasonal fluctuations and rising inventory. Pandemic-era gains have largely held across most cities in the valley.
Inventory & Time on Market
-
Total Inventory: 2,961 homes (up 30.7% YoY)
-
Median Days on Market: 56 days (up 9 days YoY)
-
Fastest-Selling Cities: Coachella (40 days), Bermuda Dunes (42 days)
We’re now near pre-pandemic inventory levels. This is giving buyers a bit more room to negotiate—especially on properties that need upgrades or aren’t priced strategically.
Sale Price Discounts
-
Detached Homes: Average sale is 2.9% below list
-
Attached Homes: 3.6% below list
-
Only 10.2% of homes sold over asking, down from 14.8% a year ago
We’re seeing a return to more normalized pricing behavior, and sellers are becoming increasingly open to negotiation, especially in segments with higher DOM.
City-Level Market Activity
-
Top Sales Volume: Palm Springs (128 units), Palm Desert (125), La Quinta (93)
-
Highest Inventory: Palm Springs (661), Palm Desert (620)
-
Dollar Volume Leaders: Palm Springs, La Quinta, Palm Desert
Markets like Palm Springs and La Quinta remain highly active, while smaller cities like Coachella and Cathedral City are showing improved affordability and faster selling times.
Why the Coachella Valley May Be a Value Play in Late 2025
Here’s why I believe the Coachella Valley is a market to watch for both local and out-of-area investors:
-
Inventory is back, but buyer demand hasn’t fully returned—creating room to negotiate
-
Many homes under $700K now qualify for value-add strategies like BRRRR, mid-term rentals, or layout optimization
-
Rental demand remains strong, especially in Palm Springs, Indio, Cathedral City, and La Quinta
-
Average discounts of ~3% below list provide a better entry point than in 2021–2022
If you're investing for cash flow, there are opportunities here—especially if you're comfortable taking on light to moderate renovations or repositioning properties for higher use (e.g., ADU conversion, mid-term rental setups, etc.).
Final Thoughts
We’re not in a crash, but we are in a moment of market recalibration. Rates are trending favorably, inventory is shifting, and sellers in many metros—including here in the desert—are more negotiable than they’ve been in years.
From a risk/reward standpoint, I think markets like Coachella Valley offer a balanced entry point—especially for investors who missed the last wave or are targeting 6–12 month BRRRR cycles.
Would love to hear from other investors across SoCal and beyond—what are you seeing in your submarkets? Are seller expectations starting to bend? Are buyers coming off the sidelines?
Disclosure: I’m a real estate investor and licensed agent based in Palm Springs. I work with other investors in this market and wrote this article based on publicly available data (GPSR, Realtor.com, BLS, FedWatch, etc.). This post is for educational purposes and community discussion only.
Post: Unwarrantable Condo Deal: DSCR Loan, STR-Approved, and Still Cash-Flowing
- Real Estate Agent
- Palm Desert, CA
- Posts 21
- Votes 4
Wanted to share a recent investor case study that might be helpful for others evaluating short-term rental (STR) markets or dealing with financing challenges on non-traditional properties.
We recently supported a buyer who closed on an unwarrantable condo in the Palm Springs area. The property isn't eligible for conventional financing due to HOA and occupancy ratios, but here's what made it work:
🔹 DSCR loan was used — no tax returns required
🔹 7-day STRs permitted by the HOA
🔹 Closed $10K under appraised value
🔹 Fully financed, and still cash-flowing from day one
The buyer was doing a 1031 exchange and wanted a turnkey rental that could hold up even if short-term rental regulations shifted. This one penciled out with long-term potential due to its location and rental flexibility.
Lessons learned:
-
DSCR loans are powerful tools when conventional isn't an option, especially for non-warrantable assets.
-
Underwriting still allowed this to cash flow based on projected rental income.
-
Getting something under appraisal and financed fully is still possible — even in this market — if you’re looking in the right pockets.
Has anyone else worked with unwarrantable condos or similar niche assets in resort markets? Curious how others are structuring deals like this or planning for STR regulation changes.
Looking forward to your thoughts and strategies.
Post: May 2025 Coachella Valley Market Forecast
- Real Estate Agent
- Palm Desert, CA
- Posts 21
- Votes 4
May 2025 Coachella Valley Market Forecast
Market Insight – Based on April 2025 Data
Market Momentum Shifts — Inventory Is Up, So Are Pending Sales
April data revealed a meaningful shift in the Coachella Valley housing market:
-
Active listings increased to 3,706, the highest level in over a year.
-
Pending sales also climbed to 975, marking a 14-month high.
-
New listings, however, dropped to 1,205, indicating that while supply is elevated, seller activity may be slowing.
This suggests a transitional market: buyers are active but selective, and overpriced inventory is being left behind.
Months of Inventory: Supply Absorption Is Improving
-
The market peaked at 6.3 months of inventory in October 2024.
-
That figure is now down to 3.8 months, based on pended sales.
This indicates healthier demand, especially when viewed through a seasonal lens. Homes are being absorbed at a faster rate, particularly if priced well and in good condition.
Days on Market: Slight Uptick, No Major Red Flags
-
The average days on market rose to 66, up from 63 the month prior.
This isn’t signaling a market breakdown—more likely, it reflects pricing gaps and lingering listings rather than a drop in buyer activity. Homes that are turnkey and well-positioned are still selling efficiently.
2025 Home Price Forecasts: Modest Gains Expected
National data shows a mixed but generally positive outlook for 2025:
| Source | Forecast |
|---|---|
| Fannie Mae | +4.1% |
| CoreLogic | +3.3% |
| HPES | +3.3% |
| Wells Fargo | +3.0% |
| NAR | +3.0% |
| MBA | +1.3% |
| Zillow | -1.9% |
The average forecast across all sources is +2.3%, pointing to steady, moderate growth rather than aggressive appreciation or a downturn.
Exit Strategy Implications for Investors
-
Fix-and-Flip: Focus on shorter rehabs and strategic improvements. Extended hold projects carry greater risk due to price sensitivity and seasonal slowdowns.
-
Buy-and-Hold: Mid-term rentals are becoming more attractive as affordability pressures increase. Focus on fully furnished, plug-and-play properties in MTR-legal zones.
-
Creative Finance: Rising DOM and tired inventory are opening the door for subject-to and seller-financing opportunities.
-
Lease Option / Rent-to-Own: Viable in areas with large buyer pools who are currently priced out of traditional financing.
Key Trends to Monitor
-
Interest Rates: Any shift by the Fed will ripple through buyer affordability and lender sentiment.
-
Summer Buyer Fatigue: Historically, activity softens in the desert from late June through September.
-
Inflation and Consumer Confidence: These macro forces remain critical to short-term momentum.
Conclusion: Strategic Discipline Is the Advantage in 2025
Investors operating in the Coachella Valley today need to be sharper than ever. This is no longer a market where appreciation alone carries the deal—margin, timing, and execution matter more than ever.
Here’s how seasoned investors are approaching the current climate:
-
Value-based acquisitions with realistic comps and built-in negotiation.
-
Rehab scopes that avoid over-improvement and align with exit strategy.
-
Capital-efficient models that account for shifting DOM and buyer psychology.
-
Terms-based offers to unlock deals that others overlook.
From my own experience managing projects, acquisitions, and renovations in this market, success isn’t about chasing volume—it’s about disciplined decision-making. Understanding local buyer behavior, adjusting to macro signals, and structuring deals with optionality gives serious investors the edge.
This market rewards clarity, not speculation. Whether flipping, holding, or offering creative terms, there’s still opportunity—just not for the passive or overleveraged.
Would be interested to hear how others are adapting in the face of shifting demand and rising seller fatigue.


Post: How to Invest Smarter in Real Estate in a High-Interest Market (2025 Edition)
- Real Estate Agent
- Palm Desert, CA
- Posts 21
- Votes 4
 How to Invest Smarter in Real Estate in a High-Interest Market (2025 Edition)
By Marius C. Olbrych
Investor | Licensed Realtor® | Renovation Consultant | Coachella Valley Market Specialist
We’ve officially entered a new era for real estate investing.
With interest rates hovering around 5%–5.5% and affordability at decade-lows, the old strategy of riding easy appreciation is fading fast. In its place? A skill-based market that rewards smart acquisitions, renovation efficiency, and adaptable exit strategies.
Whether you’re a seasoned investor or just getting started, here’s a breakdown of what’s working right now—from boots on the ground in the Coachella Valley to broader trends across the country.
🏦 1. Cash Flow First: Appreciation Comes Second
In 2021, appreciation masked weak deals. Today, your margins need to pencil from day one. Investors are pivoting to:
-
Under-market acquisitions
-
Targeted, ROI-focused renovations
-
Holding long enough to capture equity through cash flow instead of speculation
In short: If it doesn’t cash flow, it doesn’t go.
🛏️ 2. STRs Face Headwinds—MTRs Are Gaining Momentum
Short-term rentals (STRs) are getting squeezed by:
-
Stricter city ordinances
-
Permit caps
-
Oversupply in tourist zones
That’s why more investors are embracing Mid-Term Rentals (MTRs)—furnished 30–90 day stays ideal for:
-
Traveling nurses
-
Relocating professionals
-
Snowbirds and seasonal residents
-
Insurance displacement tenants
In markets like Palm Springs, where regulation is tightening, an MTR strategy can outperform STRs in both returns and stability—especially near hospitals, downtown corridors, and event venues.
🧮 3. Creative Financing Is a Game Changer
Rising interest rates are pushing buyers to think like investors—not just borrowers. That includes:
-
Seller carry (seller financing)
-
Subject-to deals
-
Wraparound mortgages
-
Assumable loans
-
Rate buydowns and delayed financing plays
Knowing how to structure deals creatively is becoming a core skill set—and it’s what separates pros from those stuck on the sidelines.
🛠️ 4. Renovation = Opportunity
Flippers and BRRRR investors, take note: Ugly homes with good bones are winning again.
In 2025, renovated properties that are turnkey and functional will stand out. Investors are:
-
Buying distressed or outdated homes
-
Renovating with tenant or buyer profiles in mind
-
Creating value through design, energy upgrades, and layout efficiency
The best part? Renovation adds leverage to every exit strategy—whether it’s flipping, refinancing, or renting.
📉 5. Stop Waiting for Rates to Drop. Adapt to Reality.
Too many investors are sitting idle, waiting for “the pivot.” But in truth:
-
Rate drops won’t restore affordability overnight
-
Inventory remains low
-
Smart deals are still out there—but they require skill and speed
Those who succeed in 2025 will be the ones who:
✅ Buy below market
✅ Operate lean and efficiently
✅ Adapt their strategy to the property and the local demand
✅ Use financing and renovations strategically
🔍 Final Thoughts
2025 isn’t about timing the market. It’s about being ready when the market gives you a window.
If you're flipping, holding, or building out a rental portfolio, the winning plays involve value creation, risk management, and strategic exits. The investors thriving this year are the ones who treat real estate like a business, not a bet.
Let’s keep the conversation going—how are you adjusting your strategy in 2025?

Post: Desert Property Playbook: May 2025 Market Moves
- Real Estate Agent
- Palm Desert, CA
- Posts 21
- Votes 4
Posted: May 4, 2025
Coachella Valley Market Snapshot: Spring Awakens
The Coachella Valley real estate market is showing renewed strength this spring. March closed with 715 homes sold—up from 636 in February—accounting for over $661 million in transaction volume. It marks a solid seasonal uptick, historically consistent with the region’s spring surge.
Inventory remains tight, with just 196 new listings recorded in April, down slightly from March. Median prices for detached homes reached $710,000, extending a five-month trend of price growth.
Interestingly, the city of Coachella shows a disconnect between asking and closing prices. In February, Redfin reported a median sale price of $435,000, while Realtor.com listed March’s median asking price at $514,500—a 28.9% year-over-year increase. This growing gap highlights seller optimism and buyer price sensitivity, especially in entry-level submarkets.
National Trends: A Tilt Toward Buyers
Nationwide, signs of a cooling market continue to emerge. Annual home price growth slowed to 4.5% in February from 4.7% in January. Meanwhile, seller concessions became more common—44.4% of Q1 2025 transactions included some form of seller contribution, such as closing cost credits or repair allowances. This marks a significant shift in negotiation dynamics compared to the previous year.
With 30-year mortgage rates hovering near 7%, affordability remains a top concern, particularly for first-time buyers and those looking to move up without giving up low-interest loans secured in recent years.
Global Perspectives: Supply Pressure and Shifting Demand
International markets offer additional context. In Australia, a projected housing shortage looms as the country risks falling nearly 300,000 homes short of its 1.2 million housing target by 2029. Labor constraints and elevated borrowing costs are key challenges.
Meanwhile, American interest in international real estate continues, driven by lifestyle migration and wealth diversification. However, recent policy changes—such as the elimination of residency-by-investment visas in countries like Spain and Malta—are curbing some outbound demand.
Investor Strategies to Watch in 2025
For real estate investors looking to navigate today’s market conditions, the following exit strategies have gained traction based on recent investor feedback and forum discussions:
1. Buy-and-Hold
Continued demand for housing and limited new construction in key regions make long-term rentals a relatively stable strategy, especially in second-home or retiree destinations.
2. Fix-and-Flip
Flippers are being more selective, targeting properties in neighborhoods with resilient demand and low DOM (days on market). Given the uncertain rate environment, emphasis is being placed on shorter hold times and conservative after-repair value (ARV) projections.
3. Short-Term Rentals (STRs)
Markets with a strong tourism base still support STRs, though increased regulation has tightened inventory. Investors are focusing on STR-friendly cities with clear compliance frameworks.
4. Build-to-Rent (BTR)
This model continues to expand, especially in suburbs where families are priced out of ownership. One peer example involved launching a small-scale single-family BTR community, yielding an 8% annual return in the first year with minimal vacancy.
5. Fractional Ownership
Emerging platforms now allow multiple investors to co-own high-value properties. This strategy lowers capital barriers and allows for geographic diversification, particularly in high-demand vacation markets.
Federal Reserve, Macroeconomics, and Policy Landscape
Economic factors continue to play a pivotal role in real estate. Here are the key developments investors are watching:
Federal Reserve Outlook
The FOMC is meeting May 6–7, with no interest rate cuts expected. While some political voices advocate for looser monetary policy to support growth, the Fed remains cautious due to inflation risk—especially as new tariff policies and immigration-related uncertainty weigh on projections.
GDP and Growth
The U.S. economy contracted at an annualized rate of 0.3% in Q1 2025, largely driven by a spike in pre-tariff imports. Consumer behavior is showing signs of strain as financial sentiment wavers.
Mortgage Rates
Projections for 2025 suggest the 30-year fixed rate may stabilize around 6.0%, according to NAR estimates. This could aid new construction and stimulate demand, though access to financing remains tighter than in prior years.
Tariffs and Household Impact
Recent global trade measures have already begun influencing household budgets. While inflation has not yet spiked dramatically, concern is mounting as inventories dwindle and the cost of goods starts creeping upward.
Final Thoughts
The real estate market in 2025 is proving to be both challenging and full of opportunity. For investors, the key is flexibility—adapting to market shifts, staying informed on policy changes, and choosing exit strategies that align with today’s risk profile.
Would love to hear how others are adjusting their buy-box, financing models, or holding timelines based on this latest round of data.
What’s your play in this market?

Post: Rancho Mirage, CA at a Tipping Point: Buyers Still Rule, But the Window Is Closing
- Real Estate Agent
- Palm Desert, CA
- Posts 21
- Votes 4
Rancho Mirage at a Tipping Point:
Buyers Still Rule—for Now, But the Window Is Closing
Strategic Market Update – April 2025
Prepared for the BiggerPockets Community
Source: Altos Research | Data as of April 20, 2025
Executive Summary
Rancho Mirage currently reflects characteristics of a slight buyer’s market, with a Market Action Index (MAI) of 28, just below the neutral benchmark of 30. Inventory is elevated at 316 active listings, but demand has been quietly gaining ground. This is the early stage of a trend shift—sales are now consistently outpacing new listings.
Sellers are beginning to make price concessions, and smart investors who move now can still negotiate strong terms before the market rebalances. This is the last phase before upward pressure on pricing begins to return.
Key Market Indicators
| Metric | Value |
|---|---|
| Median List Price | $1,286,944 |
| Median New Listing Price | $1,247,500 |
| Price per Square Foot | $485 |
| Median Days on Market | 70 |
| Average Days on Market | 103 |
| Inventory | 316 |
| Price Reduced Listings | 51% |
| Price Increased Listings | 3% |
| Relisted Properties | 17% |
| Median Rent (Monthly) | $9,250 |
| Market Action Index | 28 |
Market Positioning
Buyers currently retain negotiating power, but momentum is shifting. For the past several weeks, absorption rates have exceeded new listing volumes—a sign that supply may soon tighten.
The high percentage of listings with price reductions (51%) shows that sellers are reacting to softening expectations, especially in mid-tier and luxury product segments. Relist activity at 17% further confirms that overpriced homes are being repositioned for serious buyers.
Expect stronger resistance from sellers in Q2 and Q3 as inventory normalizes and buyer demand—often seasonal in this market—increases.
Segment Breakdown
| Segment | Median Price | Sq Ft | Beds | Baths | Avg DOM | Typical Lot Size |
|---|---|---|---|---|---|---|
| Top 25% | $3.65M | 4,615 | 4 | 4 | 77 | 0.5 – 1 acre |
| Upper-Mid 25% | $1.595M | 3,088 | 3 | 3 | 70 | 0.25 – 0.5 acre |
| Mid-Tier 25% | $1.09M | 2,539 | 3 | 2.5 | 63 | 8,000 – 10,000 sqft |
| Entry-Level 25% | $779K | 2,036 | 3 | 2 | 77 | 6,500 – 8,000 sqft |
Strategic Considerations
1. Short-Term & Mid-Term Rental Viability
The median rent of $9,250 supports executive-level furnished rentals. However, all investors should verify HOA and city zoning compliance for STR/MTR models before acquisition. Focus on communities with documented rental allowances or opportunities for corporate housing.
2. Fix-and-Flip Entry Window
The mid-tier and upper-mid segments ($1.1M–$1.6M) offer the best spread opportunity. Days on market under 70 and high price-reduction rates make these targets ideal for renovation or repositioning plays. Construction-ready properties below $485/sqft are worth underwriting.
3. Long-Term Hold Outlook
Investors looking to hold should prioritize well-located homes with upgraded systems, low deferred maintenance, and strong curb appeal. Appreciation upside remains strong for quality inventory, especially as market conditions tighten.
4. Creative Finance Opportunities
Sellers with over 90 DOM and a history of price adjustments may be open to terms deals. Creative finance structures (seller carry, subject-to, lease options) are more feasible now than they will be once the MAI crosses 30 and sellers regain leverage.
Final Outlook
Rancho Mirage is in a transitional phase. While it is still technically a buyer’s market, the underlying fundamentals are shifting toward equilibrium. Buyers have a narrowing window to capitalize on soft pricing before market conditions begin to favor sellers again.
For serious investors, this is a prime opportunity to secure a foothold—provided you move with due diligence, focus on quality assets, and account for seasonal demand in the Coachella Valley.

Post: 🏜️ 3 Reasons Baby Boomers Are Cashing Out in the Coachella Valley
- Real Estate Agent
- Palm Desert, CA
- Posts 21
- Votes 4
🏜️ 3 Reasons Baby Boomers Are Cashing Out in the Coachella Valley
And why this might be the opportunity buyers and investors have been waiting for.
Hey BP fam—wanted to share some trends I’m seeing here in the Coachella Valley (Palm Springs, Palm Desert, and nearby cities). There’s been a clear uptick in listings from longtime owners, especially Baby Boomers. Here’s what’s driving it:
1. Home Values Are High—Many Are Ready to Exit
Boomers who bought before 2015 are sitting on a lot of equity. Some are downsizing, others relocating. Many are choosing to cash out before the next market shift.
2. The Wealth Transfer is Already Happening
We're in the early stages of a massive intergenerational shift. Boomers are using real estate to gift wealth, simplify estates, or 1031 into income-producing assets. That’s created more opportunities for trust sales, flexible timelines, and motivated but non-distressed sellers.
3. Lifestyle Changes Are Driving Decisions
Retirement priorities have changed. Some want less maintenance, others want to be closer to grandkids or simply avoid high HOA dues. A lot of these homes have great bones but need light updating—perfect for value-add buyers.
Why it matters:
We’re seeing quality homes hit the market—not distressed properties, but transitional ones. These often come with seller flexibility, potential for creative terms, or room for a light flip or mid-term rental setup.
Would love to hear what you’re seeing in your markets—anyone else noticing more Boomers liquidating or simplifying?
Let’s talk trends, creative strategies, or even share buying criteria in the comments.

Post: Palm Springs Condominium Market Update
- Real Estate Agent
- Palm Desert, CA
- Posts 21
- Votes 4
Palm Springs Condo Market Update – April 2025
Hey BP community,
Here’s a fresh pulse check on the Palm Springs condominium market as of April 2025. Whether you’re investing locally or simply tracking opportunities from afar, this month's data reveals some compelling trends worth discussing.
Market Overview
-
Median List Price: $449,000
-
Price per Sq Ft: $378
-
Median Rent: $2,600/month
-
Market Action Index (MAI): 32 — indicating a slight seller’s advantage
-
Inventory: 359 condos (increased from last month)
The Market Action Index is our gauge of market strength. While the MAI dipped slightly from 33 to 32, it still reflects a mild seller’s advantage. However, it’s worth noting that 47% of listings have seen price reductions, signaling growing negotiation opportunities.
Time on Market
-
Average Days on Market: 97
-
Median Days on Market: 63
Buyers and investors appear to have more breathing room in this environment, as properties are staying active for longer.
Segment Snapshot
Here’s a breakdown of four key pricing tiers within the Palm Springs condo market:
| Median Price | Size (SqFt) | Beds | Baths | Age | Days on Market |
|---|---|---|---|---|---|
| $845,900 | 1,923 | 2 | 2 | 52 | 49 |
| $534,500 | 1,372 | 2 | 2 | 46 | 63 |
| $379,000 | 1,131 | 2 | 1.8 | 46 | 59 |
| $250,000 | 705 | 1 | 1 | 44 | 77 |
Across the board, these properties tend to be older builds—offering potential for value-add strategies, especially for those comfortable managing renovations or repositioning units for long- or mid-term rentals.
Investor Insight
The Palm Springs condo market appears to have reached a temporary plateau. With no recent price increases reported and nearly half of listings reducing asking prices, we’re entering a moment of recalibration.
Rising inventory and longer days on market could suggest more negotiation power for buyers, especially for investors focused on long-term value and cash flow.
At $378 per square foot, remodeled units may still justify strong resale values depending on finish level, comps, and market timing.
Are you seeing more opportunities in the Palm Springs condo space lately?
How are you adjusting your buy box or renovation strategies given longer time on market and pricing adjustments?
Are you preparing for a potential buying window—or sitting tight to see how Q2 shakes out?
Looking forward to hearing your thoughts and experiences.

Post: Coachella Valley Single-Family Market – February 2025
- Real Estate Agent
- Palm Desert, CA
- Posts 21
- Votes 4
Coachella Valley Single-Family Market – February 2025
Investor check-in: What are you seeing on the ground?
Just wrapped up reviewing the February numbers for the Coachella Valley, and I thought this would be a great time to compare notes with other investors—especially those working in SoCal or similar resort-style markets.
Here’s what jumped out this month:
-
Listings under contract jumped 51.5% year-over-year
-
Inventory is up 14.8% YoY, sitting at 2,753 active homes
-
Median sale price dipped to $710K, down 4.1% from last year
-
Days on market increased to 71, up from 63 in Feb 2024
-
Months of supply grew to 6.5, which is a 17% increase
-
New listings are still strong, but down from January’s rush
-
Sales-to-list price ratio stayed firm at 96.8%
So what does that mean in plain English?
The market is cooling—but not collapsing. Prices are softening, homes are sitting longer, but buyers are getting off the sidelines. Pending sales were way up, and that tells me people are watching for their moment to strike. Inventory growth means more choices. Seasonality might be playing a role, but this feels like a window of opportunity opening for well-prepped buyers.
Now I’m curious…
How’s everyone else reading this?
-
Are you buying more aggressively right now—or sitting tight until Q2?
-
For flippers: Are you adjusting your hold timelines or your finish levels?
-
For buy-and-hold investors: Are rents keeping pace with property values in your area?
-
Anyone seeing price drops or motivated sellers start to appear in the mid-tier and luxury range?
-
What kinds of creative financing or seller incentives are you seeing work right now?
I’d love to hear how other BiggerPockets members are approaching this kind of shifting market. Are you leaning in—or pulling back?
Let’s share notes.
