


What has Historically Drive RE Returns?
I took @Dave Meyer's awesome data and played around with it a bit. Since I don’t have to commute, I have way more time on my hands these days. But, without all his hard work none of this would have been possible. So big thanks to him. Get ready for a LONG post, but we are all working from home, so its not that big of a deal. If you just care about the summary see Takeaway at the end.
Here is what I did: Looked at which cities had the best Cumulative Returns [(Appreciation + Cash Flow) / 2010 Purchase Price] from 2010 to 2018 and tried to see what factors had a positive or negative impact on Cumulative Return (CRet)
How did I figure out CRets?
I kept all of Dave's assumptions and added a few of my own. 1. That you could reinvest all profits from cash flow at 2%.This number is high for a savings account but doesn't account for using the accumulated cash flow to buy more properties, but that is a super hard model to make and I'm not that smart. 2. Taxes, insurances, and CapEx are 85% of their 2018 levels. This is to account for about 1.7% inflation we have had over that time frame. This is a major assumption, since taxes don't work like this, but it is the best I can do at this aggregate level of data.
Cumulative Return
Step 1: Find Total Appreciation= Home Value 2018- Home Value 2010
Step 2. Find 2010 Rental Profit= 2010 Median Rent - [.85(Taxes+Insurance+CapEx) + Vacancy Exp + PM]
Step 3: Get Total Value of the Rental Profit from 2010-2018. For this I used the Future Value of a Growing Annuity Formula. This give the total value of all the profit collected if someone deposited it in a checking account every month and left it alone. I won’t go into the gory details of this, but I assumed the rent grew at the Rent CAGR rate (g in the formula) the money was invested at 2% (r, rate per period) with the number pf periods being 9.
Step 4: Figure out CRet= [(Total Appreciation + Total Value of Rental Profit)/ Home Value 2010.]
BEST CITIES
Here are the top 20 cities with the best CRet in alphabetical order: They range from 82% -46%, which is 6.9%-4.3% annual unlevered return (Sorry for the weird formatting)
Arvada , Colorado Aurora , Colorado Bismarck , North Dakota Broomfield , Colorado Centennial , Colorado Denver , Colorado Fort Collins , Colorado Highlands Ranch, Colorado Lakewood , Colorado Longmont , Colorado Loveland , Colorado Mountain View , CA Newport Beach , California Pittsburgh , Pennsylvania Redmond , Washington Santa Clara , California Somerville , Massachusetts Sunnyvale , California Thornton , Colorado Westminster , Colorado
Yay! We have a list of towns that did well in the past! Lets all go buy properties there! Oh wait, you don’t drive a car looking through the rear view mirror, so why would you invest that way?
A list of cities that did well, is not terribly useful, but what comes next is!
More math, sorry (but not really)
I ran some basic stats (linear regressions if you care) to see what factors explain the CRet the most for either good or bad.
State + Taxes + VacRate + MedianRent10 + Insurance + CoCR+ RentCAGR + HomeCaGR + RentToPrice + CoCRDelta
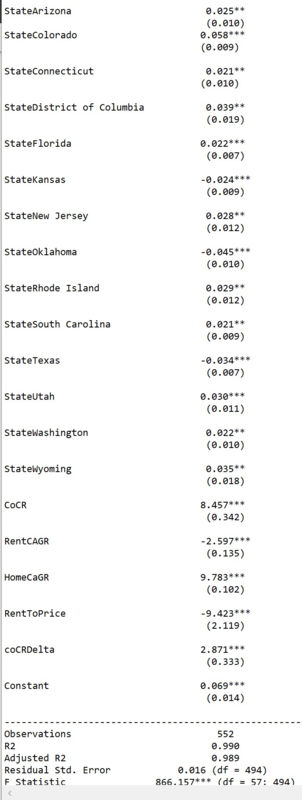
Here are the results. The number we care about is the one with the stars next to it. If a variable isn’t included in the image, that means that we can’t tell with a high degree of certainty that it isn’t zero and thus doesn’t impact the model. According to this model Taxes + VacRate + MedianRent10 + Insurance have no impact on CRet.
Looking at the Math
Now what do they mean? This is like one big formula, you could go down the list and could plug in the details of your property to theoretically get what you could expect for a CRet (that won’t work, but more on that later). If this property is in Texas, the model says the property with have a CRet that is 3.4% lower than if it wasn’t in Texas. If it has a CoCR of 1% (.01) that will add 8.5% (.01*8.45*100) to the CRet. If the CoCR is 2% it will add 17% (.02*8.45*100).
Here come the part that some folks may not like, the largest driver of CRet???..... Home appreciation!! At least from this data set. A 1% higher HomeCAGR leads to a 9.8% increase in CRet. Now CoC isn't far behind at 8.5%, but its not ahead either.
Final surprise: Higher Rent to Price ratios causes a negative impact on CRets! Said another way, since the main way you get high Rent to Price ratios is by having low purchase prices, the data doesn’t back up the claims of buying for the 2% Rule or those cash cows in C-D class neighborhoods. Sorry Clayton!
Looking at the Model
A smart guy once said “All models are wrong, some are useful”, so how is this model wrong.
- It is aggregate data for towns, some of which are large so by taking averages it can smooth out possible opportunities.
- The cumulative cash flow calculation is really based on rough rough estimations, not historical data, so it is by definition, wrong.
- The home values are medians, so they too have been smoothed.
- Most people buy RE with leverage, and this model assumes all cash purchase. This means we are assuming that people are renting properties that they could not rent with debt without being cash flow negative. This is fine because we are looking at trends, not actual numbers.
Takeaways:
- High Rent to Price ratios negatively impact CRets
- The states of Kansans, Oklahoma, and Texas don’t have a positive impact on CRets. Why? I have no idea.
- HomeCAGR and CoCR both about equally contribute the most to over all return, so it would be worth thinking about what dives both of those and focus your strategy on one or the other.
****None of this explains why things happen, but simple try to show in more detail, what is happening and even the “what” is a rough approximation. I would not use this to make individual investment decisions, but rather as a tool to help me think about my investing strategy at a macro level.
If you see any errors or want to know more feel free to let me know. I have run the data through some more models, but I haven’t included them for the sake of brevity. If you are wondering, I used R to do nearly all of this. I can post the expanded excel, if there is interest along with my R script.
Looking forward to hearing the insights from the BP community!