


Updated about 4 years ago on . Most recent reply

How We Chose a Long Distance BRRR Market
Why all the effort?
When my partner and I decided to start a real estate investment company at the beginning of 2020 we had most major questions answered.
Our goal was to use the BRRRR strategy to buy single family residential properties with a system geared to scale. We had a property model and a growth model and -- mainly thanks to many hours consuming Bigger Pockets content -- had been convinced that long-distance investing was the way to go.
With all that, there was only one not-so-small question left to answer: which market should we invest in?
This question turned out to be a tricky one. While it's true one can find plenty of market rankings out there in the internet ether, every list has a different set of conclusions based on varying methodologies that weren’t devised with a mind to individualized investment strategies. So, facing a choice of backing into a strategy with a purportedly good market rather than the other way around, we decided to just do the analysis ourselves.
In this post, I’m sharing a high-level overview of our methodology in the hope that it will be helpful to others seeking to solve the same problem for their business. While our top markets almost certainly won’t be yours, the framework may be useful in identifying your own. Critique would also be more than welcome -- we plan to continue using this analysis to expand into new markets and I’ve no doubt there’s plenty of room for improvement.
Before getting started, it should also be noted that data for this analysis was collected at the beginning of 2020 and has not yet been updated with data from the rest of the year.
When in doubt, funnel

Given we were willing to consider just about any market in the US, the basic structure needed for the analysis was clear: a big funnel to quickly go from a very lot to a very few.
To build our top of funnel, we aggregated select data from Zillow, The US Census Bureau, and other trusted sources. The raw list we got from combining these data totaled to roughly four thousand potential markets.
This four thousand was the very lot. To get to the very few, we then passed these markets through a funnel consisting of four different levels of criteria.
Level One
Level one was by far the most discriminatory of the four levels. With filters on this level, we went from around four thousand markets to 120 and then to 59 and then to 32.
The first jump was effectuated using the best external lists we could find to filter markets based on their growth potential. Long story short, we eliminated any markets that didn’t show up on any of the lists we found.
The thinking for consulting these sources was they're an easily accessible way to measure market fundamentals and thus to identify areas with resilience and appreciation potential. Since the end goal of any BRRR is to hold the property, it stood to reason that we wouldn't want to target areas that have good superficial characteristics (e.g., good emerging characteristics, low median purchase price, high cash flow) but bad long-term growth prospects.
It’s always possible that a market slips through the cracks of national awareness, but we decided that, given we were looking for a market to learn the ropes in, it was prudent to assume that any worth exploring in detail would have many different analysts pointing at it with varying degrees of enthusiasm. This assumption saved us the effort of deeper dives into the fundamentals data until we had a more manageable list of markets to investigate.
Of the external lists, the top two rankings we found were produced by buildium.com, which created tiers based on fundamentals like population growth and YOY appreciation, and PWC, which created tiers based on surveys of industry professionals. With these and several other lists in hand, we then proceeded to measure the buy and hold potential of national markets with two metrics:
- An unweighted average the PWC and Buildum market tiers which we called “B&H Value” (buy and hold value). If the market appeared in Buildium’s first tier and PWC’s second, for example, it would have a buy and hold value of 1.5
- A count of the number of external lists that included the market in question. We called this metric “Source Strength.” If a given market appeared on 5 lists, it would have a source strength of 5.
An averaged percentile rank of these two functions (which we called “B&H Score”) gave us a top twenty buy and hold markets in the country according to the wisdom of the crowd going into 2020. The 2020 Buildium and PWC tiers are included for reference.
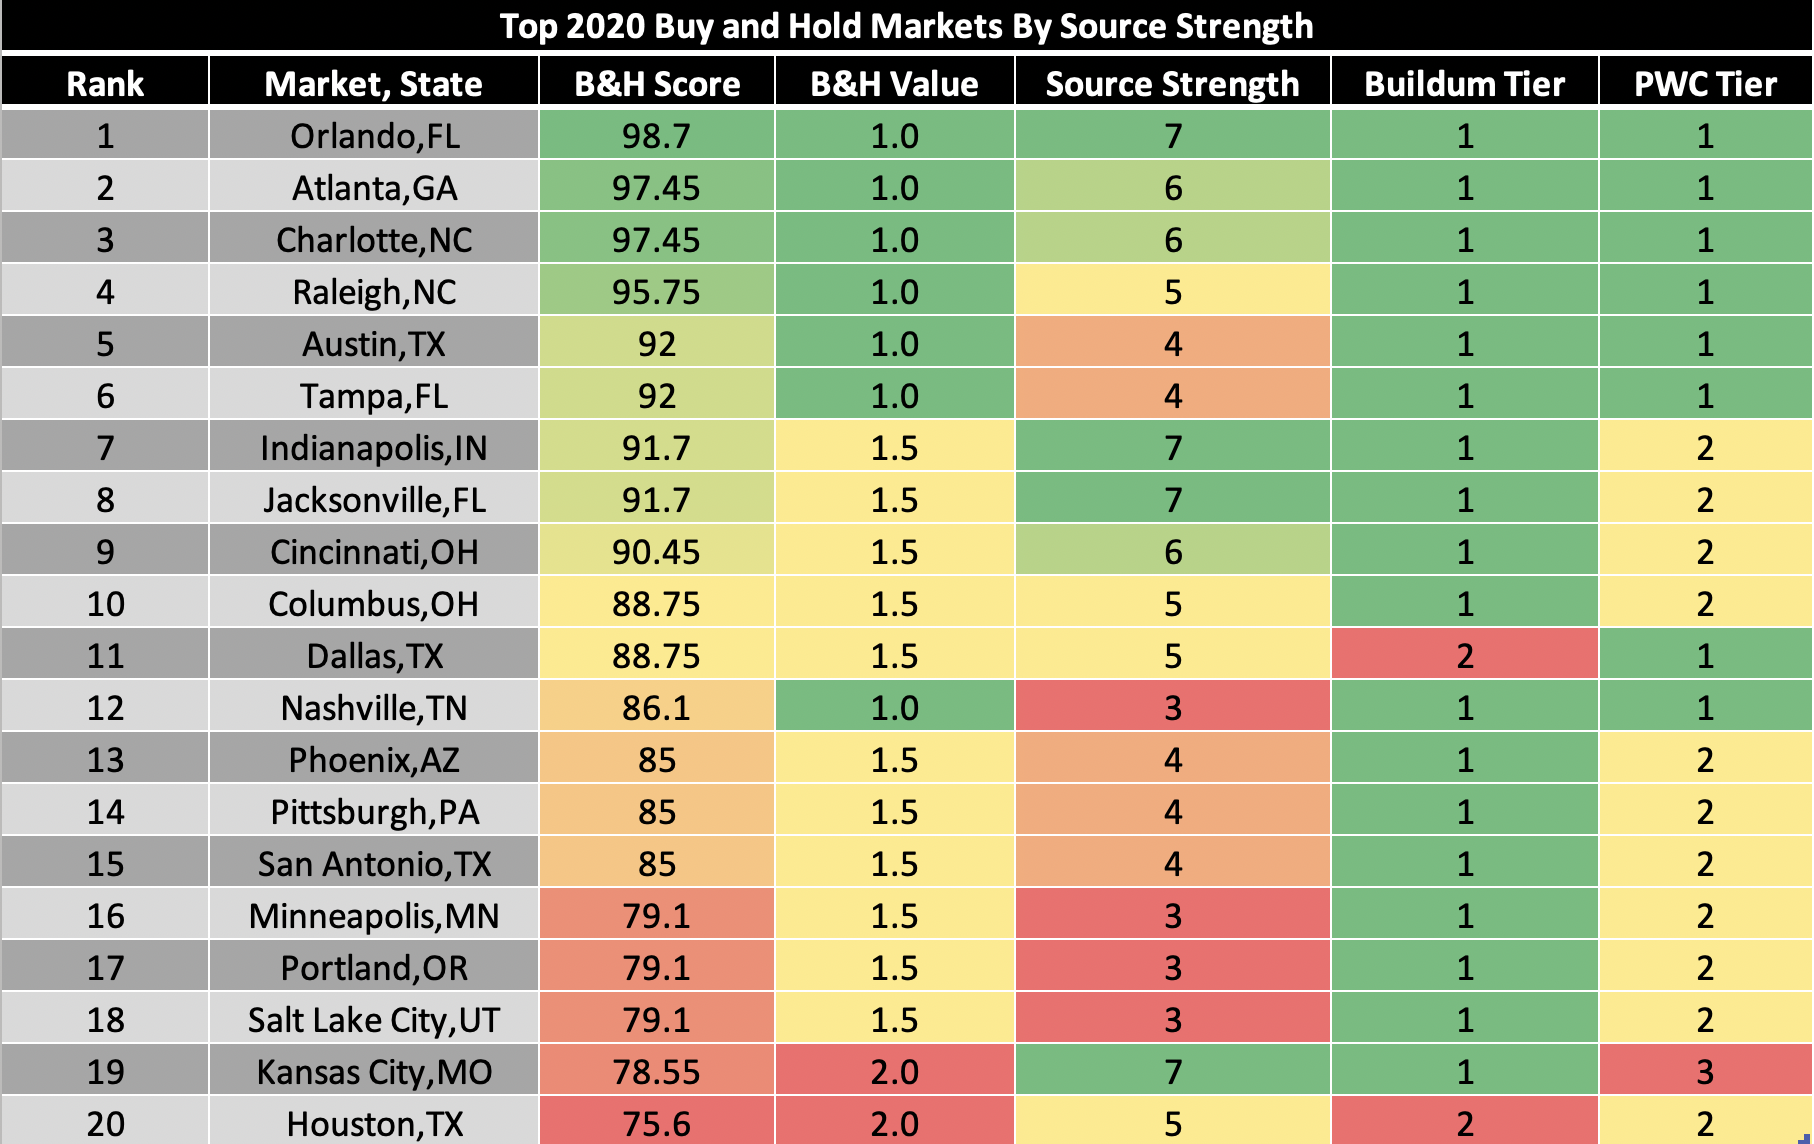
This was a good start, but we needed a lot more information. Orlando might be a strong buy and hold market, but did it have the sort of properties we were looking to buy? Where was it in the market cycle? How much could we expect to cash flow?
The next step was then to see which markets would best accommodate our property criteria. To answer this question, we used Zillow data to aggregate median sale price, rent, and then calculated average rent as a percentage of purchase price and price to rent ratio in each market (handy metrics used to measure cashflow potential).
Our second filter was then created with a percentile function that broke the markets into relative quadrants. Markets in the 75th or higher percentile, for example, were the best (least expensive), and markets in the 25th or lower percentile were the worst (most expensive). We then filtered to all markets in the top 50th percentile or above for median sales price and expected cash flow.
Here is a top twenty rank sorted by “CharacteristicsScore,” an average of percentile ranks of median sales price and price to rent ratio (i.e., a composite score measuring low purchase price and high cash flow potential):
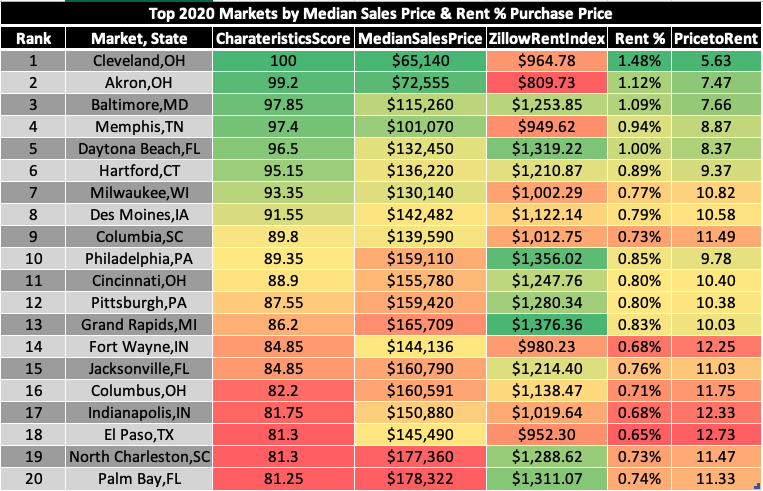
Interestingly, Cleveland, OH, which topped our filtered list, was also at the top of the unfiltered list of four thousand cities, which suggested it had the best cashflow prospects in the country going into 2020:
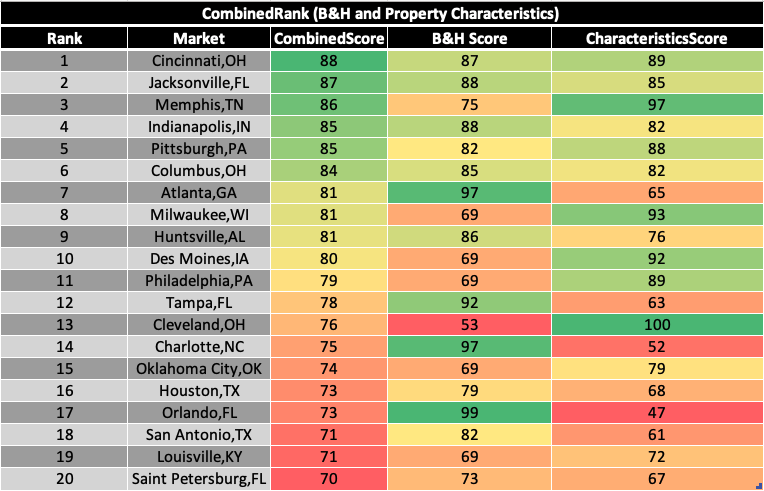
Taken together, the metrics we had snapped in so far provided a good high-level look of markets that had both strong growth potential and desirable property characteristics (according to our business strategy).
A combined view of the top markets so far sorted by a composite score of their buy and hold potential and property characteristics ("CombinedScore"):
Now for the last metric in level one.Since our goal was to find a market that not only had strong characteristics and growth potential but also plenty of room to grow (i.e., an “emerging market”), we needed one more filter.
The real estate market cycle as depicted below illustrates what we were looking for. An emerging market (by our definition) is one that finds itself at the end of phase one (recovery) or the beginning of phase two (expansion).
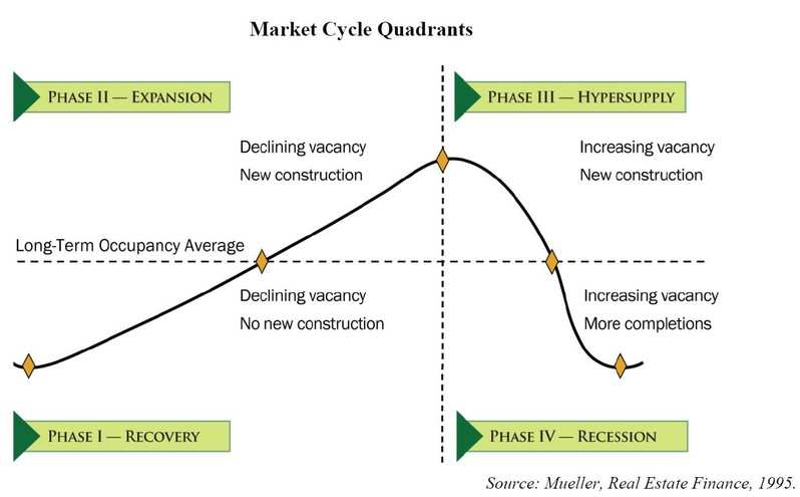
To identify a market’s likely place in this cycle, we created a measure called “Emerging Market Score” (EMS). To build it, we took four further market measures– absorption rate, affordability, building permits pulled, and vacancy – and boiled them down into a composite score.
The classic relationship used to identify a market's place in the market cycle is building permits pulled vs vacancy rates in a city. If vacancy is low and decreasing and the number of building permits pulled are moderate and slightly increasing, it should mean that demand for housing is going up in that market and supply is growing but not yet saturated.
To expand on this, we added absorption rate and affordability. The thinking was that absorption rate should both substantiate the demand for housing and flag markets that are nearing saturation or hyper-supply. Affordability provides context for how high the market ceiling is; at the end of the day, prices can only go as high as people can afford to pay, so higher affordability in a market with strong fundamentals suggests room for sustained price appreciation.
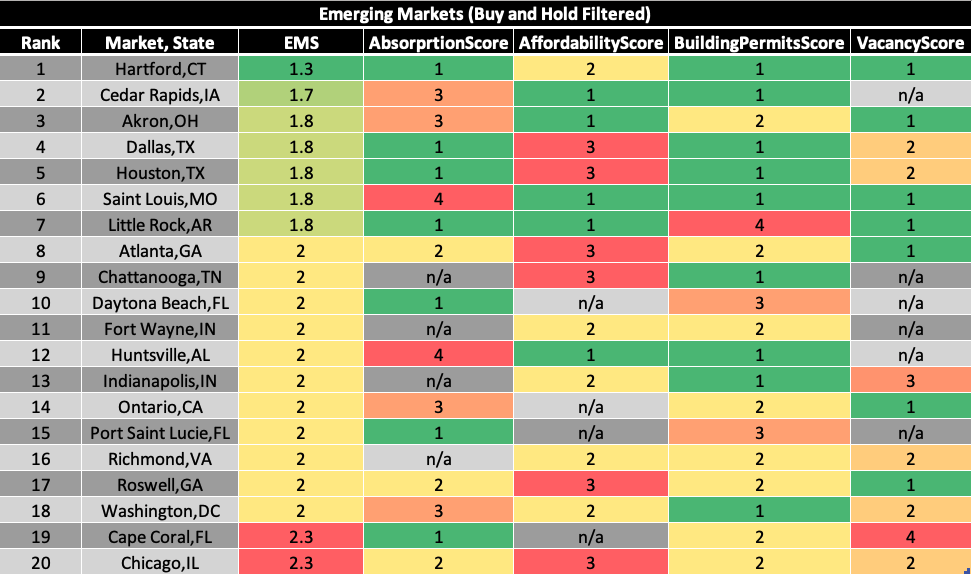
After crunching the numbers, here are our top twenty markets (of the originally filtered 120) sorted by EMS. The smaller the score, the more emerging the market. The individual scores for the four metrics we used to calculate the composite score are included for reference:
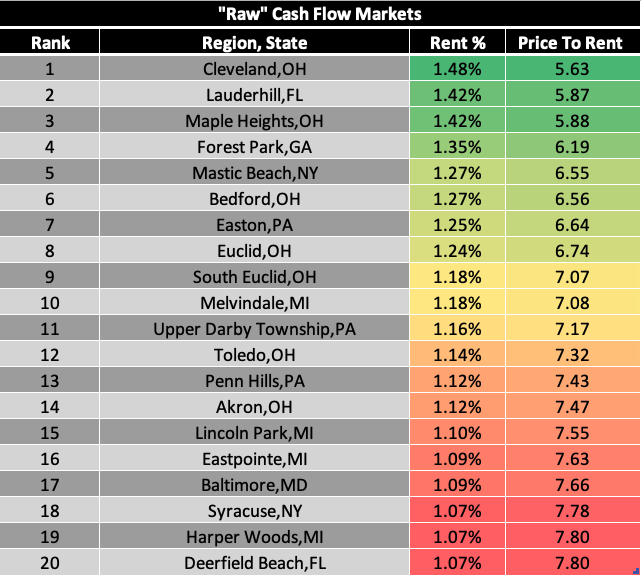
As mentioned earlier, we weren’t interested in markets that didn’t pass our quality check with the external lists in the first filter, so we didn’t spend much time looking at a “raw” list of the full four thousand. Still, a top twenty of unfiltered markets sorted by their Emerging Market Score makes for an interesting view:
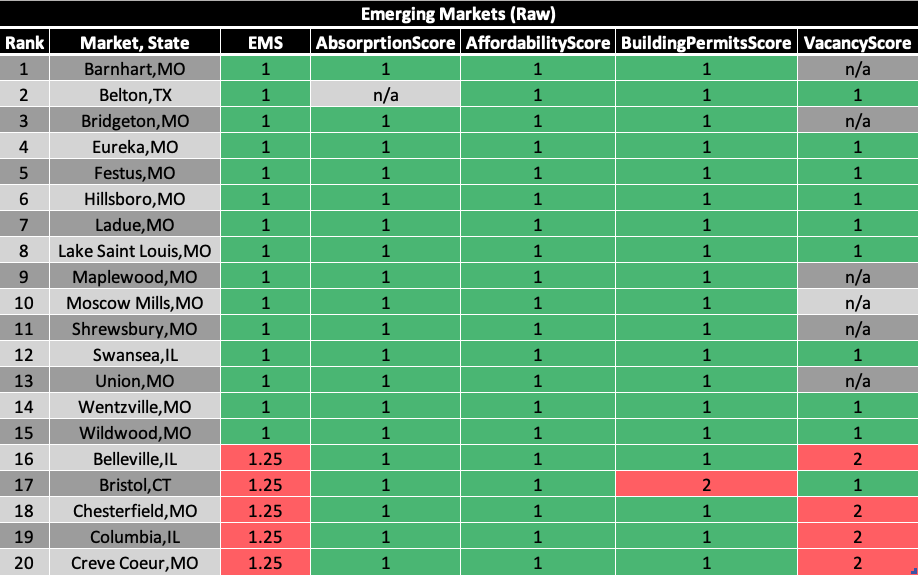
Funnily enough, the best emerging market by this measure was a tie between several markets in Missouri, one of which is Eureka, MO (if that isn’t a sign, I don’t know what is). The least emerging market in the country was Fairfield, CA.
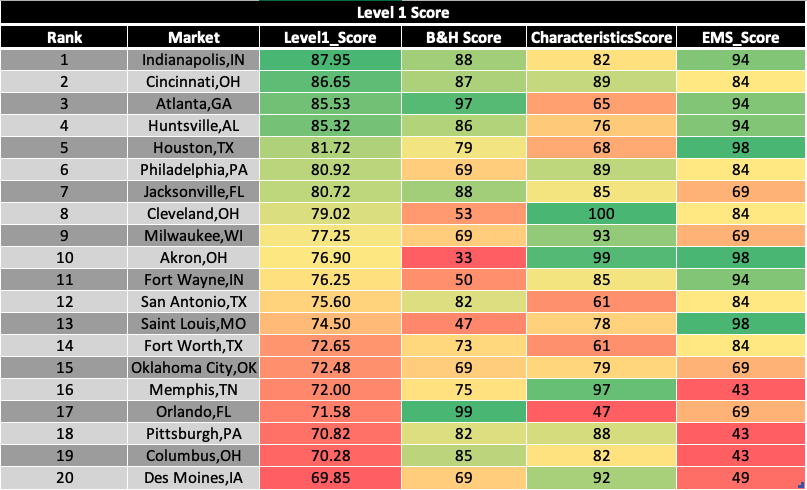
To wrap up things up, here’s a top twenty created using a combined score from all the level one filters:
This was a great start. However, as is probably clear by now, there are countless ways to slice the data to derive all manner of different rankings. Business strategy is needed to inform further evaluation, so this is where personalization comes into play.
As an example, our unweighted scores identified Cleveland, OH as one of the best markets so far in the funnel due to its property characteristics and "emergingness," but the market's long-term prospects for growth were relatively dubious (as indicated by its B&H Score). To reconcile this, we had to decide which metrics were most important for us and then weight them accordingly.
When we increased the weight of the B&H Score, Cleveland fell off the list along with several other of the best cashflow markets. Again, how exactly one should weight the variables depends on their specific business strategy.
In summary, on level one we were able to narrow down the list of four thousand markets to 120 using buy and hold filters, to 59 using market characteristics, and then to 32 using the Emerging Market Score.
Here are those 32 sorted alphabetically:
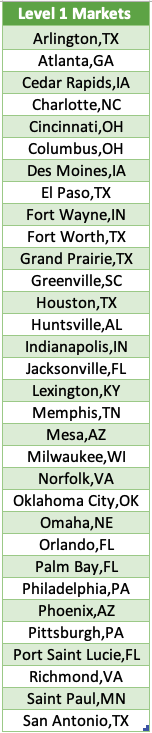
These were the markets that survived to level two.
One thing to note is that as the funnel gets narrower, the differentiation between markets by measure of high-level data points becomes less meaningful. Thus, rankings aside, we remained agnostic as to the “best” market at this stage.
The most important thing was that our filters had gotten us down from a very lot (four thousand) to a very few (32), which made a deep dive into the details in the proceeding levels of the funnel much more practical.
Level Two
In the first level, we narrowed down all national markets to just 32 that should be best suited for our strategy. In the second, we wanted to further evaluate these at these markets by…
- Dividing them into US regions
- Gauging their flipping potential
Geography is relevant because as we grow we want to take advantage of market similarities that make it easier to copy and paste our system. In the long term, putting all eggs in one regional basket probably has some downsides, but in the short to mid-term it makes sense to us to have a narrower geographical focus.
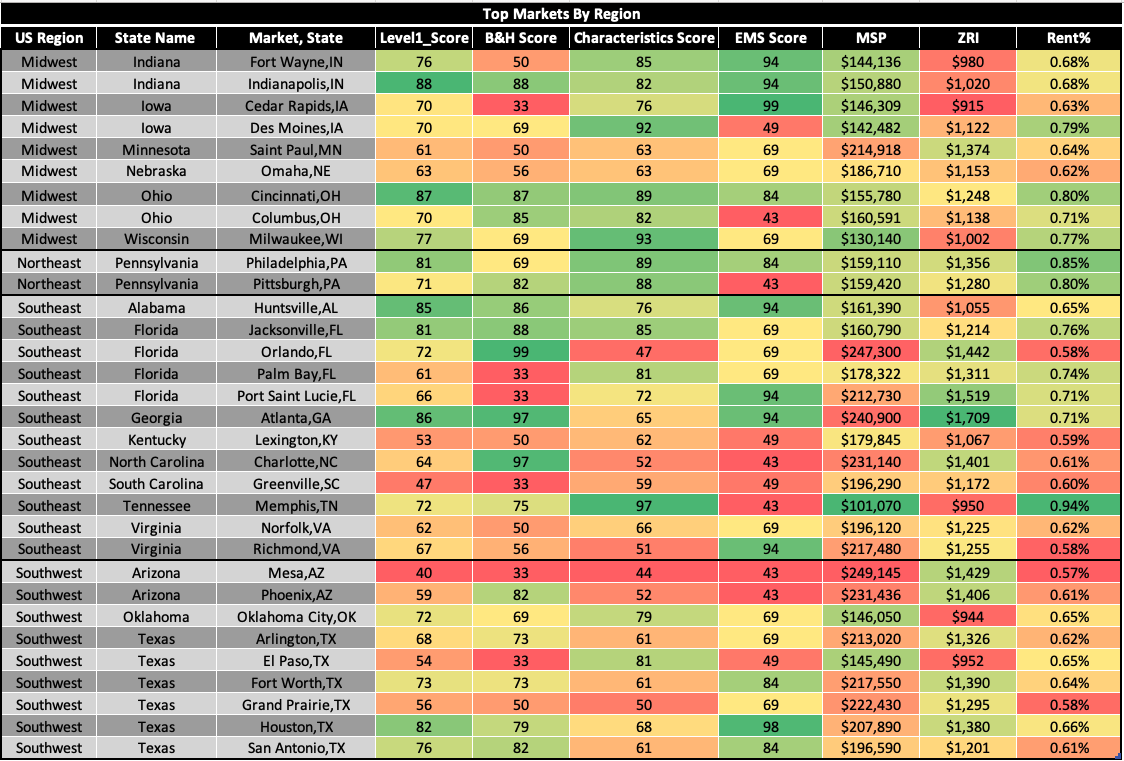
Here's a regional breakdown of the 32 markets from level one:
The same breakdown rolled up to a regional level:
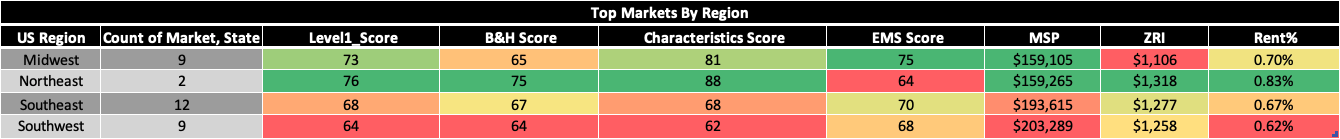
With this view, it was clear the Midwest was the best fit for our phase one acquisition. When we took a closer look, affordability (which gave it the highest EMS score), median sales price, and rent % (as a directional indicator of cash flow) were the three biggest drivers of its quality. The region had the biggest cluster of markets that were strong in these areas and was also close to the two northeast markets (Philadelphia and Pittsburgh) that also scored well.
While markets in the southeast (especially Florida) and the southwest (especially Texas) were also very interesting in terms of “emergingness” and market fundamentals, their relatively high median purchase price and relatively low expected cash flow and affordability made the Midwest a better area for our business strategy.
That said, the Florida markets also stood out as very interesting, and, if we were to look to expand to another region, Jacksonville would probably the first place we’d consider as a launching point.
The second criterion on this level was flipping potential. Since the BRRR method is basically just a flip with a different exit strategy, it made sense to evaluate the markets in terms of how suitable they are for rehab projects.
This was a lesser priority, so instead of reinventing the wheel on this one we just looked for a pre-made rank with good methodology and ended up finding these rankings from WalletHub. We joined those data onto the rest to take one last high-level look at our level one markets:
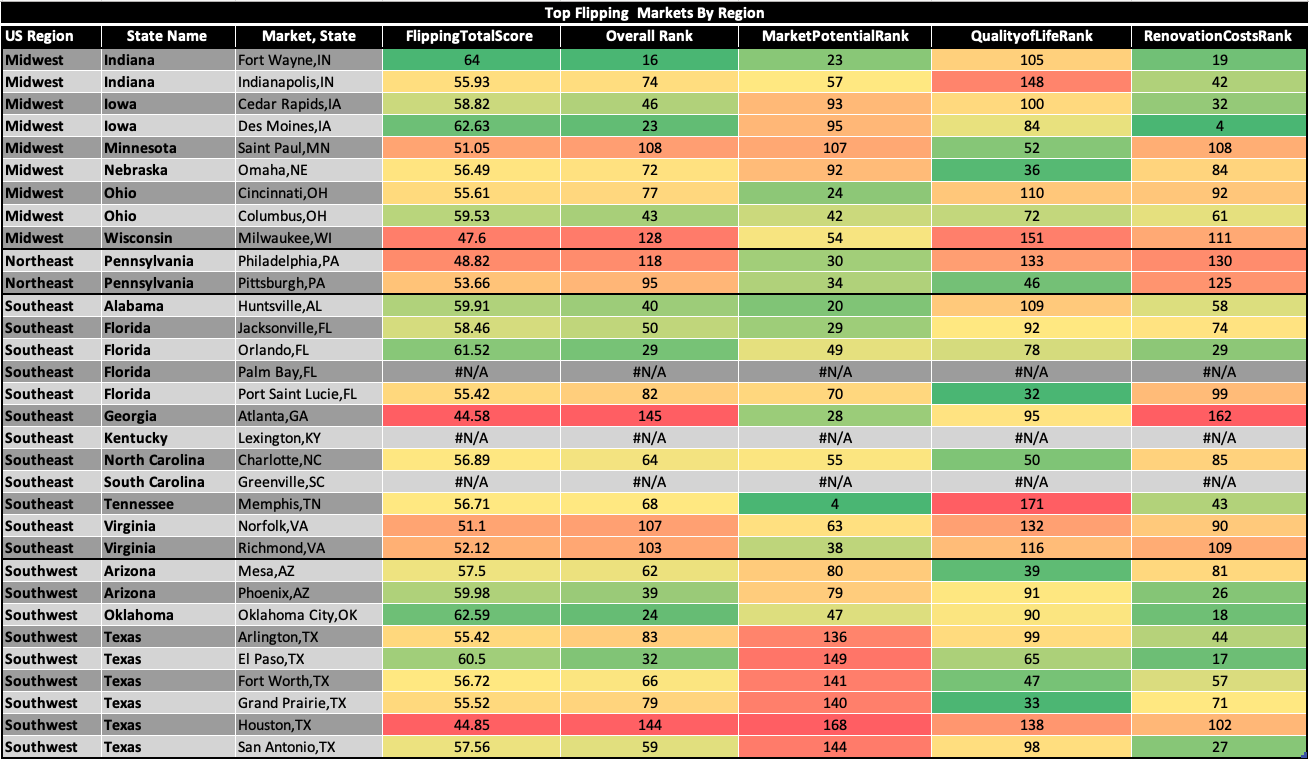
The most interesting thing that popped out here was that, according to Wallet Hub’s methodology, Fort Wayne, Des Moines, and Oklahoma City were the overall best of our filtered markets to do flips in. These data also indicated that in our target region, Milwaukee, Philadelphia, and Pittsburgh might be less favorable due to high renovation costs.
We didn’t put too much weight on these rankings, but they did give us a point of differentiation between a few markets that were otherwise quite similar.
With the takeaways from level two, we boiled down our top 32 markets to a top five, sorted alphabetically:
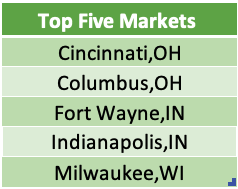
With this top five, we now had an investment zone for our deep dives on the next levels.
Levels Three and Four
While levels one and two were about looking at national markets from thirty thousand feet, levels three and four were all about diving into the details.
In level three, we analyzed the individual data points that constituted the composite scores to identify more nuanced strengths and weaknesses (and to eliminate bad data). We also did research to factor in more qualitative information like quality of life, government friendliness, type of residents, etc.
After factoring in what we dug up on this level, we ranked our top 5 accordingly:
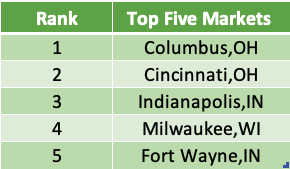
Here again was where personalization came in. While Cincinnati was a better market than Columbus by the pure measure of our data, we felt after level three that Columbus’s market fundamentals gave it the edge as a launching pad.
Level four was the final filter. This step was all about confirming our findings by reaching out to investors, real estate agents, and contractors in our target markets.
Generally, we wanted to make sure:
- Conclusions matched actual experiences and numbers on the ground
- There was sufficient inventory on hand
- We could identify target zip codes and neighborhoods within overall city limits that would work with our strategy
To confirm all this, we got a few MLS searches up and running and did deal analysis for a few weeks to collect data. We also used bigger pockets (what else? :-)) to network with local investors. When it was all said and done, we didn't come across anything to discourage us from getting started in the top market produced by the funnel: Columbus, OH.
So, that’s where we launched!

Activity is Virtue
For anyone who read to the end of this long post, I hope it was helpful!
There is one last thing that should be said. Identifying a market that suits your business strategy is undoubtably important. That said, it’s also important to not let too much deliberation turn into analysis paralysis.
Despite all the data we synthesized, we were nowhere near certain that Columbus was the best fit for us before we got started. Still, it was always the case that if it turned out to not be ideal due to some variable we overlooked or underweighted, it would be much easier to use these data to pivot elsewhere once we had experience building a business.
In that sense, confidence to get the ball rolling may well have been the most valuable thing we gained from the analysis.
