August 2025 Reno NV Market Data - What Investors Should Watch
📉 TLDR: The market has softened, and sellers are giving up.
📍 Washoe County – August 2025
-
Homes Sold: –11.3% YoY
-
Months of Inventory: 3.6 → highest August in more than a decade
📍 Reno – August 2025
-
Days on Market: 31 → double last year, highest August in more than a decade
-
Unsold Listings: 11% of active homes came off the market without selling, indicating seller fatigue
🔍 Key Investor Takeaways
1. Prices Are Flat over 3+ years
2. Buyer Activity Is Way Down
-
Longer term sales trend, considering the first 8 months of the years:
Jan-Aug for 2023–2025 = 11,117 total homes sold
Jan-Aug for 2020-2022 = 14,663 → 32% higher
Jan-Aug for 2017-2019 = 15,929 → 43% lower
-
That slowdown = less competition and more negotiability.
3. Supply Is Rising… Even With Fewer Listings
-
New listings hit a record low, but inventory still rose - because homes aren’t selling
-
Months Of Inventor now 3.6 → highest August in more than a decade for both Reno and Washoe overall
🎯 Best Investor Plays Right Now
-
Older Listings: 30+ DOM could mean more flexible sellers
-
Withdrawn/Expireds: 11% pulled off market → direct-to-seller outreach could be gold
-
Fall Timing: As we move into the Fall/Winter months, seller pessimism may rise, improving ability to negotiate
Most Popular Reply

The Reno market does appear to have slowed down a bit this year, but honestly numbers are not totally unusual for the time of year.
e.g. monthly absorption rates are down YoY from 33.4% to 29.1%
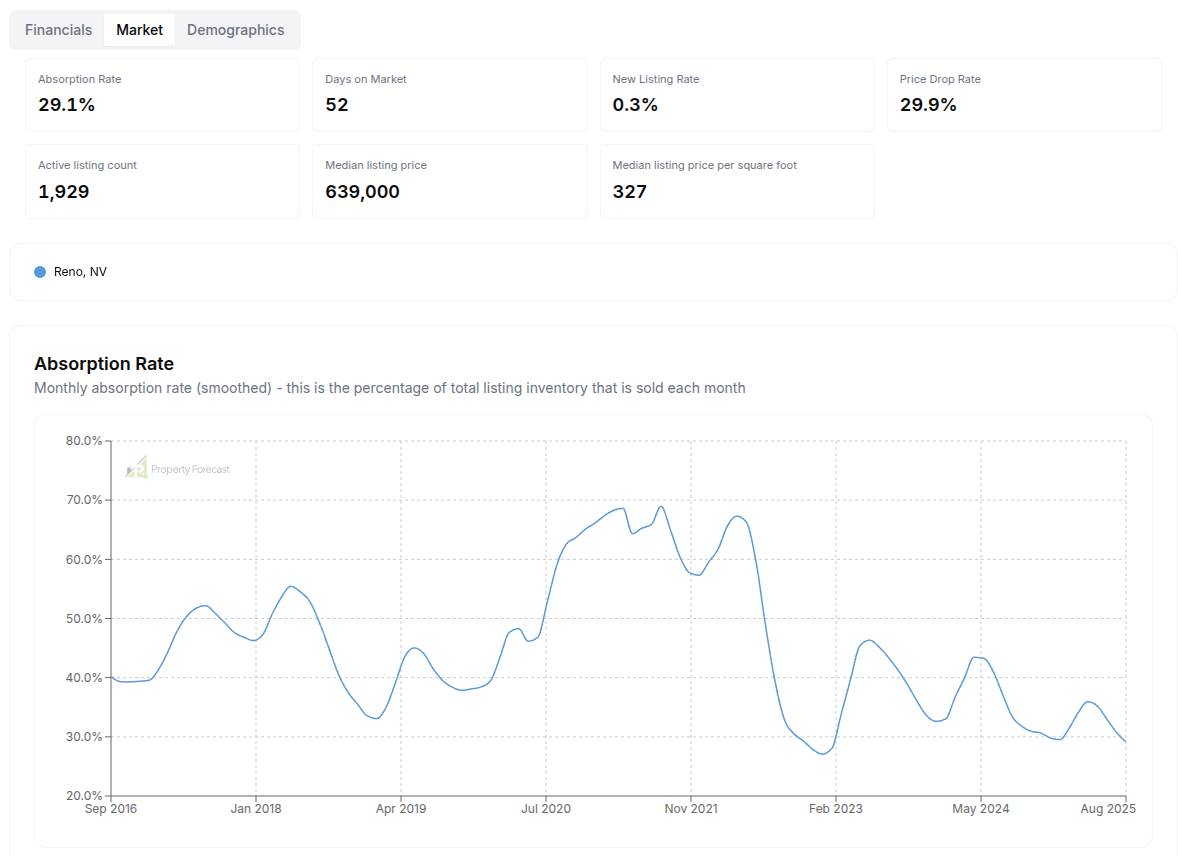
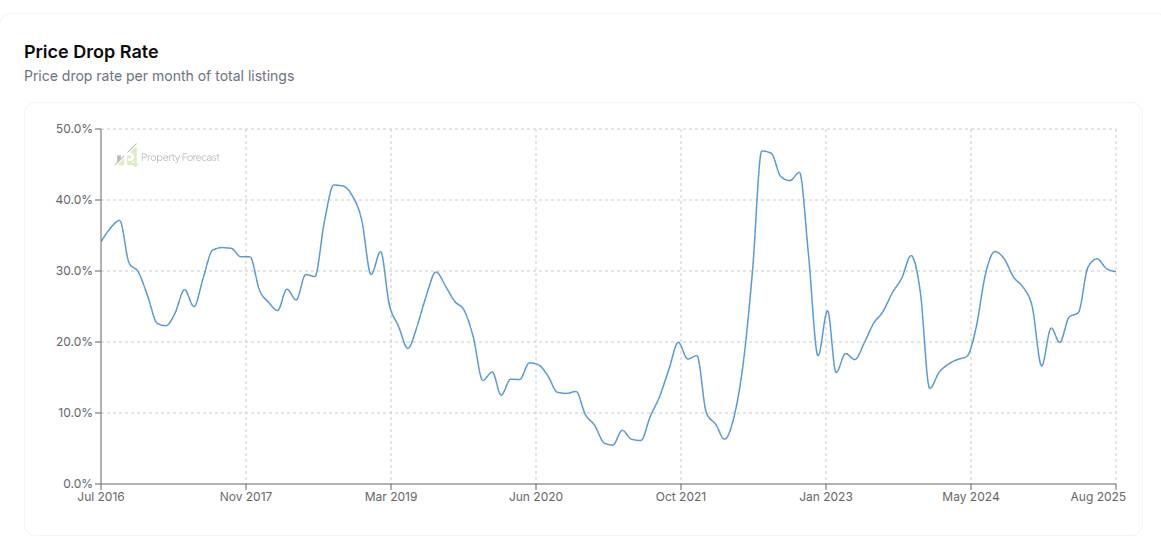
But other key stats like price drop rate are look typical and are actually slightly better YoY (down from 31.7% last August to 29.9% this year)