$1,245,000
Investment Summary
- Monthly Cash Flow
- -$3,907
- Cap Rate
- 1.9%
- Cash-on-Cash Return
- -16.4%
- Debt Coverage Ratio
- 0.34
- Internal Rate of Return (5 years)
- -11.8%
Cash Flow
Net Operating Income (NOI) minus mortgage payments.
Calculation:
NOI - Mortgage Payments
Cap Rate (Market Value)
Capitalization Rate is a rate of return that compares the yearly Net Operating Income (NOI) to the market value.
Calculation:
NOI / Market Value
Cash-on-Cash Return (CoC)
Annual Cash Flow / Cash Invested
Calculation:
Annual cash flow divided by initial cash invested.
Debt Coverage Ratio (DCR)
Net Operating Income (NOI) divided by total debt payments.
Calculation:
NOI / Total Debt Payments
Internal Rate of Return (IRR)
A metric for assessing profitability over time. IRR is the discount rate at which the net present value (NPV) of all future cash flows (positive and negative) from an investment equals zero — including both periodic cash flow (such as rent) and a projected sale at the end of the holding period. It represents the expected annualized return, accounting for income, expenses, and the recovery of capital through a future sale.
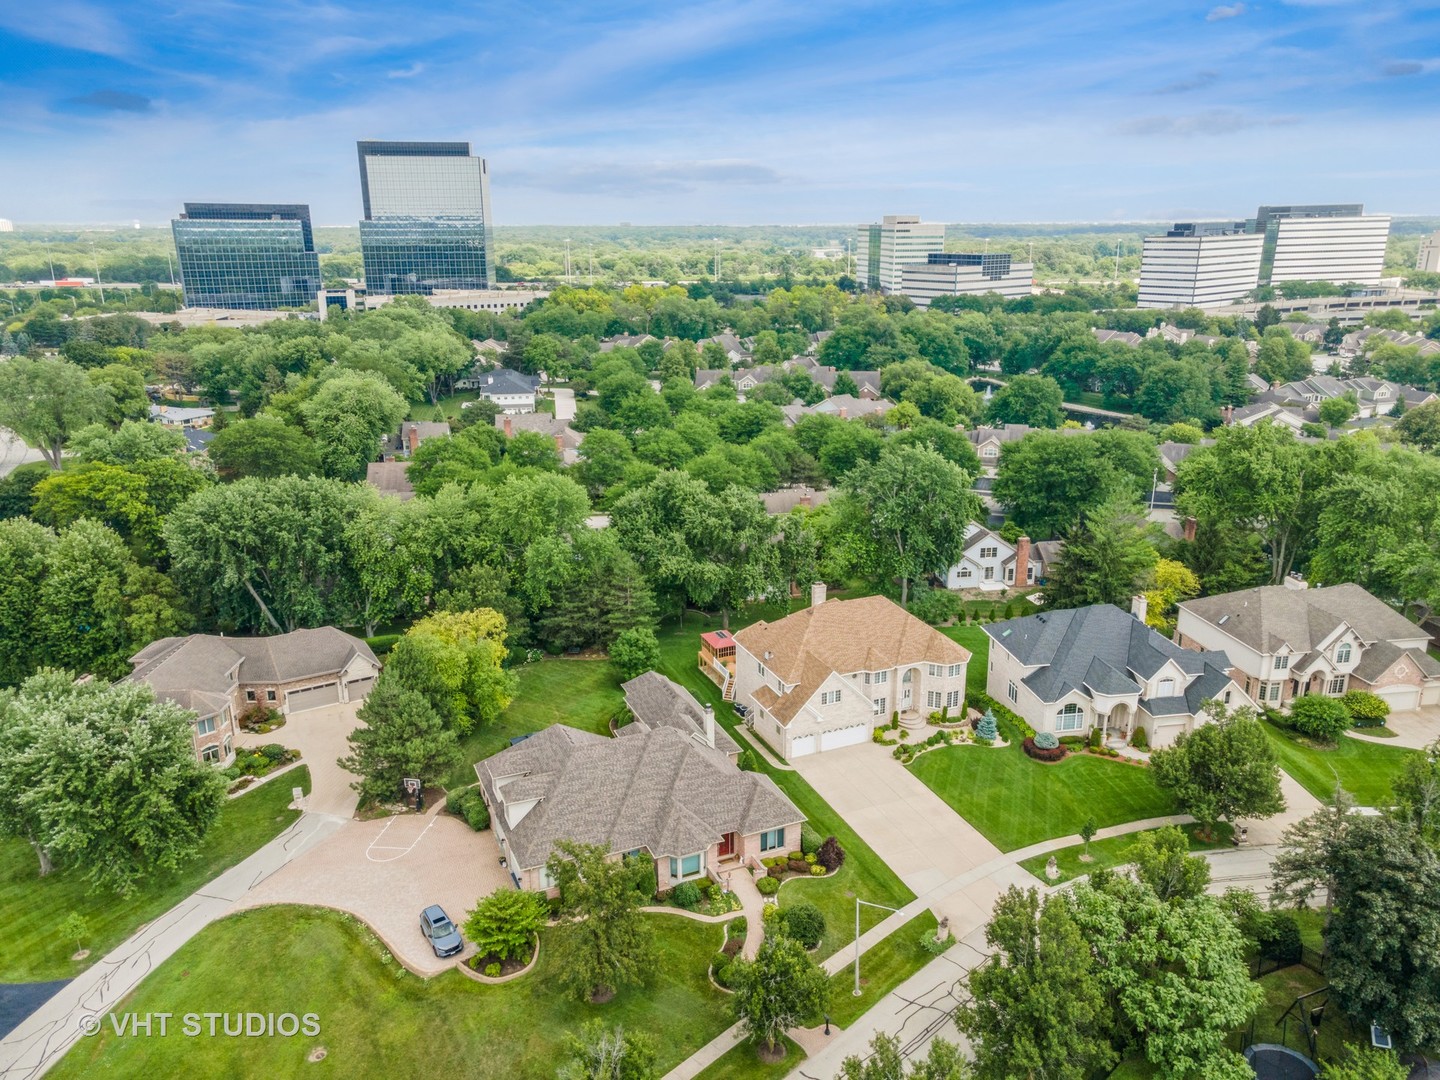
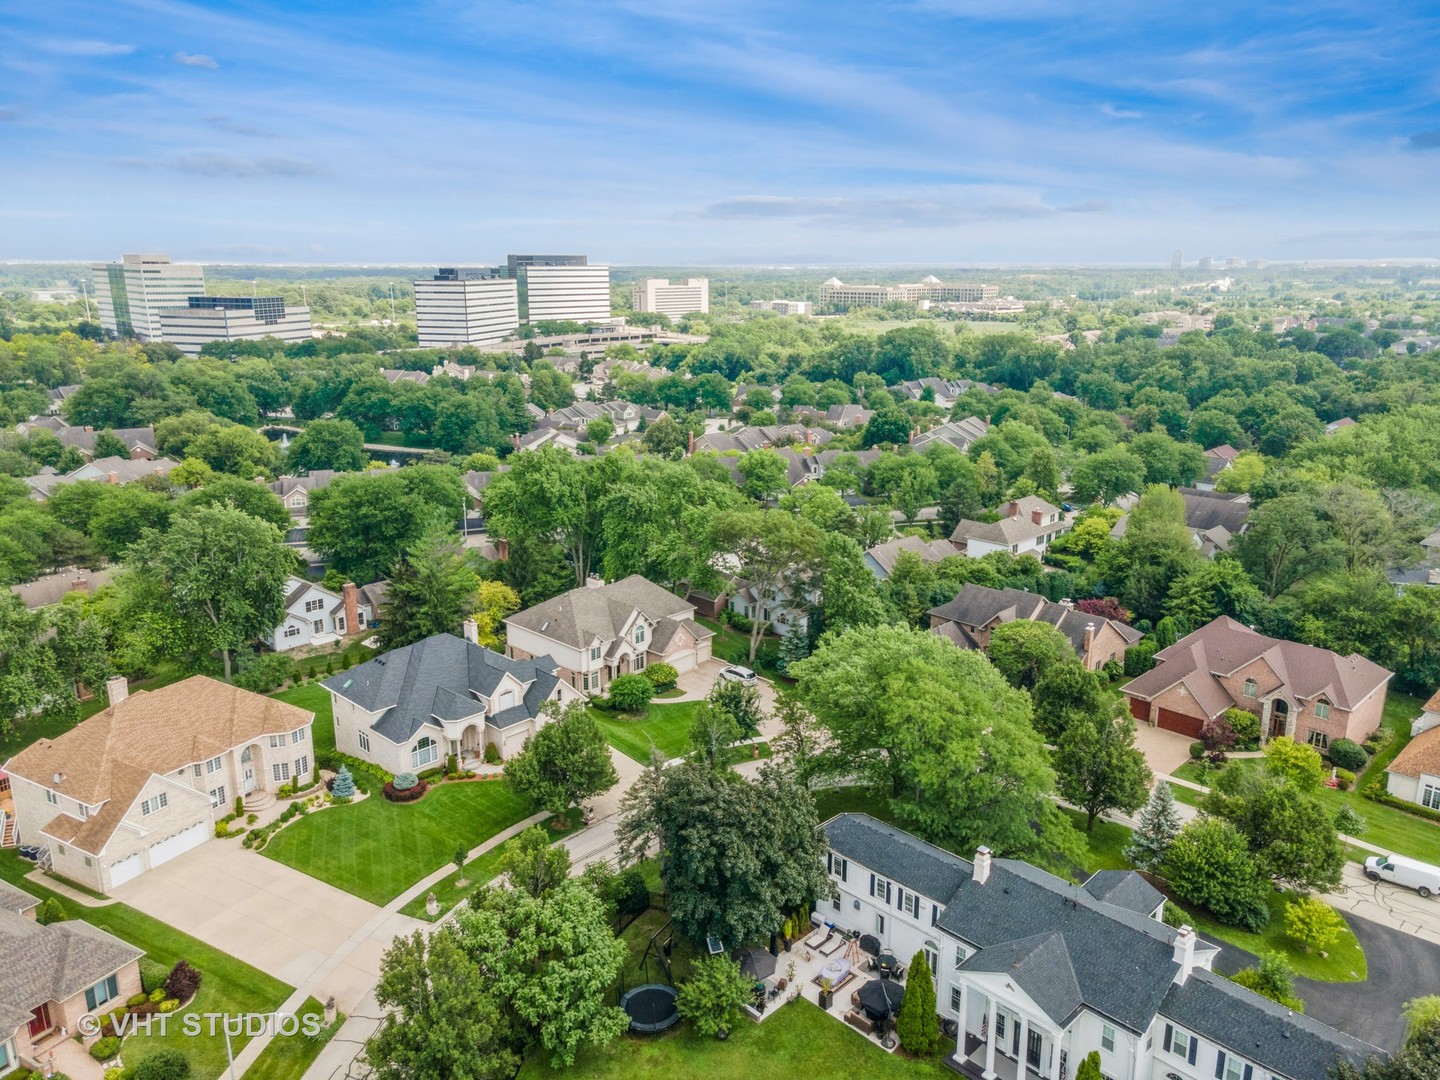
Property Description
Stately All-Brick Colonial in a Serene Setting! THIS HOME IS TRULY ONE OF A KIND. A rare opportunity to own a custom-built, all-brick Colonial that masterfully blends timeless architecture with refined finishes and artistic design. Set on a professionally landscaped lot in Lexington Fields Estates, this 5-bedroom, 3.5 bath home stuns from first glance with its symmetrical facade, gabled rooflines, copper-tone awnings, and grand arched entry framed by stained-glass windows and decorative columns. Step inside to soaring ceilings, a sweeping staircase, sun-drenched foyer and be awestruck by a custom wall mural by renowned Chicago artist. Throughout the main living spaces, you'll find elegant Venetian plaster walls, adding warmth, texture and depth-bringing a rich, polished finish that elevates every room. The gourmet kitchen seamlessly blends functionality with warmth, offering a thoughtfully designed space ideal for both everyday living and entertaining. At the heart of the kitchen is a spacious central island with a prep sink and gas cooktop- this place is an entertainer's dream! Designed with both style and practicality in mind, the kitchen features custom pull-out pantry drawers and the deep sliding shelves which elevate organization and functionality for the home chef. Additional highlights include an adjacent wine rack and built-in shelving, as well as a dedicated beverage or bar station. The great room centers around a cozy fireplace and opens to a formal living room through French doors-ideal for refined entertaining. A formal dining room is perfectly positioned off the kitchen for holidays and gatherings. The main level in-law suite allows for multi-generational living at its finest. Upstairs, the luxurious primary ensuite exudes comfort and elegance, featuring tray ceilings, a bold diamond-patterned accent wall, plush carpeting and sunlit window. Complementing the suite are two generously sized bedrooms, each with its own walk-in-closet-designed with both comfort and sophistication in mind. Both bathrooms offer a spa-inspired retreat with indulgent Jacuzzi tubs, and sleek walk-in showers. It's a space designed for both relaxation and refined style. A full unfinished basement offers endless potential for additional living space, media room, gym or workshop which is ready to be tailored to your vision. Step outside to discover a true outdoor oasis. The home is surrounded by lush gardens; mature fruit trees and a winding sidewalk path encircles the home. Entertain your family and guests on the concrete patio with fire pit right off the kitchen and great room. Homes with this level of craftsmanship, artistic flair, and luxury detail are rarely available. Don't miss your chance-schedule your private showing today!
Build Your Team
Quickly find investor-friendly professionals who can help you succeed in real estate investing at any stage of the investing journey.


Agents
Match with investor-friendly agents who can help you find, analyze, and close your next deal


Lenders
Get the best funding…find investor-friendly lenders who specialize in your deal strategy


Property Managers
Transition to passive investing. Find a trusted property management partnership that lasts.


Tax Pros & Accountants
Taxes and financial reporting made easy—find experts to create tax savings strategies, file taxes, and more
Location
Property Details
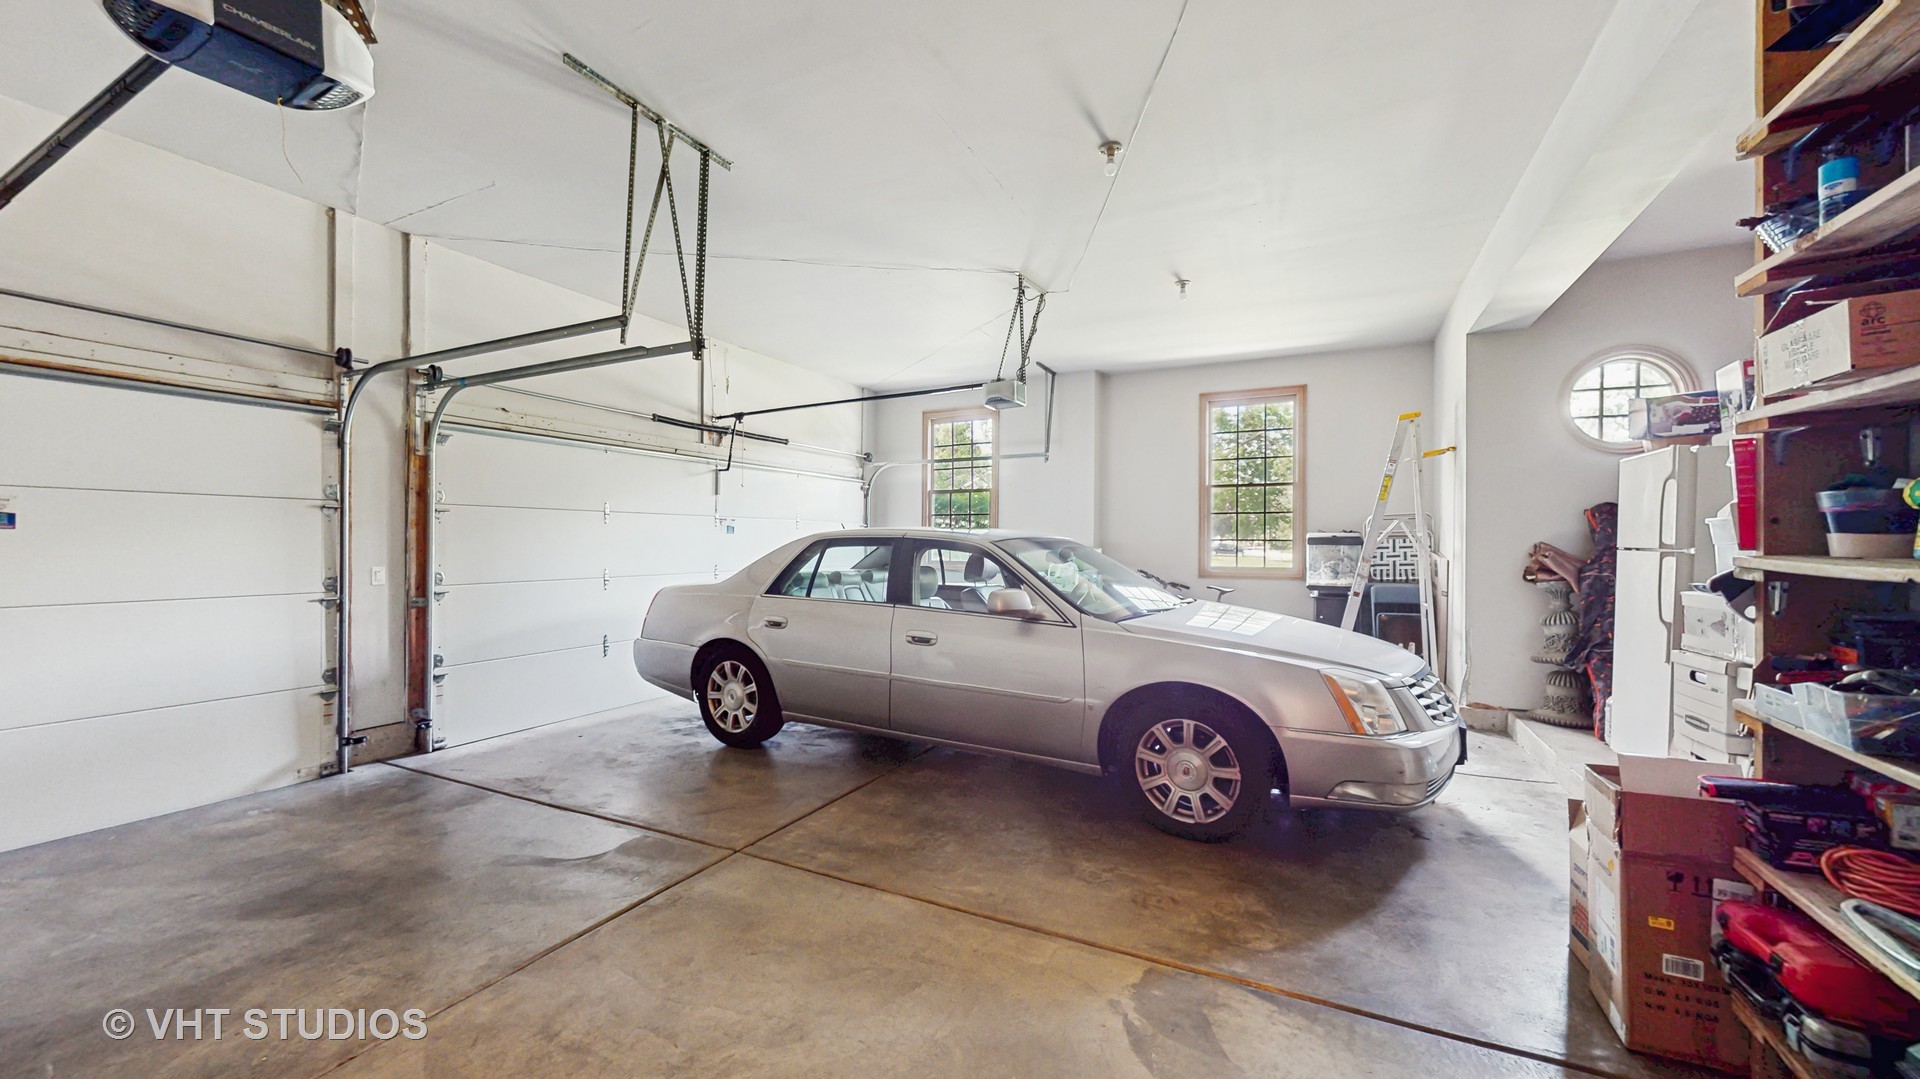
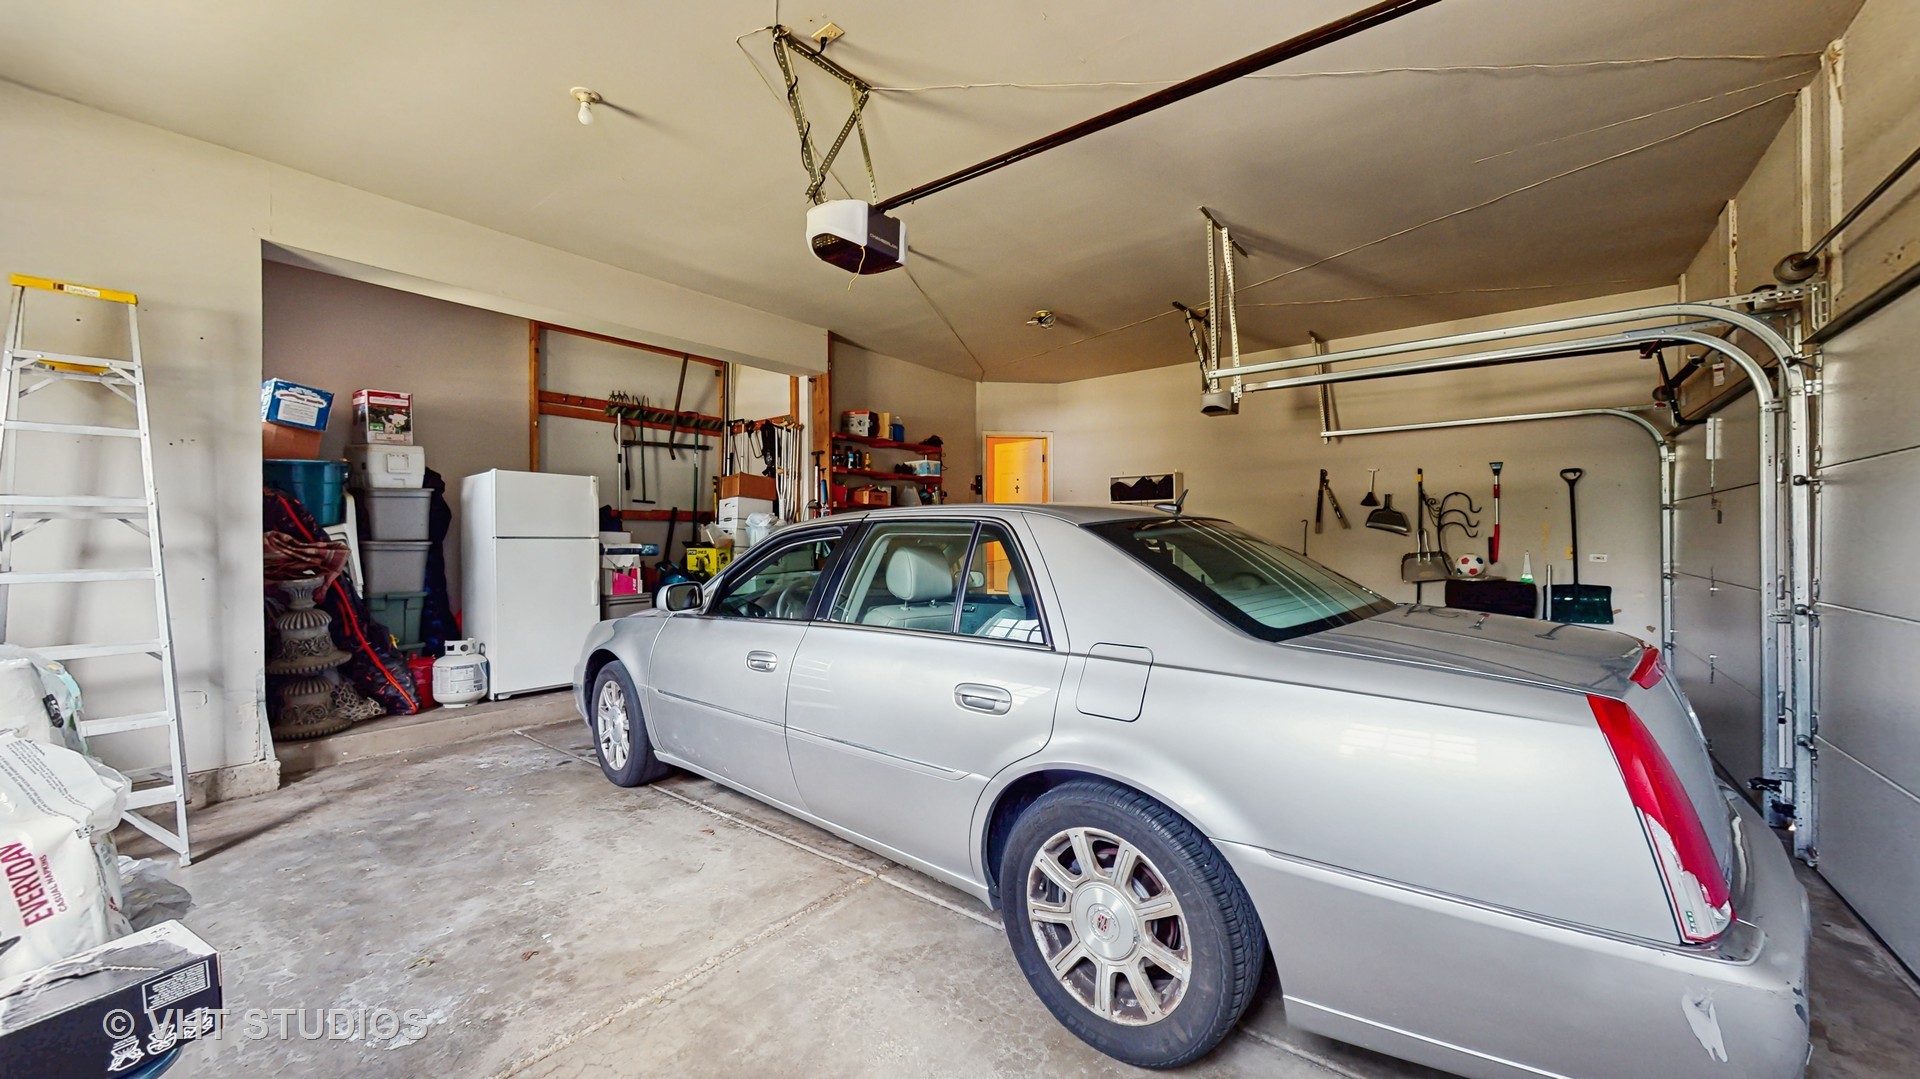
Parking
- Description: Attached Garage
- Details: Concrete, Garage Door Opener, Garage, On Site, Attached, Driveway
- Garage Spaces: 3
- Spaces Total: 8
Bedroom Information
- # of Bedrooms: 5
Bathroom Information
- # of Baths (Full): 3
- # of Baths (Partial): 1
- # of Baths (Total): 4.0
Interior Features
- # of Rooms: 9
- # of Stories: 2
- Basement: Yes
- Basement Description: Sump Pump, Unfinished, Concrete, Storage Space, Full
- Fireplace: Yes
Exterior Features
- Exterior Walls Materials: Masonry
- Foundation: Concrete Perimeter
- Roof Material: Asphalt
HOA
- Has HOA: Yes
- HOA Fee: $200/annually
Land Information
- Land Use: Residential
- Land Use Subtype: Single Family Residential
Lot Information
- Parcel ID: 0724117006
- Lot Size: 0 sqft
Property Information
- Property Type: Single Family Residence
- Year Built: 1997
Tax Information
- Annual Tax: $17,376
Utilities
- Water & Sewer: Public
- Heating: Natural Gas, Forced Air
- Cooling: Ceiling Fan(s), Central Air
Location
- County: Cook
Listing Details
Investment Summary
- Monthly Cash Flow
- -$3,907
- Cap Rate
- 1.9%
- Cash-on-Cash Return
- -16.4%
- Debt Coverage Ratio
- 0.34
- Internal Rate of Return (5 years)
- -11.8%
Cash Flow
Net Operating Income (NOI) minus mortgage payments.
Calculation:
NOI - Mortgage Payments
Cap Rate (Market Value)
Capitalization Rate is a rate of return that compares the yearly Net Operating Income (NOI) to the market value.
Calculation:
NOI / Market Value
Cash-on-Cash Return (CoC)
Annual Cash Flow / Cash Invested
Calculation:
Annual cash flow divided by initial cash invested.
Debt Coverage Ratio (DCR)
Net Operating Income (NOI) divided by total debt payments.
Calculation:
NOI / Total Debt Payments
Internal Rate of Return (IRR)
A metric for assessing profitability over time. IRR is the discount rate at which the net present value (NPV) of all future cash flows (positive and negative) from an investment equals zero — including both periodic cash flow (such as rent) and a projected sale at the end of the holding period. It represents the expected annualized return, accounting for income, expenses, and the recovery of capital through a future sale.
Purchase Details
Purchase PriceThe price paid for the property. Purchase price:
| $1,245,000 |
|---|---|
Amount FinancedThe amount of the purchase financed through a loan. Amount financed:
| -$996,000 |
Down paymentThe initial payment made towards the purchase. Down payment:
| $249,000 |
Closing CostsFees and expenses associated with purchasing a property, typically ranging from 2% to 5% of the home’s purchase price, paid at the end of a home purchase to cover services like lending, title transfer, and taxes. Closing costs:
| $37,350 |
Rehab CostsCosts incurred to repair or improve the property, including: roof, flooring, exterior siding, kitchen, exterior paint, bathrooms, etc. Rehab costs:
| $0 |
Initial Cash InvestedThe total initial cash invested in the property. Calculation:Down payment + Buying costs + Rehab costs Initial cash invested:
| $286,350 |
Square Feet (SQFT)The total square footage of the property. Square feet:
| 5,451 |
Cost Per Square FootCost per square foot of the property. Calculation:Purchase Price / Square Feet Cost per square foot:
| $228 |
Monthly Rent Per Square FootMonthly rent divided by the number of square feet. This ratio helps investors compare rental income efficiency across properties, markets, and unit sizes Calculation:Monthly Rent / Square Feet Monthly rent per square foot:
| $0.92 |
Financing Details
Loan AmountThe total sum of money borrowed from a lender to finance a property purchase. Calculation:Purchase Price - Down Payment
Loan amount:
| $996,000 |
|---|---|
Loan to Value Ratio (LTV)Loan amount divided by the market value of the property. Calculation:Loan Amount / Market Value
Loan to value ratio:
| 80.0% |
Loan TypeThe type of loan (e.g., fixed, adjustable).
Loan type:
| Amortizing |
TermThe loan repayment period in years.
Term:
| 30 years |
Interest RateThe percentage a lender charges on the borrowed amount of a loan, determining the cost of borrowing money.
Interest rate:
| 5.875% |
Principal & Interest (PI)The principal is the portion of the loan payment that reduces the loan balance. The interest is the lender's charge for borrowing money. Calculation:(P * r * (1 + r) ** n) / ((1 + r) ** n - 1) Where:
P = Loan amount (principal)
Principal & interest:
| $5,892 |
Property TaxesAnnual taxes levied by local governments on real estate properties. These taxes fund public services like schools, roads, and emergency services.
Property tax:
| $1,448 |
InsuranceThe costs for insurance coverage to protect against financial losses due to risks like fire, natural disasters, theft, liability, or tenant-related damages. Calculation:Assumes 7% of gross rental income, unless insurance rates are specified.
Insurance:
| $350 |
Private Mortgage Insurance (PMI)A fee that borrowers pay when they take out a conventional loan with a loan-to-value (LTV) ratio above 80%.
Private mortgage insurance (PMI):
| $0 |
Monthly PaymentThe fixed amount a borrower pays each month to repay a loan. It typically includes principal and interest (P&I) and may also cover property taxes, insurance, HOA fees, and PMI if escrowed. Monthly payment:
| $7,690 |
Operating Income
| % Rent | Monthly | Yearly | |
|---|---|---|---|
Gross RentThe total rental income received from tenants before deducting any expenses. Includes base rent, late fees, pet fees, parking fees, and other recurring charges.
Gross rent:
| $5,000 | $60,000 | |
Vacancy LossExpected loss of rent due to vacancies.
Vacancy loss:
(6%)
| 6% | -$300 | -$3,600 |
Operating IncomeGross rental income minus vacancy loss. Calculation:Gross rent - Vacancy loss
Operating income:
| $4,700 | $56,400 |
Operating Expenses
| % Rent | Monthly | Yearly | |
|---|---|---|---|
Property TaxesAnnual taxes levied by local governments on real estate properties. These taxes fund public services like schools, roads, and emergency services. | 29% | -$1,448 | -$17,376 |
InsuranceThe costs for insurance coverage to protect against financial losses due to risks like fire, natural disasters, theft, liability, or tenant-related damages. Calculation:Assumes 7% of gross rental income, unless insurance rates are specified. | 7% | -$350 | -$4,200 |
Property ManagementThe costs associated with hiring a property manager to handle the day-to-day operations of a rental property. Includes management fees, leasing fes, eviction fees, etc. Calculation:Assumes 8% of gross rental income. | 8% | -$400 | -$4,800 |
Repairs & MaintenanceOngoing costs for routine upkeep and minor fixes needed to keep a property in good working condition. Calculation:Assumes 5% of gross rental income. Varies by property age and condition. | 5% | -$250 | -$3,000 |
Capital ExpensesLarge, infrequent costs for major improvements or replacements, like a new roof, HVAC system, or appliances. Calculation:Assumes 5% of gross rental income. Varies by property age. | 5% | -$250 | -$3,000 |
HOA FeesRegular dues paid to a Homeowners Association for community maintenance, amenities, and management. Similar fees include: Condo Association Fees, Co-op Maintenance Fees, etc. | 0% | -$17 | -$204 |
Operating ExpensesRecurring costs required to maintain and manage a rental property, including property taxes, insurance, maintenance, repairs, utilities (if paid by the owner), property management fees, and other day-to-day expenses. Calculation:Insurance + Property Taxes + Property Management + Repairs & Maintenance + Capital Expenditures + HOA Fees | 54% | -$2,715 | -$32,580 |
Cash Flow
| Monthly | Yearly | |
|---|---|---|
Net Operating Income (NOI)The income generated from a property after deducting all operating expenses but before deducting mortgage payments, taxes, and capital expenditures. Calculation:Gross Operating Income - Operating Expenses
Net operating income:
| $1,985 | $23,820 |
Mortgage PaymentThe fixed amount a borrower pays each month to repay a loan. It typically includes principal and interest (P&I) and may also cover property taxes, insurance, HOA fees, and PMI if escrowed. | -$5,892 | -$70,704 |
Cash FlowNet Operating Income (NOI) minus mortgage payments. Calculation:NOI - Mortgage Payments | -$3,907 | -$46,884 |