Cook County Investment Properties for Sale
Browse homes for sale and investment properties in Cook County. Refine your search by price, property type, or more.
Best cash flowing properties in Cook County
Active
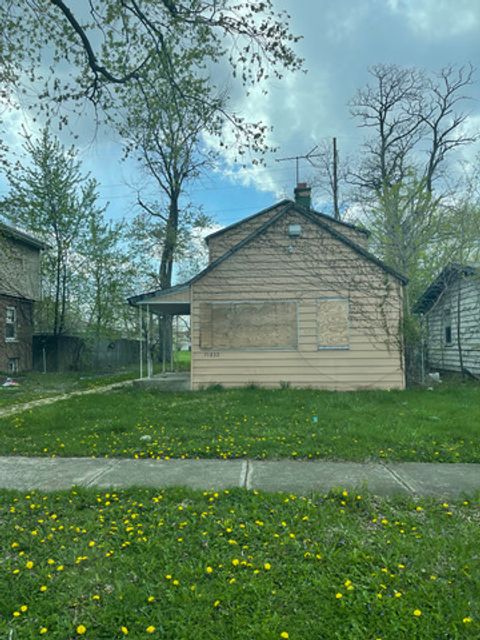
$55,000
3
bds
|
1
ba
|
990
sqft
|
built
1925
15032 Winchester Ave, Harvey, IL 60426
$868
Cash flow
18.4%
Cash-on-Cash Return
18.9%
Cap rate
2.7%
Rent to Value Ratio
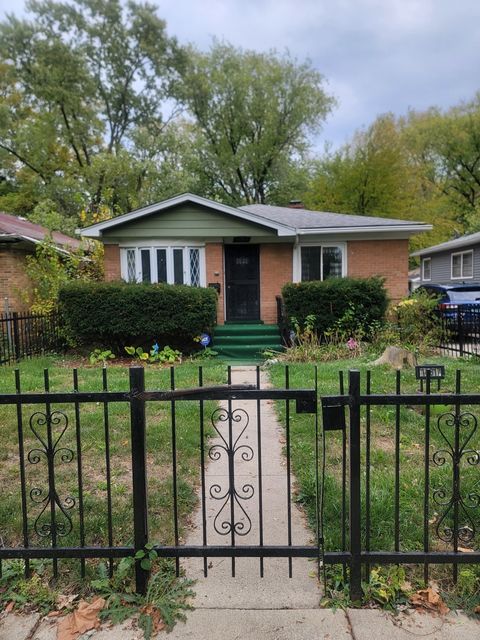
Active
$110,000
3
bds
|
1
ba
|
946
sqft
|
built
1960
14817 Lexington Ave, Harvey, IL 60426
$719
Cash flow
34.1%
Cash-on-Cash Return
13.5%
Cap rate
1.6%
Rent to Value Ratio
3,896 out of 4,771 properties for sale in Cook County
Limited Results Shown
Create a free account, or log in to reveal all property listings and enjoy the complete experience.

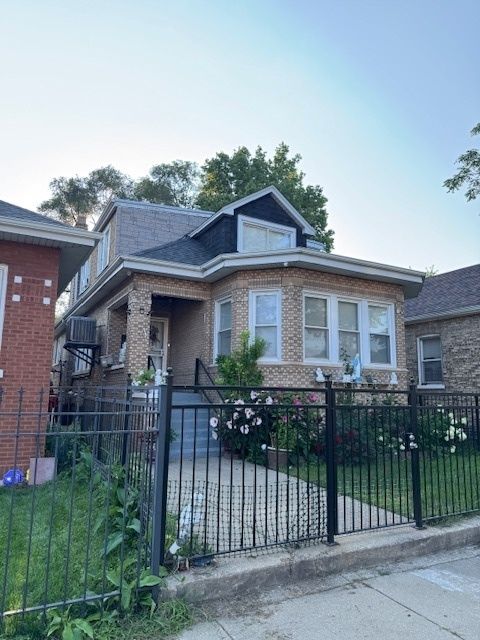
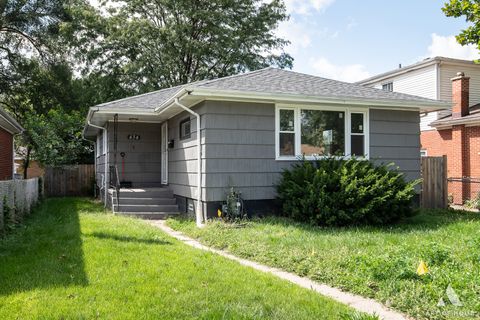
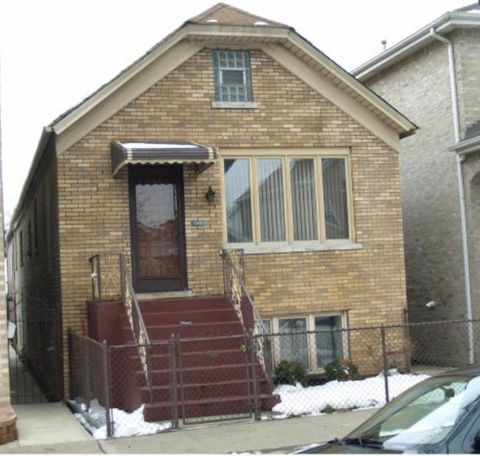
Active
$142,500
5
bds
|
3
ba
|
1,500
sqft
|
built
1927
11949 S Lafayette Ave, Chicago, IL 60628
$653
Cash flow
23.9%
Cash-on-Cash Return
11.2%
Cap rate
1.4%
Rent to Value Ratio
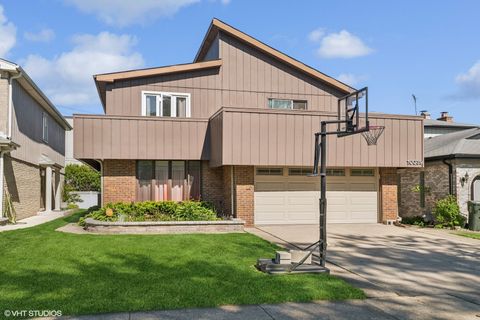
Active
$725,000
4
bds
|
3
ba
|
3,096
sqft
|
built
1976
10039 La Crosse Ave, Skokie, IL 60077
$-1,643
Cash flow
-11.8%
Cash-on-Cash Return
3.0%
Cap rate
0.6%
Rent to Value Ratio

Active
$189,000
3
bds
|
3
ba
|
1,323
sqft
|
built
1983
281 Hoxie Ave, Calumet City, IL 60409
$693
Cash flow
19.1%
Cash-on-Cash Return
10.1%
Cap rate
1.2%
Rent to Value Ratio

Active
$340,000
4
bds
|
4
ba
|
0
sqft
|
built
1912
7601 S Morgan St, Chicago, IL 60620
$-581
Cash flow
-8.9%
Cash-on-Cash Return
3.6%
Cap rate
0.6%
Rent to Value Ratio

Active
$325,000
4
bds
|
3
ba
|
2,700
sqft
|
built
1913
7339 S Evans Ave, Chicago, IL 60619
$122
Cash flow
2.0%
Cash-on-Cash Return
6.1%
Cap rate
0.8%
Rent to Value Ratio
Active
$305,000
5
bds
|
4
ba
|
1,848
sqft
|
built
1930
6922 S Campbell Ave, Chicago, IL 60629
$-80
Cash flow
-1.4%
Cash-on-Cash Return
5.4%
Cap rate
0.8%
Rent to Value Ratio
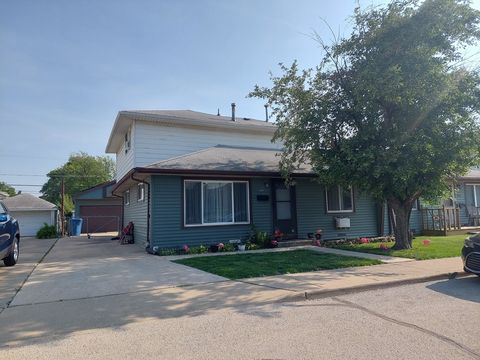
Active
$184,000
3
bds
|
2
ba
|
1,200
sqft
|
built
1961
434 Mackinaw Ave, Calumet City, IL 60409
$38
Cash flow
1.1%
Cash-on-Cash Return
5.9%
Cap rate
1.0%
Rent to Value Ratio
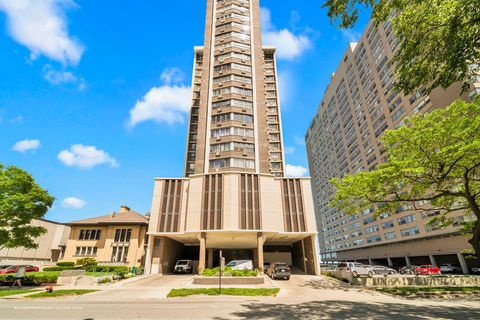
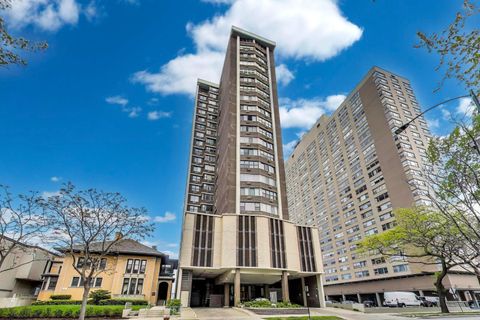
Active
$215,000
2
bds
|
2
ba
|
1,200
sqft
|
built
1970
6325 N Sheridan Rd, Chicago, IL 60660
$-551
Cash flow
-13.4%
Cash-on-Cash Return
2.6%
Cap rate
1.2%
Rent to Value Ratio

Active
$450,000
3
bds
|
2
ba
|
1,582
sqft
|
built
1946
7805 W Farragut Ave, Chicago, IL 60656
$-568
Cash flow
-6.6%
Cash-on-Cash Return
4.2%
Cap rate
0.6%
Rent to Value Ratio
Active
$399,900
3
bds
|
2
ba
|
1,389
sqft
|
built
1961
10624 Lawler Ave, Oak Lawn, IL 60453
$-737
Cash flow
-9.6%
Cash-on-Cash Return
3.5%
Cap rate
0.7%
Rent to Value Ratio
Active
$50,000
1
bds
|
1
ba
|
0
sqft
|
built
1978
17005 Albany Ave, Hazel Crest, IL 60429
$664
Cash flow
15.5%
Cash-on-Cash Return
15.9%
Cap rate
3.2%
Rent to Value Ratio
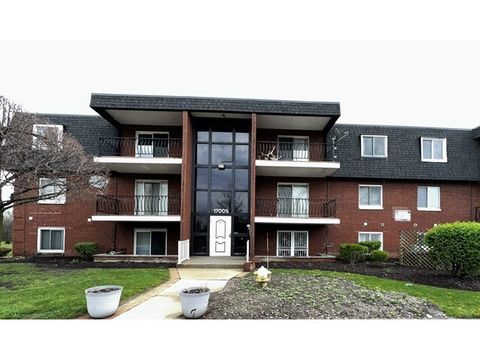
Active
$169,500
1
bds
|
1
ba
|
814
sqft
|
built
1974
6325 N Sheridan Rd, Chicago, IL 60660
$-361
Cash flow
-11.1%
Cash-on-Cash Return
3.1%
Cap rate
1.1%
Rent to Value Ratio
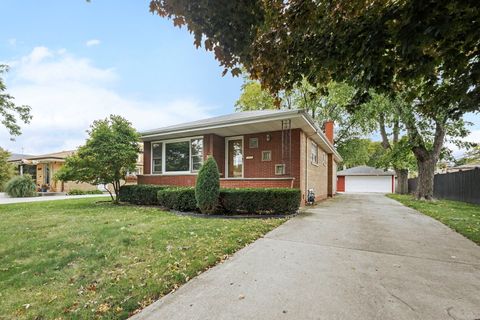
Active
$274,900
4
bds
|
2
ba
|
1,246
sqft
|
built
1952
4421 W 87th St, Hometown, IL 60456
$-95
Cash flow
-1.8%
Cash-on-Cash Return
5.3%
Cap rate
0.8%
Rent to Value Ratio
Active
$445,000
3
bds
|
4
ba
|
4,000
sqft
|
built
1890
3727 S Lowe Ave, Chicago, IL 60609
$-203
Cash flow
-2.4%
Cash-on-Cash Return
5.1%
Cap rate
0.8%
Rent to Value Ratio
Active
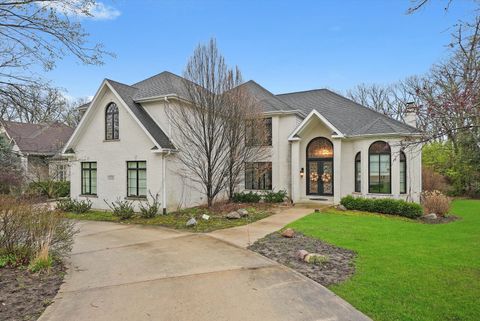
$838,000
5
bds
|
4
ba
|
2,634
sqft
|
built
2006
1712 Woodland Ave, Park Ridge, IL 60068
$-2,018
Cash flow
-12.6%
Cash-on-Cash Return
2.8%
Cap rate
0.5%
Rent to Value Ratio
Active
$1,390,000
4
bds
|
5
ba
|
5,000
sqft
|
built
2002
11735 Orchard Rd, Willow Springs, IL 60480
$-4,895
Cash flow
-18.4%
Cash-on-Cash Return
1.5%
Cap rate
0.4%
Rent to Value Ratio
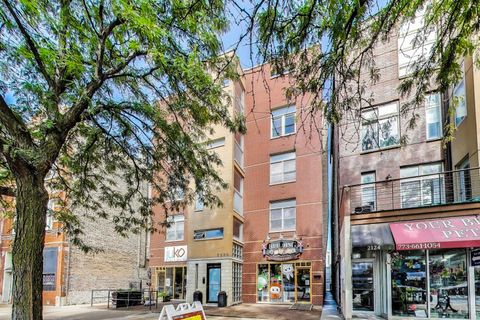
Active
$565,000
3
bds
|
2
ba
|
1,600
sqft
|
built
2005
2130 W Division St, Chicago, IL 60622
$-1,275
Cash flow
-11.8%
Cash-on-Cash Return
3.0%
Cap rate
0.6%
Rent to Value Ratio

Active
$296,500
3
bds
|
2
ba
|
1,900
sqft
|
built
1979
181 W 28th St, South Chicago Heights, IL 60411
$-362
Cash flow
-6.4%
Cash-on-Cash Return
4.2%
Cap rate
0.7%
Rent to Value Ratio

Active
$420,000
5
bds
|
2
ba
|
0
sqft
|
built
1913
5919 S Rockwell St, Chicago, IL 60629
$-1,096
Cash flow
-13.6%
Cash-on-Cash Return
2.5%
Cap rate
0.4%
Rent to Value Ratio
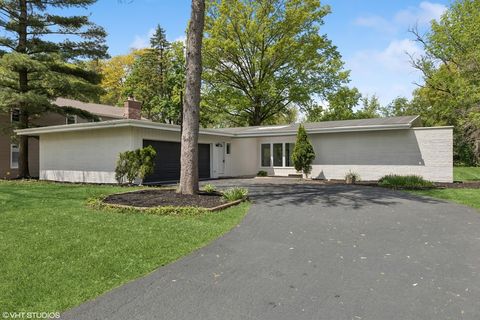
Active
$345,000
3
bds
|
3
ba
|
1,900
sqft
|
built
1964
20534 Arcadian Dr, Olympia Fields, IL 60461
$-528
Cash flow
-8.0%
Cash-on-Cash Return
3.8%
Cap rate
0.8%
Rent to Value Ratio

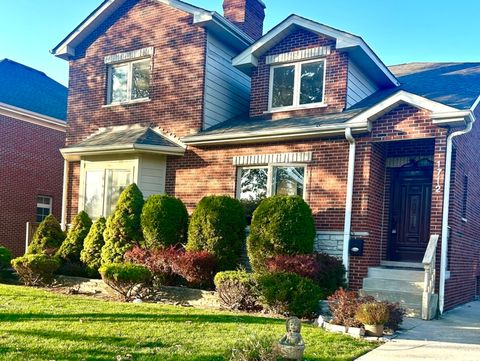
Active
$379,999
4
bds
|
3
ba
|
1,552
sqft
|
built
1926
5544 S California Ave, Chicago, IL 60629
$-595
Cash flow
-8.2%
Cash-on-Cash Return
3.8%
Cap rate
0.5%
Rent to Value Ratio
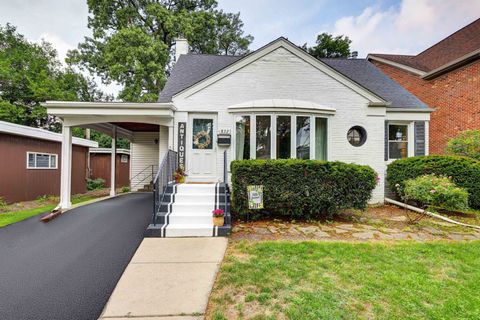
Active
$449,900
3
bds
|
2
ba
|
1,575
sqft
|
built
1951
832 Sylviawood Ave, Park Ridge, IL 60068
$-428
Cash flow
-5.0%
Cash-on-Cash Return
4.5%
Cap rate
0.8%
Rent to Value Ratio

Active
$436,900
2
bds
|
2
ba
|
1,275
sqft
|
built
2004
200 W Grand Ave, Chicago, IL 60654
$-837
Cash flow
-10.0%
Cash-on-Cash Return
3.4%
Cap rate
0.9%
Rent to Value Ratio

Active
$249,900
5
bds
|
2
ba
|
2,520
sqft
|
built
1897
845 W 50th Pl, Chicago, IL 60609
$-98
Cash flow
-2.0%
Cash-on-Cash Return
5.2%
Cap rate
0.7%
Rent to Value Ratio

Active
$279,000
1
bds
|
1
ba
|
845
sqft
|
built
1981
10 E Ontario St, Chicago, IL 60611
$-1,059
Cash flow
-19.8%
Cash-on-Cash Return
1.1%
Cap rate
0.8%
Rent to Value Ratio

Active
$239,900
2
bds
|
2
ba
|
1,405
sqft
|
built
2006
2323 W Pershing Rd, Chicago, IL 60609
$-940
Cash flow
-20.4%
Cash-on-Cash Return
1.0%
Cap rate
0.8%
Rent to Value Ratio
Active
$449,000
2
bds
|
2
ba
|
1,100
sqft
|
built
1920
1830 W Huron St, Chicago, IL 60622
$-995
Cash flow
-11.6%
Cash-on-Cash Return
3.0%
Cap rate
0.7%
Rent to Value Ratio
Active
$177,400
4
bds
|
2
ba
|
0
sqft
|
built
1960
14301 Kenwood Ave, Dolton, IL 60419
$-165
Cash flow
-4.9%
Cash-on-Cash Return
4.6%
Cap rate
1.1%
Rent to Value Ratio

Active
$229,999
3
bds
|
2
ba
|
1,163
sqft
|
built
1974
14116 S Hoxie Ave, Burnham, IL 60633
$-164
Cash flow
-3.7%
Cash-on-Cash Return
4.8%
Cap rate
1.0%
Rent to Value Ratio

Active
$780,000
8
bds
|
5
ba
|
0
sqft
|
built
1958
5706 N Saint Louis Ave, Chicago, IL 60659
$-2,659
Cash flow
-17.8%
Cash-on-Cash Return
1.6%
Cap rate
0.4%
Rent to Value Ratio

Active
$232,500
4
bds
|
2
ba
|
0
sqft
|
built
1965
15666 Woodlawn East Ave, South Holland, IL 60473
$40
Cash flow
0.9%
Cash-on-Cash Return
5.9%
Cap rate
1.0%
Rent to Value Ratio

Active
$2,599,000
7
bds
|
7
ba
|
8,360
sqft
|
built
1912
1120 Forest Ave, Evanston, IL 60202
$-13,027
Cash flow
-26.2%
Cash-on-Cash Return
-0.3%
Cap rate
0.2%
Rent to Value Ratio
Active
$548,500
5
bds
|
3
ba
|
2,486
sqft
|
built
1927
3336 Grand Blvd, Brookfield, IL 60513
$-1,176
Cash flow
-11.2%
Cash-on-Cash Return
3.1%
Cap rate
0.6%
Rent to Value Ratio

Active
$299,000
10
bds
|
6
ba
|
0
sqft
|
built
1906
4800 S Wood St, Chicago, IL 60609
$-402
Cash flow
-7.0%
Cash-on-Cash Return
4.1%
Cap rate
0.6%
Rent to Value Ratio
Active
$388,000
3
bds
|
2
ba
|
1,301
sqft
|
built
1963
414 Skokie Ct, Wilmette, IL 60091
$-4
Cash flow
-0.1%
Cash-on-Cash Return
5.7%
Cap rate
0.7%
Rent to Value Ratio
Active
$379,999
3
bds
|
2
ba
|
1,800
sqft
|
built
1962
6710 W 115th St, Worth, IL 60482
$-142
Cash flow
-1.9%
Cash-on-Cash Return
5.2%
Cap rate
0.7%
Rent to Value Ratio
Active
$260,000
3
bds
|
2
ba
|
2,749
sqft
|
built
1957
505 Betty Ln, South Holland, IL 60473
$-14
Cash flow
-0.3%
Cash-on-Cash Return
5.6%
Cap rate
1.1%
Rent to Value Ratio

Active
$1,144,999
7
bds
|
3
ba
|
0
sqft
|
built
1891
2014 N Whipple St, Chicago, IL 60647
$-4,075
Cash flow
-18.6%
Cash-on-Cash Return
1.4%
Cap rate
0.3%
Rent to Value Ratio