Cook County Investment Properties for Sale
Browse homes for sale and investment properties in Cook County. Refine your search by price, property type, or more.
Best cash flowing properties in Cook County
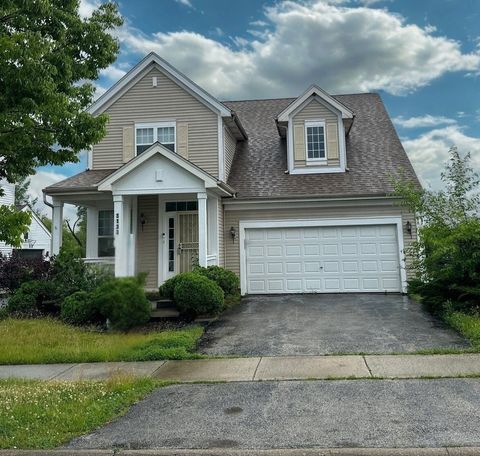
Active
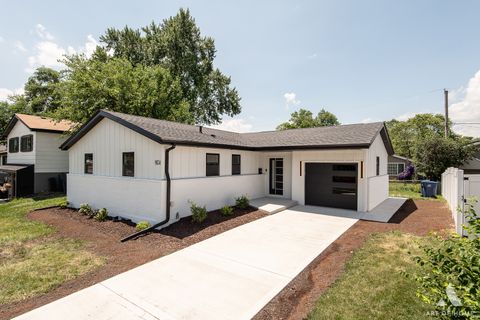
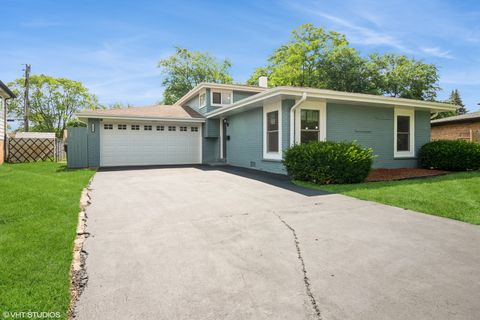
$215,000
3
bds
|
2
ba
|
1,487
sqft
|
built
1960
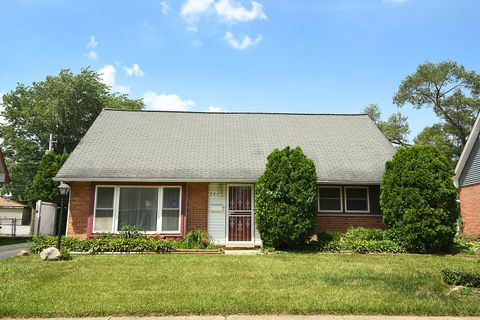
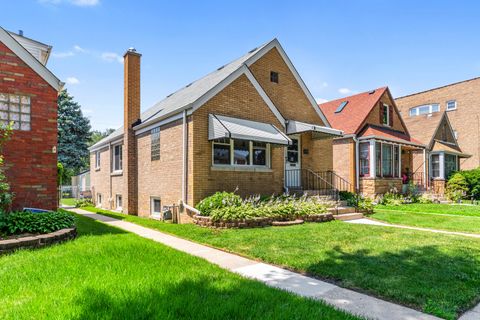
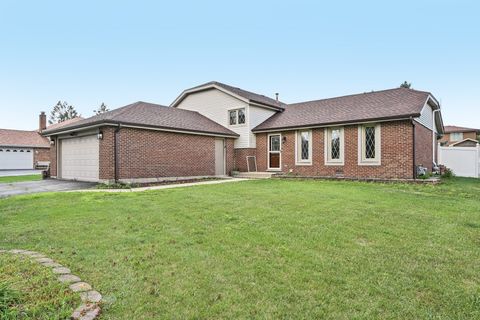
3806 168th St, Country Club Hills, IL 60478
$777
Cash flow
18.9%
Cash-on-Cash Return
10.0%
Cap rate
1.2%
Rent to Value Ratio
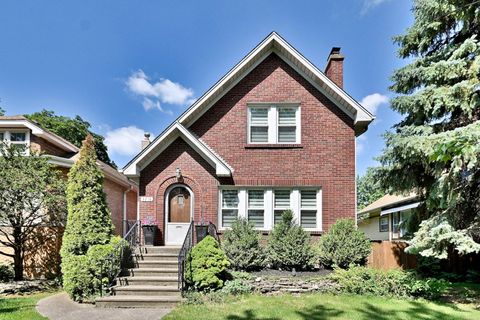
Active
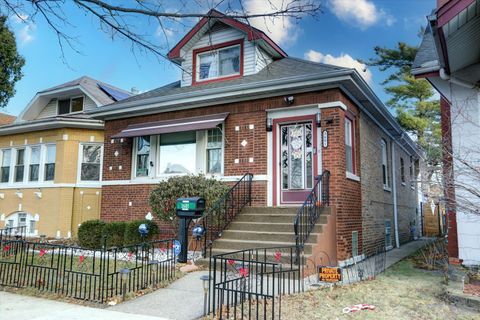
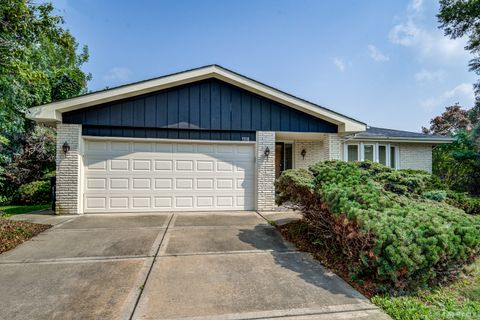
$199,900
3
bds
|
2
ba
|
1,250
sqft
|
built
1969
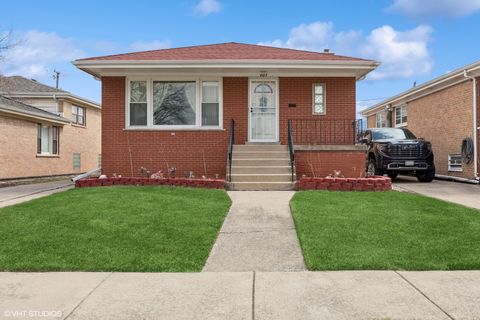
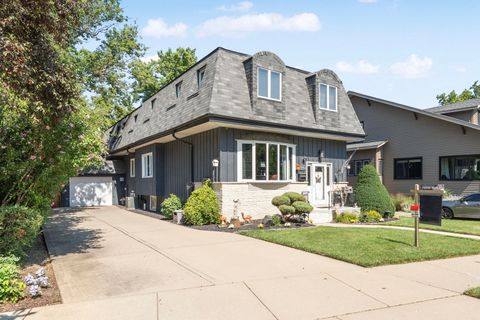
605 Saginaw Ave, Calumet City, IL 60409
$449
Cash flow
11.7%
Cash-on-Cash Return
8.4%
Cap rate
1.1%
Rent to Value Ratio
5,393 out of 6,185 properties for sale in Cook County
Limited Results Shown
Create a free account, or log in to reveal all property listings and enjoy the complete experience.
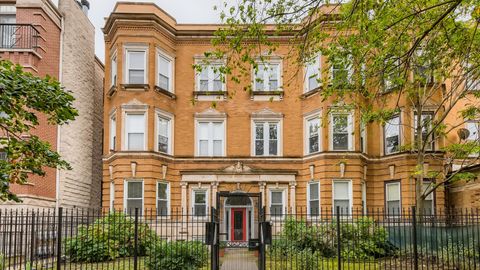
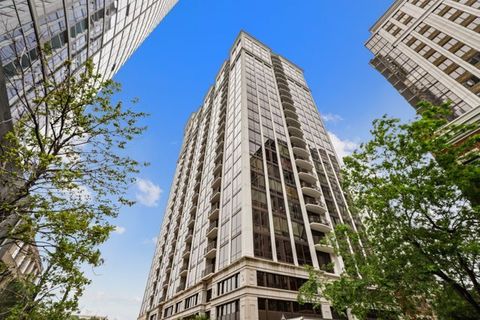
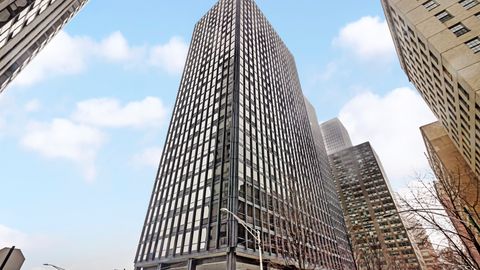
Active
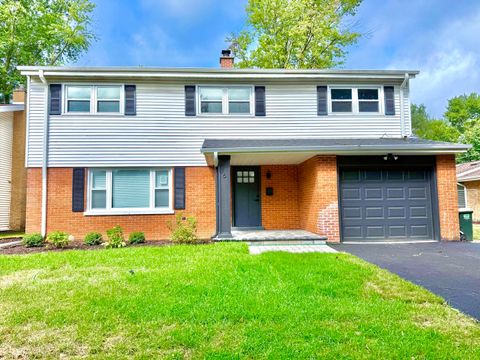
$280,000
1
bds
|
1
ba
|
730
sqft
|
built
2001
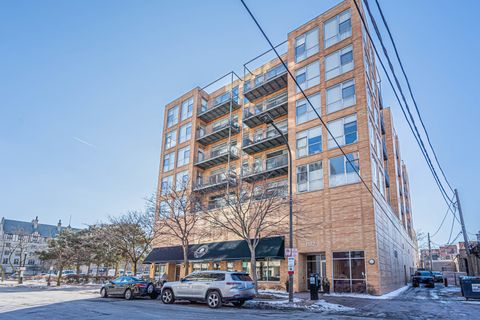
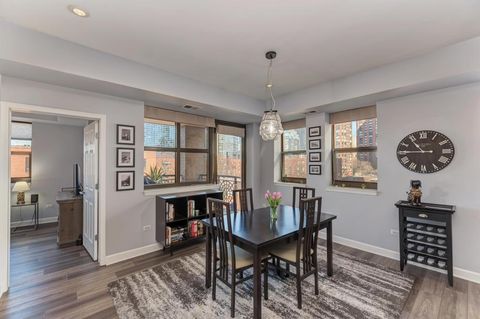
1572 Maple Ave, Evanston, IL 60201
$-527
Cash flow
-9.8%
Cash-on-Cash Return
3.4%
Cap rate
0.8%
Rent to Value Ratio
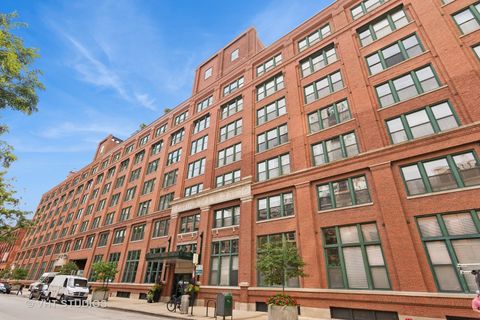
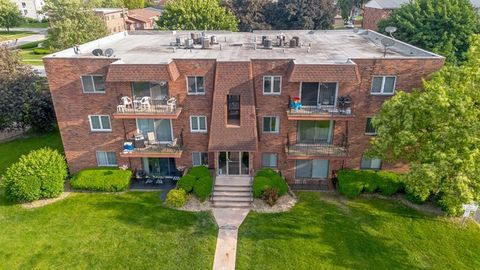
Active
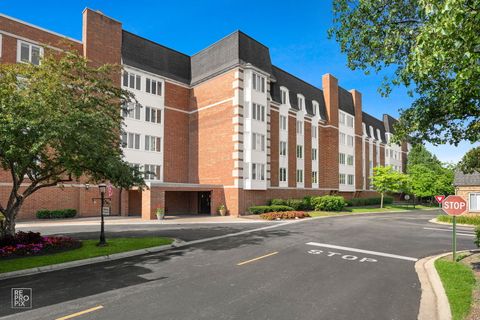
$524,900
2
bds
|
2
ba
|
0
sqft
|
built
1941
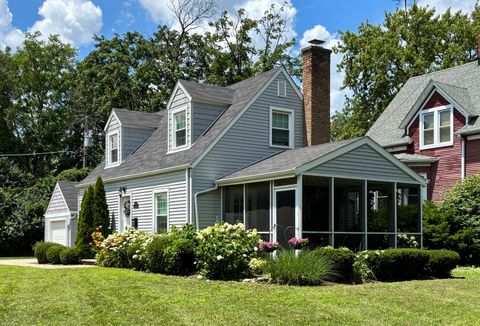
1526 Walnut St, Western Springs, IL 60558
$-900
Cash flow
-8.9%
Cash-on-Cash Return
3.6%
Cap rate
0.6%
Rent to Value Ratio
Active
$399,399
2
bds
|
2
ba
|
996
sqft
|
built
1951
3734 Oak Park Ave, Berwyn, IL 60402
$-691
Cash flow
-9.0%
Cash-on-Cash Return
3.6%
Cap rate
0.6%
Rent to Value Ratio
Active
$799,000
6
bds
|
4
ba
|
3,389
sqft
|
built
1923
5706 N New Hampshire Ave, Chicago, IL 60631
$-1,968
Cash flow
-12.9%
Cash-on-Cash Return
2.7%
Cap rate
0.5%
Rent to Value Ratio
Active
$159,999
3
bds
|
2
ba
|
1,100
sqft
|
built
1940
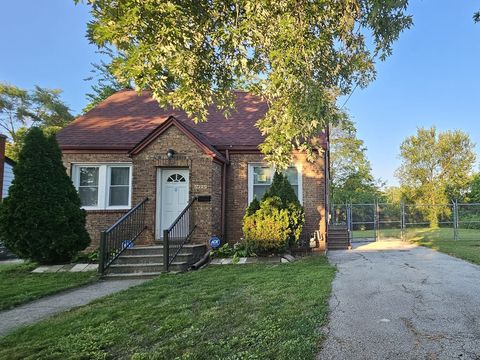
14931 Riverside Dr, South Holland, IL 60473
$201
Cash flow
6.6%
Cash-on-Cash Return
7.2%
Cap rate
1.2%
Rent to Value Ratio
Active
$425,000
2
bds
|
2
ba
|
1,500
sqft
|
built
2006
1111 S State St, Chicago, IL 60605
$-1,425
Cash flow
-17.5%
Cash-on-Cash Return
1.7%
Cap rate
0.8%
Rent to Value Ratio
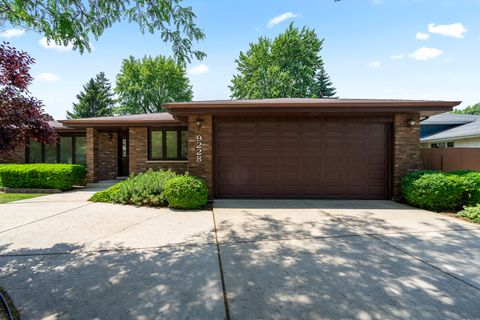
Active
$399,900
3
bds
|
2
ba
|
2,166
sqft
|
built
1985
9228 Ridgeland Ave, Oak Lawn, IL 60453
$-408
Cash flow
-5.3%
Cash-on-Cash Return
4.5%
Cap rate
0.8%
Rent to Value Ratio
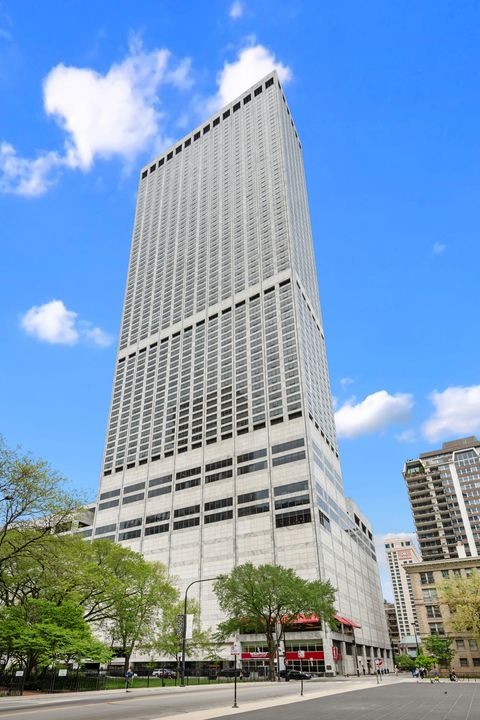
Active
$1,949,000
3
bds
|
3
ba
|
3,000
sqft
|
built
1975
180 E Pearson St, Chicago, IL 60611
$-7,919
Cash flow
-21.2%
Cash-on-Cash Return
0.8%
Cap rate
0.5%
Rent to Value Ratio
Active
$470,000
3
bds
|
2
ba
|
2,836
sqft
|
built
1937
1833 Cuyler Ave, Berwyn, IL 60402
$-531
Cash flow
-5.9%
Cash-on-Cash Return
4.3%
Cap rate
0.8%
Rent to Value Ratio
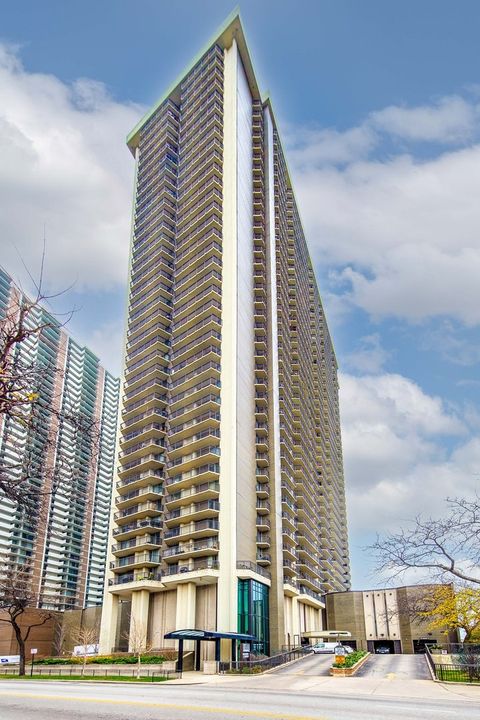
Active
$389,000
2
bds
|
2
ba
|
1,480
sqft
|
built
1967
6007 N Sheridan Rd, Chicago, IL 60660
$-824
Cash flow
-11.1%
Cash-on-Cash Return
3.1%
Cap rate
0.8%
Rent to Value Ratio
Active
$299,999
4
bds
|
3
ba
|
2,122
sqft
|
built
2001
3133 Heritage Blvd, Matteson, IL 60443
$-375
Cash flow
-6.5%
Cash-on-Cash Return
4.2%
Cap rate
0.9%
Rent to Value Ratio
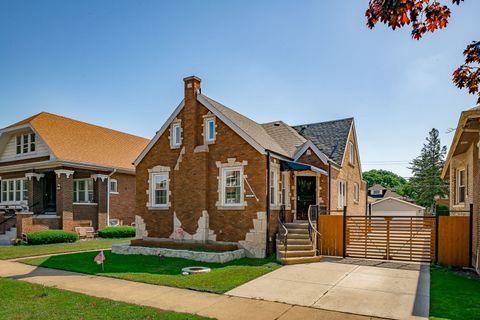
Active
$398,000
3
bds
|
2
ba
|
2,177
sqft
|
built
1930
3218 Scoville Ave, Berwyn, IL 60402
$-508
Cash flow
-6.7%
Cash-on-Cash Return
4.1%
Cap rate
0.7%
Rent to Value Ratio
Active
$255,000
2
bds
|
2
ba
|
1,000
sqft
|
built
1903
4707 N Kenmore Ave, Chicago, IL 60640
$-218
Cash flow
-4.5%
Cash-on-Cash Return
4.7%
Cap rate
1.0%
Rent to Value Ratio
Active
$435,000
2
bds
|
2
ba
|
1,350
sqft
|
built
1908
411 W Ontario St, Chicago, IL 60654
$-913
Cash flow
-11.0%
Cash-on-Cash Return
3.2%
Cap rate
0.9%
Rent to Value Ratio
Active
$1,275,000
4
bds
|
3
ba
|
2,483
sqft
|
built
1886
3025 N Racine Ave, Chicago, IL 60657
$-3,342
Cash flow
-13.7%
Cash-on-Cash Return
2.5%
Cap rate
0.5%
Rent to Value Ratio
Active
$569,000
3
bds
|
2
ba
|
3,785
sqft
|
built
1923
5324 W Warner Ave, Chicago, IL 60641
$-682
Cash flow
-6.3%
Cash-on-Cash Return
4.2%
Cap rate
0.7%
Rent to Value Ratio
Active
$635,000
3
bds
|
3
ba
|
1,660
sqft
|
built
1944
516 Engel Blvd, Park Ridge, IL 60068
$-1,584
Cash flow
-13.0%
Cash-on-Cash Return
2.7%
Cap rate
0.6%
Rent to Value Ratio
Active
$665,000
3
bds
|
2
ba
|
2,000
sqft
|
built
2015
2413 W Fullerton Ave, Chicago, IL 60647
$-938
Cash flow
-7.4%
Cash-on-Cash Return
4.0%
Cap rate
0.7%
Rent to Value Ratio
Active
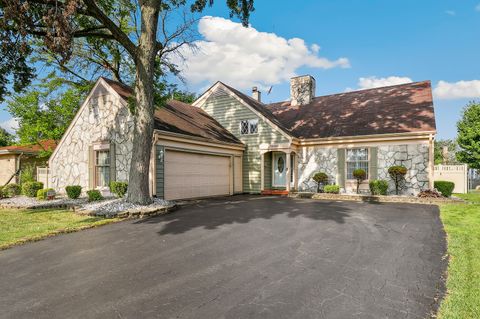
$389,900
4
bds
|
3
ba
|
1,587
sqft
|
built
1971
18024 Marlin Ln, Homewood, IL 60430
$-628
Cash flow
-8.4%
Cash-on-Cash Return
3.7%
Cap rate
0.7%
Rent to Value Ratio
Active
$250,000
4
bds
|
2
ba
|
1,700
sqft
|
built
1956
5707 W 82nd Pl, Burbank, IL 60459
$-139
Cash flow
-2.9%
Cash-on-Cash Return
5.0%
Cap rate
0.9%
Rent to Value Ratio
Active
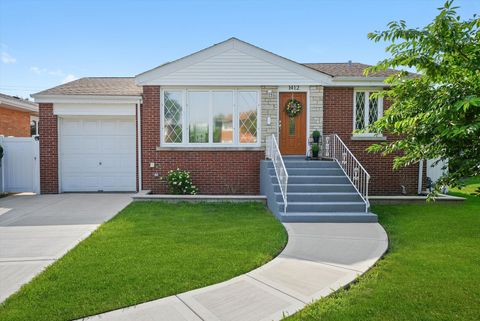
$429,900
2
bds
|
2
ba
|
1,450
sqft
|
built
1955
1412 Balmoral Ave, Westchester, IL 60154
$-718
Cash flow
-8.7%
Cash-on-Cash Return
3.7%
Cap rate
0.6%
Rent to Value Ratio
Active
$309,900
1
bds
|
1
ba
|
851
sqft
|
built
2005
233 E 13th St, Chicago, IL 60605
$-609
Cash flow
-10.3%
Cash-on-Cash Return
3.3%
Cap rate
1.0%
Rent to Value Ratio
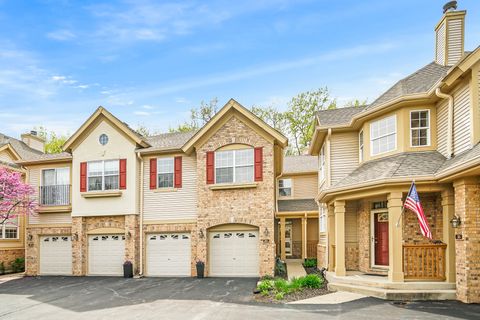
Active
$449,900
3
bds
|
4
ba
|
3,304
sqft
|
built
2001
33 Spyglass Cir, Palos Heights, IL 60463
$-921
Cash flow
-10.7%
Cash-on-Cash Return
3.2%
Cap rate
0.7%
Rent to Value Ratio
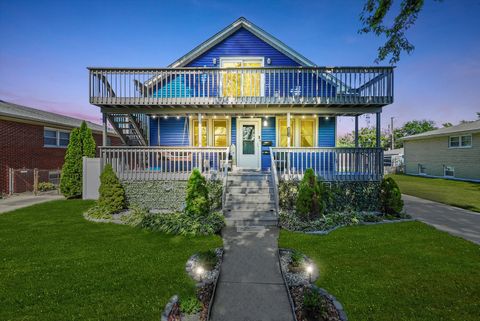
Active
$565,000
4
bds
|
2
ba
|
0
sqft
|
built
1921
4617 Blanchan Ave, Brookfield, IL 60513
$-2,381
Cash flow
-22.0%
Cash-on-Cash Return
0.6%
Cap rate
0.3%
Rent to Value Ratio
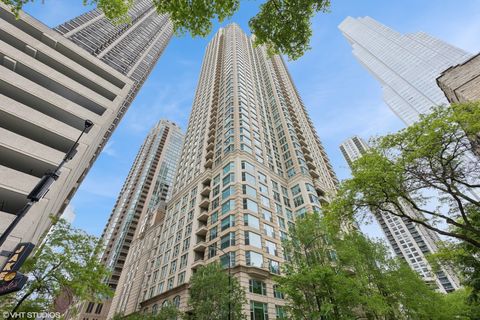
Active
$839,000
3
bds
|
3
ba
|
1,750
sqft
|
built
2003
25 E Superior St, Chicago, IL 60611
$-4,906
Cash flow
-30.5%
Cash-on-Cash Return
-1.3%
Cap rate
0.4%
Rent to Value Ratio
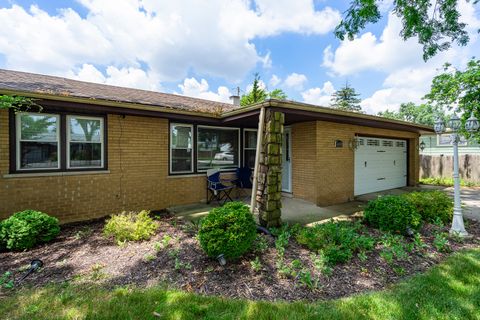
Active
$314,900
3
bds
|
2
ba
|
1,600
sqft
|
built
1961
16000 Long Ave, Oak Forest, IL 60452
$76
Cash flow
1.3%
Cash-on-Cash Return
6.0%
Cap rate
1.0%
Rent to Value Ratio

Active
$388,000
2
bds
|
2
ba
|
1,200
sqft
|
built
2003
212 E Cullerton St, Chicago, IL 60616
$-815
Cash flow
-11.0%
Cash-on-Cash Return
3.2%
Cap rate
0.8%
Rent to Value Ratio
Active
$429,000
3
bds
|
2
ba
|
1,200
sqft
|
built
1963
9124 S 88th Ave, Hickory Hills, IL 60457
$-855
Cash flow
-10.4%
Cash-on-Cash Return
3.3%
Cap rate
0.6%
Rent to Value Ratio
Active
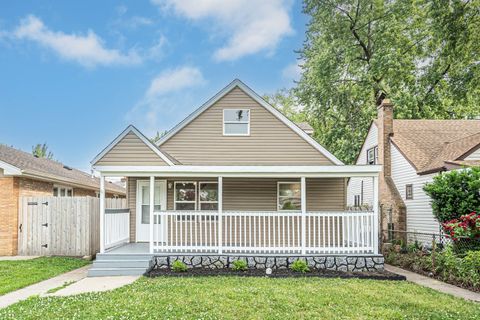
$375,000
3
bds
|
2
ba
|
1,799
sqft
|
built
1926
3601 Euclid Ave, Berwyn, IL 60402
$-66
Cash flow
-0.9%
Cash-on-Cash Return
5.5%
Cap rate
0.9%
Rent to Value Ratio
Active
$729,000
4
bds
|
3
ba
|
2,904
sqft
|
built
1963
6 S Donald Ave, Arlington Heights, IL 60004
$-1,783
Cash flow
-12.8%
Cash-on-Cash Return
2.7%
Cap rate
0.5%
Rent to Value Ratio
Active
$259,000
2
bds
|
2
ba
|
1,450
sqft
|
built
1979
50 Lake Blvd, Buffalo Grove, IL 60089
$-511
Cash flow
-10.3%
Cash-on-Cash Return
3.3%
Cap rate
0.9%
Rent to Value Ratio
Active
$299,900
4
bds
|
2
ba
|
0
sqft
|
built
1970
15463 Diekman Ct, Dolton, IL 60419
$-497
Cash flow
-8.6%
Cash-on-Cash Return
3.7%
Cap rate
0.7%
Rent to Value Ratio
Active
$365,000
3
bds
|
2
ba
|
1,834
sqft
|
built
1985
7718 W 157th Pl, Orland Park, IL 60462
$-314
Cash flow
-4.5%
Cash-on-Cash Return
4.6%
Cap rate
0.9%
Rent to Value Ratio
Active
$244,900
1
bds
|
1
ba
|
841
sqft
|
built
1955
910 N Lake Shore Dr, Chicago, IL 60611
$-902
Cash flow
-19.2%
Cash-on-Cash Return
1.3%
Cap rate
0.9%
Rent to Value Ratio
Active
$159,900
2
bds
|
1
ba
|
1,200
sqft
|
built
1973
5704 128th St, Crestwood, IL 60418
$254
Cash flow
8.3%
Cash-on-Cash Return
7.6%
Cap rate
1.3%
Rent to Value Ratio

Active
$339,900
4
bds
|
2
ba
|
2,400
sqft
|
built
1987
18227 Olde Farm Rd, Lansing, IL 60438
$-455
Cash flow
-7.0%
Cash-on-Cash Return
4.1%
Cap rate
0.9%
Rent to Value Ratio
Active
$655,000
3
bds
|
2
ba
|
1,875
sqft
|
built
1888
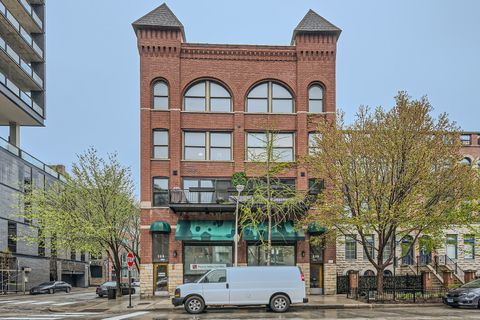
368 W Huron St, Chicago, IL 60654
$-2,456
Cash flow
-19.6%
Cash-on-Cash Return
1.2%
Cap rate
0.4%
Rent to Value Ratio
Active
$434,900
4
bds
|
2
ba
|
1,850
sqft
|
built
1983
15336 Regent Dr, Orland Park, IL 60462
$-538
Cash flow
-6.5%
Cash-on-Cash Return
4.2%
Cap rate
0.7%
Rent to Value Ratio