United States Investment Properties for Sale
Browse homes for sale and investment properties in United States. Refine your search by price, property type, or more.
Best cash flowing properties in United States
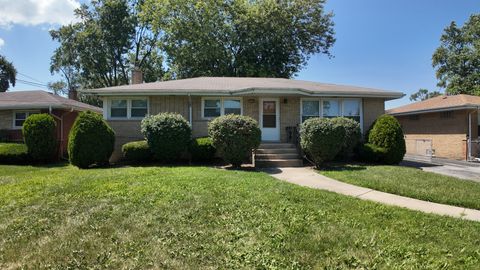
Active
$250,000
3
bds
|
3
ba
|
1,254
sqft
|
built
1961
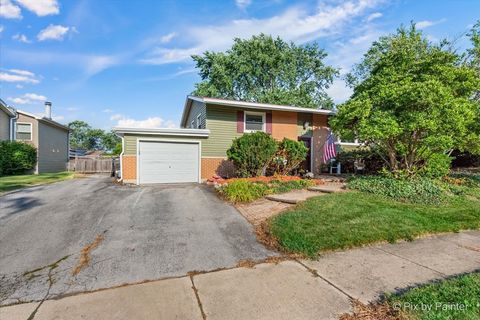
15444 State St, South Holland, IL 60473
$230
Cash flow
4.8%
Cash-on-Cash Return
6.8%
Cap rate
1.1%
Rent to Value Ratio
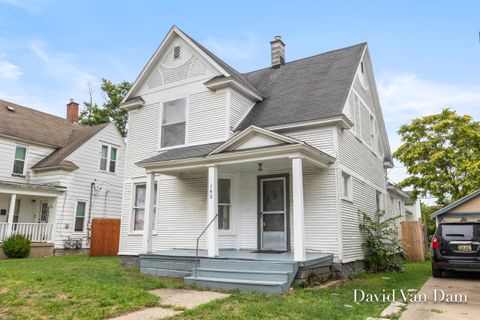
Active
$199,900
4
bds
|
1
ba
|
1,462
sqft
|
built
1895
140 Stewart St SW, Grand Rapids, MI 49507
$101
Cash flow
2.6%
Cash-on-Cash Return
6.8%
Cap rate
0.9%
Rent to Value Ratio
10,000 out of 325,063 properties for sale in United States
Limited Results Shown
Create a free account, or log in to reveal all property listings and enjoy the complete experience.
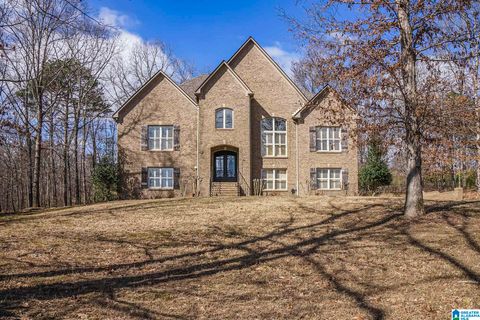
Active
$520,000
4
bds
|
3
ba
|
3,287
sqft
|
built
2006
8148 Carrington Dr, Trussville, AL 35173
$-493
Cash flow
-4.9%
Cash-on-Cash Return
4.5%
Cap rate
0.6%
Rent to Value Ratio
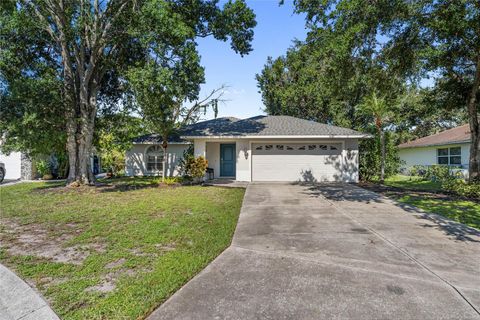
Active
$470,000
4
bds
|
2
ba
|
1,813
sqft
|
built
1994
5471 Cynthia Ln, Sarasota, FL 34235
$-674
Cash flow
-7.5%
Cash-on-Cash Return
4.4%
Cap rate
0.6%
Rent to Value Ratio

Active
$550,000
4
bds
|
3.5
ba
|
3,048
sqft
|
built
2016
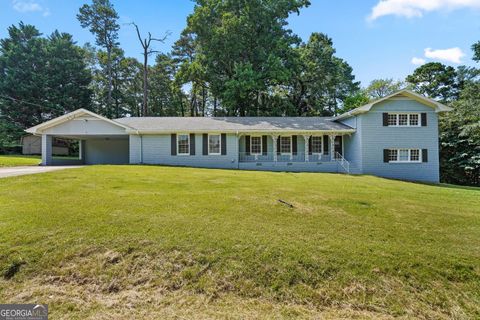
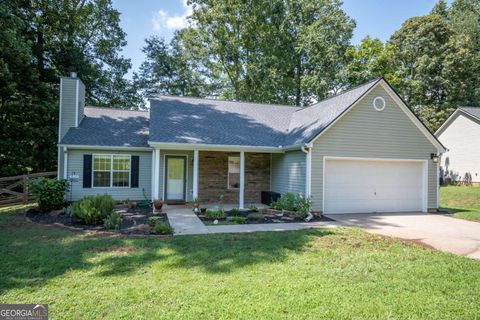
1007 Oglethorpe Ct, Woodstock, GA 30188
$-1,554
Cash flow
-14.7%
Cash-on-Cash Return
2.8%
Cap rate
0.5%
Rent to Value Ratio
Active
$317,800
5
bds
|
3
ba
|
2,979
sqft
|
built
1971
1260 White Oak St SE, Conyers, GA 30013
$-686
Cash flow
-11.3%
Cash-on-Cash Return
3.6%
Cap rate
0.6%
Rent to Value Ratio
Active
$180,000
2
bds
|
1
ba
|
789
sqft
|
built
1969
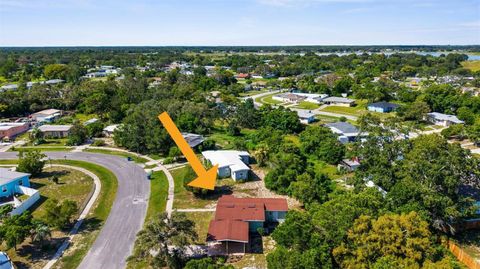
6400 Talbot Cir, Spring Hill, FL 34606
$56
Cash flow
1.6%
Cash-on-Cash Return
6.5%
Cap rate
0.9%
Rent to Value Ratio
Active
$199,000
2
bds
|
2
ba
|
951
sqft
|
built
1989
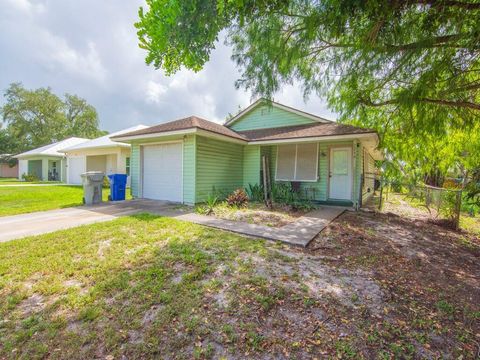
2240 86th Dr, Vero Beach, FL 32966
$-10
Cash flow
-0.3%
Cash-on-Cash Return
6.1%
Cap rate
0.9%
Rent to Value Ratio
Active
$345,000
1
bds
|
1
ba
|
600
sqft
|
built
1983
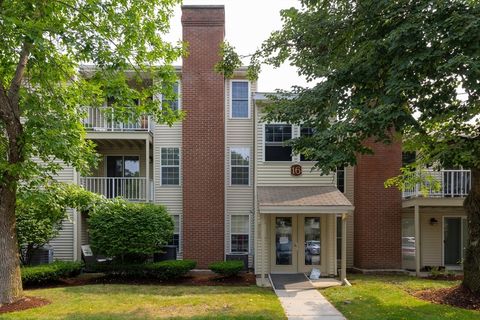
16 Walden Dr, Natick, MA 01760
$-889
Cash flow
-13.4%
Cash-on-Cash Return
2.6%
Cap rate
0.6%
Rent to Value Ratio
Active
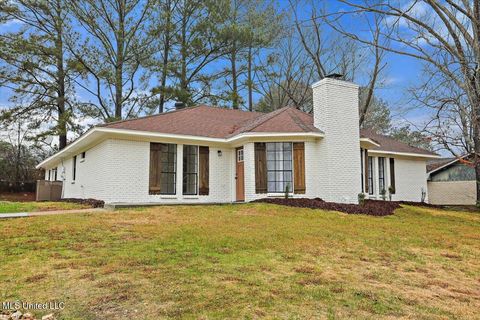
$225,000
4
bds
|
2
ba
|
0
sqft
|
built
1977
1505 Rosemont Dr, Clinton, MS 39056
$-314
Cash flow
-7.3%
Cash-on-Cash Return
4.0%
Cap rate
0.6%
Rent to Value Ratio
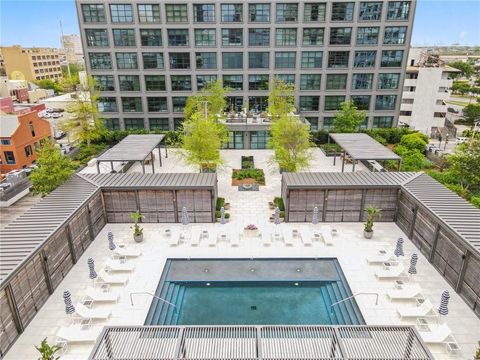
Active
$530,000
1
bds
|
1
ba
|
947
sqft
|
built
2017
1001 Julia St, New Orleans, LA 70113
$-231
Cash flow
-2.3%
Cash-on-Cash Return
5.2%
Cap rate
0.6%
Rent to Value Ratio
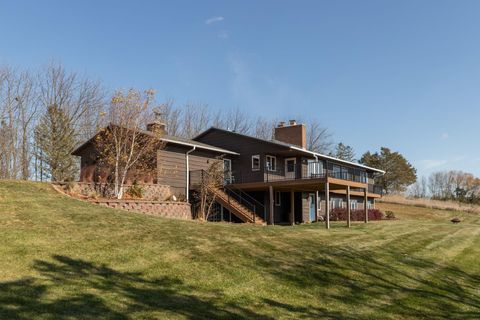
Active
$579,000
3
bds
|
3
ba
|
3,532
sqft
|
built
1979
2700 115th St NW, Oronoco, MN 55960
$-942
Cash flow
-8.5%
Cash-on-Cash Return
3.7%
Cap rate
0.6%
Rent to Value Ratio

Active
$255,000
2
bds
|
1
ba
|
930
sqft
|
built
1920
4940 Pottawatamie Dr, Watervliet, MI 49098
$-346
Cash flow
-7.1%
Cash-on-Cash Return
4.5%
Cap rate
0.8%
Rent to Value Ratio
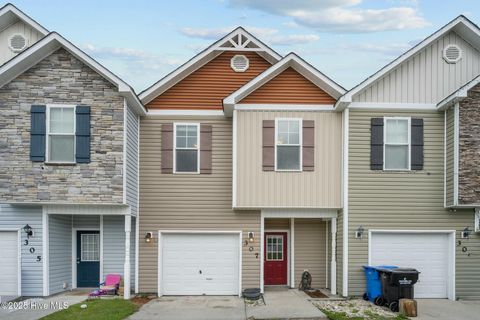
Active
$259,900
3
bds
|
3
ba
|
1,511
sqft
|
built
2012
307 Cedar Island Trl, Holly Ridge, NC 28445
$-233
Cash flow
-4.7%
Cash-on-Cash Return
4.6%
Cap rate
0.7%
Rent to Value Ratio
Active
$464,900
4
bds
|
3
ba
|
2,600
sqft
|
built
1928
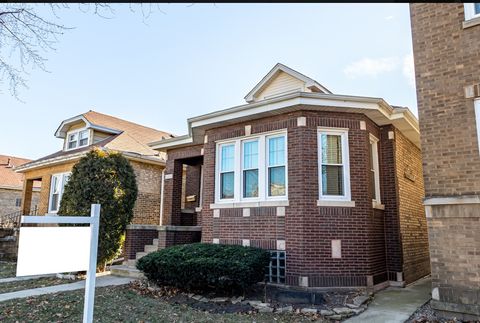
5353 W Fletcher St, Chicago, IL 60641
$-673
Cash flow
-7.6%
Cash-on-Cash Return
3.9%
Cap rate
0.6%
Rent to Value Ratio
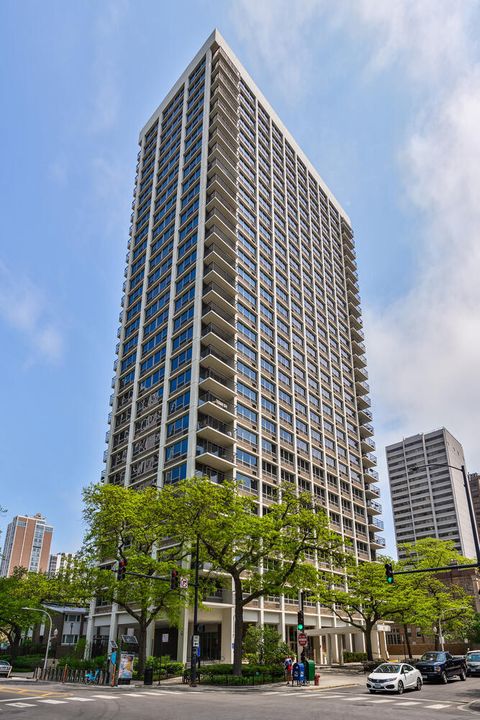
Active
$174,900
1
bds
|
2
ba
|
920
sqft
|
built
1960
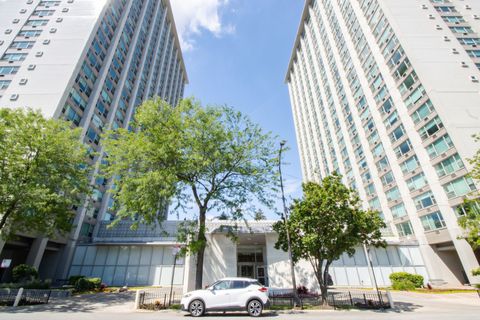
3600 N Lake Shore Dr, Chicago, IL 60613
$-169
Cash flow
-5.0%
Cash-on-Cash Return
4.5%
Cap rate
1.4%
Rent to Value Ratio
Active
$799,999
9
bds
|
3
ba
|
0
sqft
|
built
1908
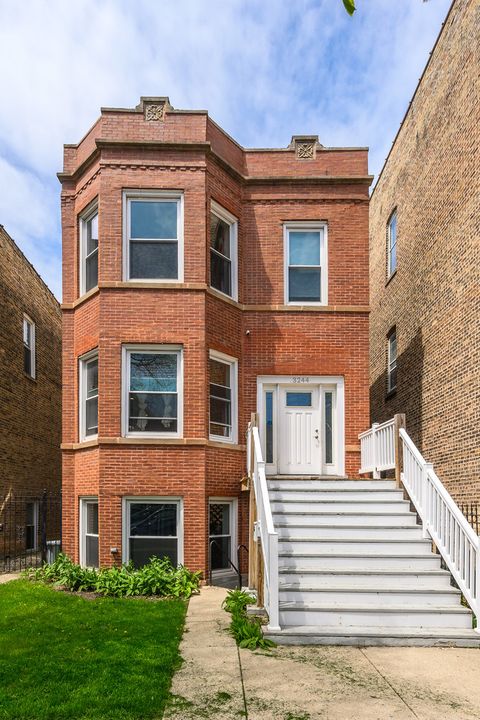
3244 N Hamlin Ave, Chicago, IL 60618
$-2,923
Cash flow
-19.1%
Cash-on-Cash Return
1.3%
Cap rate
0.3%
Rent to Value Ratio
Active
$249,800
1
bds
|
1
ba
|
0
sqft
|
built
1930
1528 S Wabash Ave, Chicago, IL 60605
$-696
Cash flow
-14.5%
Cash-on-Cash Return
2.3%
Cap rate
0.8%
Rent to Value Ratio
Active
$349,000
1
bds
|
1
ba
|
800
sqft
|
built
2005
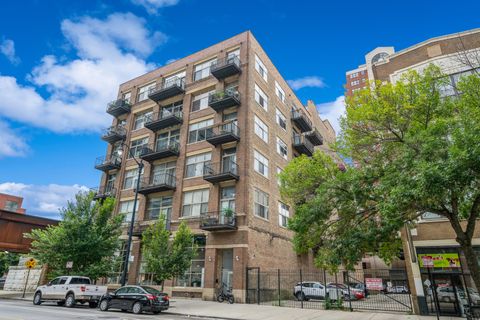
125 S Green St, Chicago, IL 60607
$-1,106
Cash flow
-16.5%
Cash-on-Cash Return
1.9%
Cap rate
0.8%
Rent to Value Ratio
Active
$348,000
2
bds
|
2
ba
|
1,086
sqft
|
built
1944
6435 S Lawler Ave, Chicago, IL 60638
$-148
Cash flow
-2.2%
Cash-on-Cash Return
5.2%
Cap rate
0.7%
Rent to Value Ratio
Active
$439,900
2
bds
|
1
ba
|
0
sqft
|
built
1968
88 W Schiller St, Chicago, IL 60610
$-1,621
Cash flow
-19.2%
Cash-on-Cash Return
1.3%
Cap rate
0.6%
Rent to Value Ratio
Active
$580,000
4
bds
|
4
ba
|
3,120
sqft
|
built
2006
7306 Washita Way, San Antonio, TX 78256
$-1,355
Cash flow
-12.2%
Cash-on-Cash Return
2.9%
Cap rate
0.6%
Rent to Value Ratio

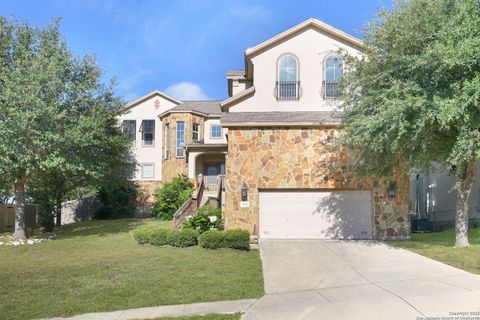
Active
$315,900
3
bds
|
3
ba
|
2,249
sqft
|
built
2004
9026 Mint Julep, San Antonio, TX 78251
$-581
Cash flow
-9.6%
Cash-on-Cash Return
3.5%
Cap rate
0.7%
Rent to Value Ratio
Active
$849,000
4
bds
|
3
ba
|
2,496
sqft
|
built
1986
11822 SW 108th Ter, Miami, FL 33186
$-2,093
Cash flow
-12.9%
Cash-on-Cash Return
3.2%
Cap rate
0.5%
Rent to Value Ratio
Active
$725,000
4
bds
|
3
ba
|
1,718
sqft
|
built
1987
10511 SW 147th Ct, Miami, FL 33196
$-2,210
Cash flow
-15.9%
Cash-on-Cash Return
2.5%
Cap rate
0.4%
Rent to Value Ratio
Active
$665,000
3
bds
|
1
ba
|
1,057
sqft
|
built
1954
3635 SW 95th Ave, Miami, FL 33165
$-1,425
Cash flow
-11.2%
Cash-on-Cash Return
3.6%
Cap rate
0.5%
Rent to Value Ratio
Active
$799,900
4
bds
|
3
ba
|
2,529
sqft
|
built
1989
15613 SW 55th Ter, Miami, FL 33185
$-1,830
Cash flow
-11.9%
Cash-on-Cash Return
3.4%
Cap rate
0.5%
Rent to Value Ratio
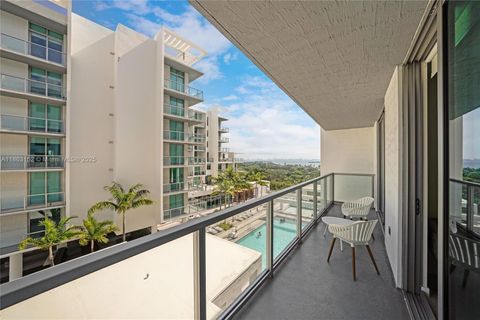
Active
$549,900
1
bds
|
1
ba
|
776
sqft
|
built
2019
3900 Biscayne Blvd, Miami, FL 33137
$-1,582
Cash flow
-15.0%
Cash-on-Cash Return
2.7%
Cap rate
0.8%
Rent to Value Ratio
Active
$650,000
4
bds
|
3
ba
|
2,081
sqft
|
built
1986
6130 Ramsdell Dr NE, Rockford, MI 49341
$-1,774
Cash flow
-14.2%
Cash-on-Cash Return
2.9%
Cap rate
0.5%
Rent to Value Ratio
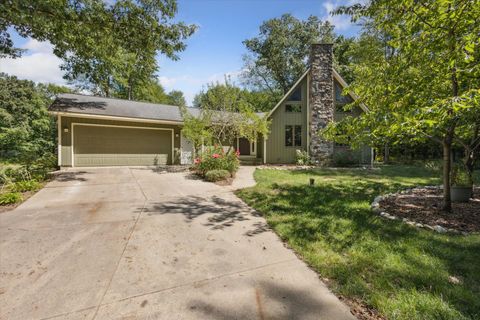
Active
$359,900
3
bds
|
2
ba
|
1,740
sqft
|
built
1976
1535 Rambling Woods Dr, Lawrenceville, GA 30043
$-828
Cash flow
-12.0%
Cash-on-Cash Return
3.4%
Cap rate
0.6%
Rent to Value Ratio
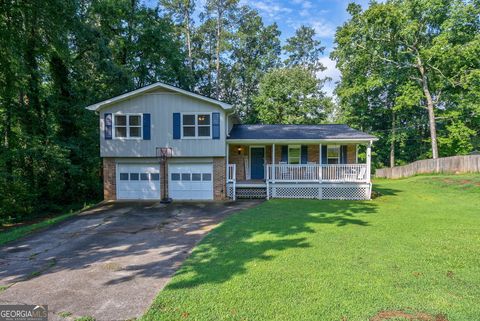
Active
$369,900
3
bds
|
2
ba
|
1,703
sqft
|
built
1971
124 Hickory Dr, Peachtree City, GA 30269
$-684
Cash flow
-9.6%
Cash-on-Cash Return
3.9%
Cap rate
0.6%
Rent to Value Ratio
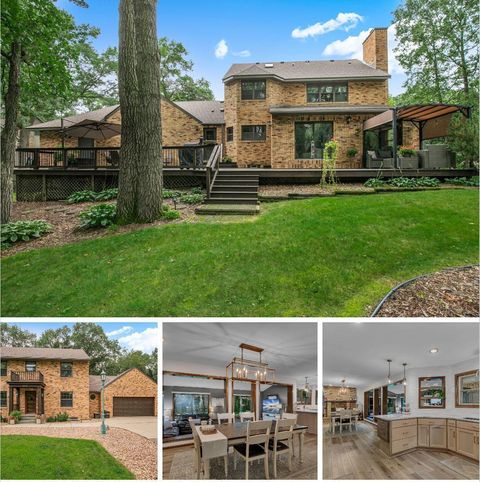
Active
$474,900
5
bds
|
3
ba
|
3,412
sqft
|
built
1983
612 9th St N, Sartell, MN 56377
$-957
Cash flow
-10.5%
Cash-on-Cash Return
3.3%
Cap rate
0.5%
Rent to Value Ratio
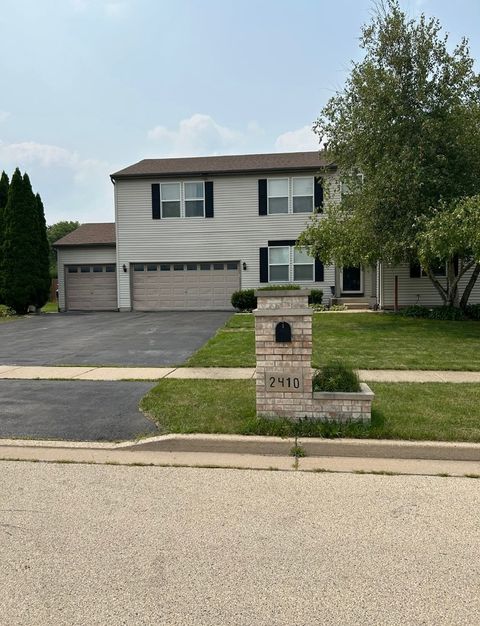
Active
$369,000
4
bds
|
3
ba
|
2,608
sqft
|
built
2001
2410 Westfield Ln, Belvidere, IL 61008
$-659
Cash flow
-9.3%
Cash-on-Cash Return
3.5%
Cap rate
0.7%
Rent to Value Ratio
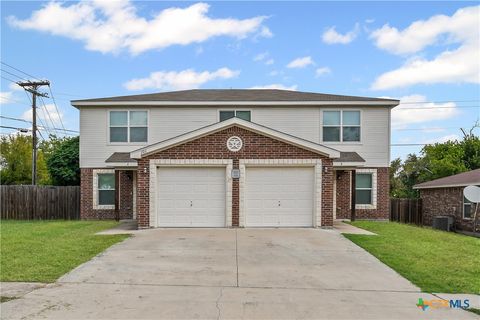
Active
$355,000
bds
|
0
ba
|
2,786
sqft
|
built
2016
101 Kings Ct, Killeen, TX 76542
$-1,665
Cash flow
-24.5%
Cash-on-Cash Return
0.1%
Cap rate
0.3%
Rent to Value Ratio
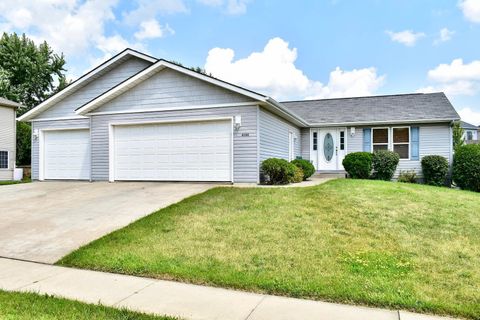
Active
$350,000
4
bds
|
3
ba
|
2,592
sqft
|
built
2006
6266 Jonathan Dr NW, Rochester, MN 55901
$-319
Cash flow
-4.8%
Cash-on-Cash Return
4.6%
Cap rate
0.7%
Rent to Value Ratio
Active
$299,000
3
bds
|
3
ba
|
1,954
sqft
|
built
1978
2671 Sumac Rdg, White Bear Lake, MN 55110
$-211
Cash flow
-3.7%
Cash-on-Cash Return
4.8%
Cap rate
0.8%
Rent to Value Ratio
Active
$299,000
4
bds
|
2
ba
|
1,660
sqft
|
built
1964
15433 David Ln, Oak Forest, IL 60452
$-22
Cash flow
-0.4%
Cash-on-Cash Return
5.6%
Cap rate
0.9%
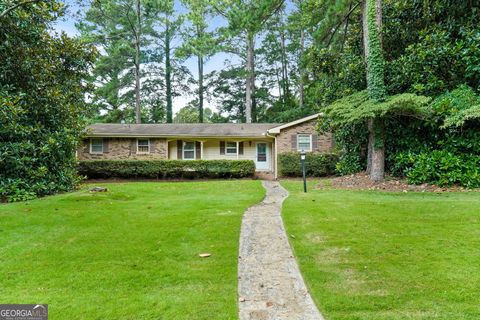
Rent to Value Ratio
Active
$325,000
3
bds
|
2
ba
|
1,559
sqft
|
built
2000
162 Azalea Dr, Winder, GA 30680
$-467
Cash flow
-7.5%
Cash-on-Cash Return
4.4%
Cap rate
0.6%
Rent to Value Ratio
Active
$430,000
2
bds
|
2
ba
|
1,054
sqft
|
built
2000
2131 SE 10th Ave, Fort Lauderdale, FL 33316
$-1,441
Cash flow
-17.5%
Cash-on-Cash Return
2.1%
Cap rate
0.7%
Rent to Value Ratio
Active
$389,000
2
bds
|
2
ba
|
1,598
sqft
|
built
1958
440 SW 29th Ter, Fort Lauderdale, FL 33312
$-188
Cash flow
-2.5%
Cash-on-Cash Return
5.6%
Cap rate
0.7%
Rent to Value Ratio