United States Investment Properties for Sale
Browse homes for sale and investment properties in United States. Refine your search by price, property type, or more.
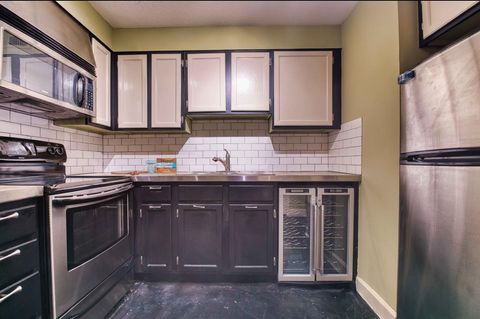
Best cash flowing properties in United States
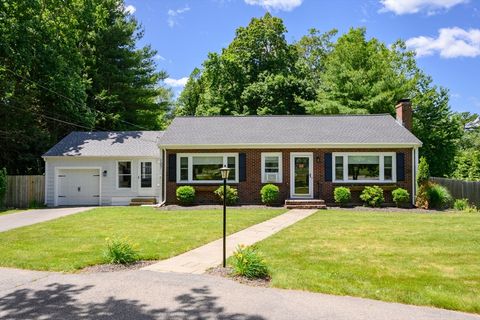
Active
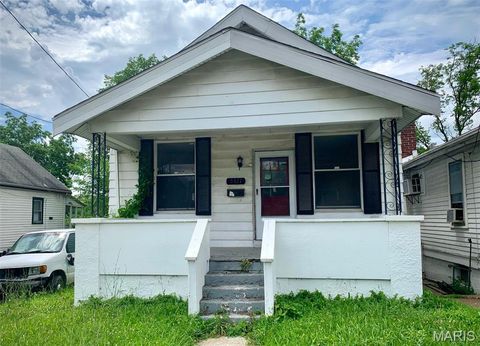
$60,000
3
bds
|
1
ba
|
806
sqft
|
built
1924
5811 Helen Ave, Jennings, MO 63136
$750
Cash flow
14.6%
Cash-on-Cash Return
15.0%
Cap rate
2.0%
Rent to Value Ratio
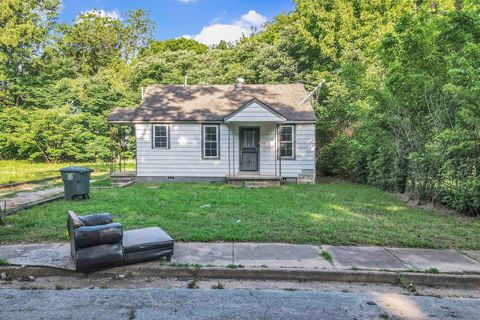
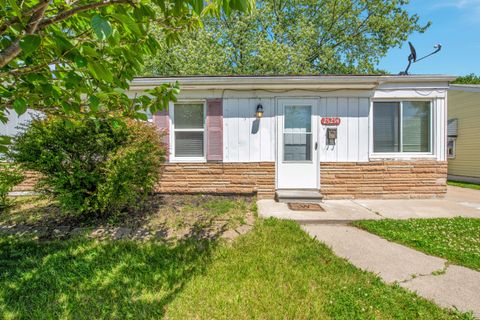
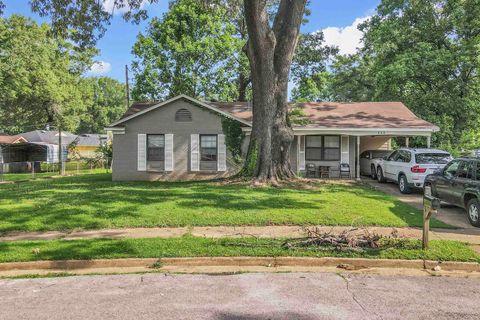
Active
$69,250
2
bds
|
1
ba
|
0
sqft
|
built
1946
3021 Sunrise St, Memphis, TN 38127
$654
Cash flow
11.0%
Cash-on-Cash Return
11.3%
Cap rate
1.4%
Rent to Value Ratio
10,000 out of 432,530 properties for sale in United States
Limited Results Shown
Create a free account, or log in to reveal all property listings and enjoy the complete experience.
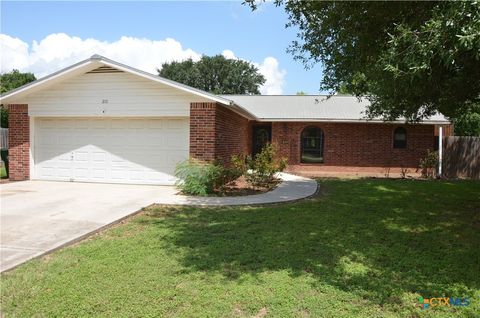
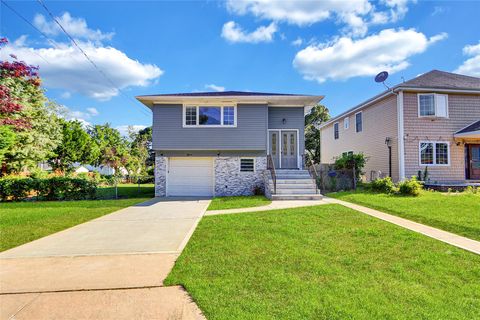
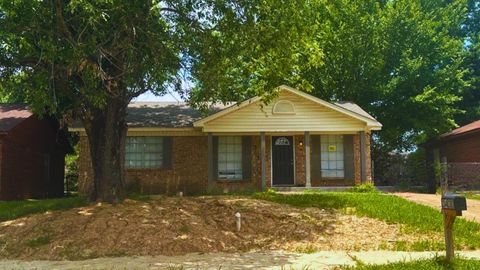
Active
$329,000
3
bds
|
2
ba
|
1,468
sqft
|
built
1996
210 Meadow Ln, Martindale, TX 78655
$-781
Cash flow
-12.4%
Cash-on-Cash Return
2.8%
Cap rate
0.5%
Rent to Value Ratio
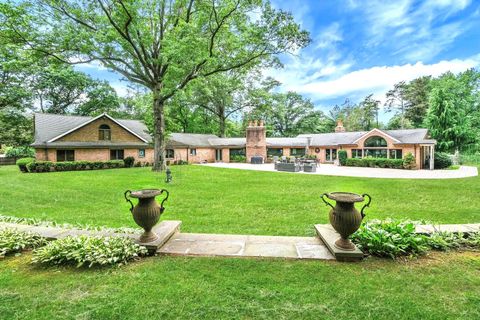
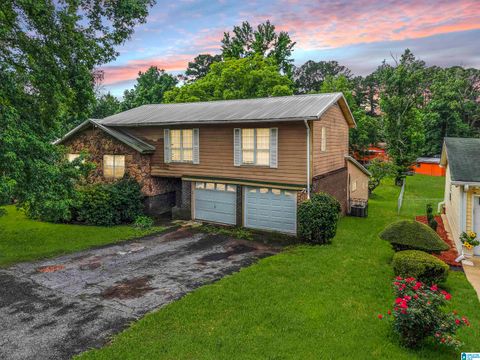
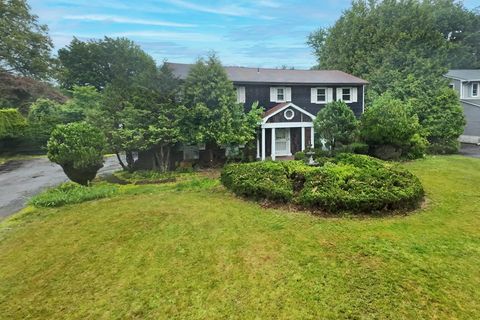
Active
$2,199,999
6
bds
|
4
ba
|
4,711
sqft
|
built
2001
9 Chicken Valley Rd, Glen Head, NY 11545
$-9,142
Cash flow
-21.7%
Cash-on-Cash Return
1.1%
Cap rate
0.3%
Rent to Value Ratio
Active
$799,000
4
bds
|
3
ba
|
2,261
sqft
|
built
1989
144 Colony Dr, Holbrook, NY 11741
$-2,804
Cash flow
-18.3%
Cash-on-Cash Return
1.9%
Cap rate
0.5%
Rent to Value Ratio
Active
$749,999
3
bds
|
3
ba
|
1,939
sqft
|
built
2000
4 Anthony Ct, Copiague, NY 11726
$-2,553
Cash flow
-17.8%
Cash-on-Cash Return
2.0%
Cap rate
0.5%
Rent to Value Ratio

Active
$1,499,000
4
bds
|
4
ba
|
3,687
sqft
|
built
1988
4536 N Landmark Dr, Orlando, FL 32817
$-5,128
Cash flow
-17.8%
Cash-on-Cash Return
2.0%
Cap rate
0.3%
Rent to Value Ratio
Active
$1,289,999
6
bds
|
5
ba
|
3,400
sqft
|
built
1901
2370 Atlantic Ave, Brooklyn, NY 11233
$-4,405
Cash flow
-17.8%
Cash-on-Cash Return
2.0%
Cap rate
0.2%
Rent to Value Ratio
Active
$2,288,000
5
bds
|
6
ba
|
3,308
sqft
|
built
1957
77 Bounty Ln, Jericho, NY 11753
$-10,092
Cash flow
-23.0%
Cash-on-Cash Return
0.8%
Cap rate
0.3%
Rent to Value Ratio
Active
$725,000
3
bds
|
2
ba
|
1,823
sqft
|
built
1985
76 Lakewood Park Rd, Westminster, MA 01473
$-1,685
Cash flow
-12.1%
Cash-on-Cash Return
2.9%
Cap rate
0.5%
Rent to Value Ratio
Active
$629,900
2
bds
|
1
ba
|
1,849
sqft
|
built
1954
107 Washington St, Pembroke, MA 02359
$-1,063
Cash flow
-8.8%
Cash-on-Cash Return
3.7%
Cap rate
0.6%
Rent to Value Ratio
Active
$877,000
5
bds
|
2
ba
|
2,138
sqft
|
built
1974
9 Rhodes Ln, West Hempstead, NY 11552
$-3,343
Cash flow
-19.9%
Cash-on-Cash Return
1.5%
Cap rate
0.3%
Rent to Value Ratio
Active
$177,000
6
bds
|
4
ba
|
2,966
sqft
|
built
1969
540 Harlem Ave, Bessemer, AL 35023
$266
Cash flow
7.8%
Cash-on-Cash Return
7.5%
Cap rate
0.9%
Rent to Value Ratio
Active
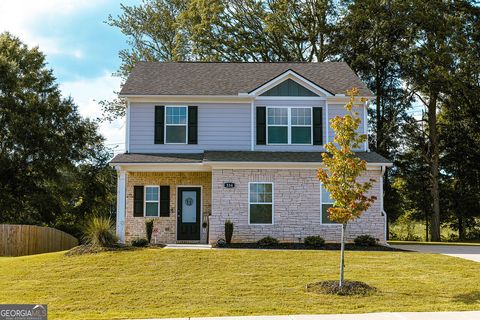
$347,000
3
bds
|
0
ba
|
1,896
sqft
|
built
2022
534 Meadows Farm Dr, Monroe, GA 30655
$-685
Cash flow
-10.3%
Cash-on-Cash Return
3.8%
Cap rate
0.6%
Rent to Value Ratio

Active
$115,900
4
bds
|
2
ba
|
0
sqft
|
built
1958
3028 Marwood Dr, Jackson, MS 39212
$311
Cash flow
14.0%
Cash-on-Cash Return
8.9%
Cap rate
1.2%
Rent to Value Ratio
Active
$1,150,000
5
bds
|
3
ba
|
2,816
sqft
|
built
1967
8 Macintosh Ln, Monsey, NY 10952
$-4,156
Cash flow
-18.9%
Cash-on-Cash Return
1.7%
Cap rate
0.4%
Rent to Value Ratio
Active
$102,000
2
bds
|
1
ba
|
0
sqft
|
built
1948
3176 Benjestown Rd, Memphis, TN 38127
$236
Cash flow
12.1%
Cash-on-Cash Return
8.5%
Cap rate
1.1%
Rent to Value Ratio
Active
$69,900
1
bds
|
1
ba
|
0
sqft
|
built
1926
109 N Main St, Memphis, TN 38103
$522
Cash flow
8.7%
Cash-on-Cash Return
9.0%
Cap rate
1.3%
Rent to Value Ratio
Active
$425,000
2
bds
|
2
ba
|
1,222
sqft
|
built
1939
912 Pleasant St, Somerset, MA 02726
$-710
Cash flow
-8.7%
Cash-on-Cash Return
3.7%
Cap rate
0.6%
Rent to Value Ratio
Active
$575,000
3
bds
|
2
ba
|
1,812
sqft
|
built
1957
606 Antler Dr, Castle Hills, TX 78213
$-1,439
Cash flow
-13.1%
Cash-on-Cash Return
2.7%
Cap rate
0.5%
Rent to Value Ratio
Active
$459,000
3
bds
|
0
ba
|
1,816
sqft
|
built
1920
540 Sunset Ave, Comer, GA 30629
$-1,695
Cash flow
-19.3%
Cash-on-Cash Return
1.7%
Cap rate
0.2%
Rent to Value Ratio
Active
$410,000
3
bds
|
3
ba
|
1,452
sqft
|
built
1960
14 Skyline Trl, Salisbury Mills, NY 12577
$-687
Cash flow
-8.7%
Cash-on-Cash Return
4.1%
Cap rate
0.8%
Rent to Value Ratio
Active
$399,900
3
bds
|
2
ba
|
1,372
sqft
|
built
2021
256 16th Ave SE, Lonsdale, MN 55046
$-465
Cash flow
-6.1%
Cash-on-Cash Return
4.3%
Cap rate
0.6%
Rent to Value Ratio
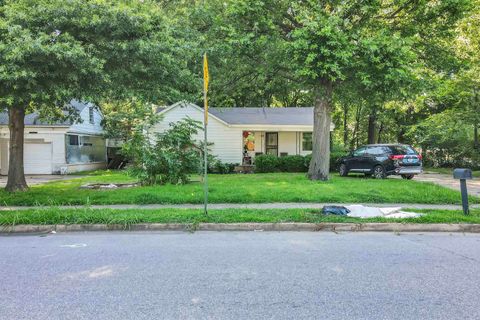
Active
$289,000
4
bds
|
2
ba
|
1,798
sqft
|
built
1910
204 W Main Ave, Wheeler, WI 54772
$-679
Cash flow
-12.3%
Cash-on-Cash Return
3.3%
Cap rate
0.5%
Rent to Value Ratio
Active
$295,000
4
bds
|
3
ba
|
3,000
sqft
|
built
1900
830 College Ave, Adrian, MI 49221
$-586
Cash flow
-10.4%
Cash-on-Cash Return
3.8%
Cap rate
0.7%
Rent to Value Ratio
Active
$799,000
4
bds
|
4
ba
|
2,372
sqft
|
built
1994
30 Lee Rd, South Deerfield, MA 01373
$-1,964
Cash flow
-12.8%
Cash-on-Cash Return
2.7%
Cap rate
0.4%
Rent to Value Ratio
Active
$239,900
2
bds
|
1
ba
|
836
sqft
|
built
1938
13861 Butternut St, Cedar Lake, IN 46303
$-156
Cash flow
-3.4%
Cash-on-Cash Return
5.4%
Cap rate
0.8%
Rent to Value Ratio
Active
$499,000
3
bds
|
3
ba
|
2,450
sqft
|
built
2004
6204 High Ridge Ct, Wappingers Falls, NY 12590
$-1,122
Cash flow
-11.7%
Cash-on-Cash Return
3.4%
Cap rate
0.7%
Rent to Value Ratio
Active
$350,000
3
bds
|
2
ba
|
1,344
sqft
|
built
1970
8233 Johnson Rd, Belding, MI 48809
$-657
Cash flow
-9.8%
Cash-on-Cash Return
3.9%
Cap rate
0.5%
Rent to Value Ratio
Active
$699,000
5
bds
|
3
ba
|
1,547
sqft
|
built
1956
44 N Perkins Ave, Elmsford, NY 10523
$-2,347
Cash flow
-17.5%
Cash-on-Cash Return
2.0%
Cap rate
0.5%
Rent to Value Ratio
Active
$1,597,500
3
bds
|
2
ba
|
1,400
sqft
|
built
1995
190 Longview Rd, Vineyard Haven, MA 02568
$-4,561
Cash flow
-14.9%
Cash-on-Cash Return
2.3%
Cap rate
0.3%
Rent to Value Ratio
Active
$147,900
3
bds
|
1
ba
|
895
sqft
|
built
1950
25294 Wiseman St, Roseville, MI 48066
$33
Cash flow
1.2%
Cash-on-Cash Return
6.4%
Cap rate
0.9%
Rent to Value Ratio
Active
$1,388,000
4
bds
|
3
ba
|
3,000
sqft
|
built
1937
18 Loring Rd, Levittown, NY 11756
$-5,814
Cash flow
-21.9%
Cash-on-Cash Return
1.0%
Cap rate
0.3%
Rent to Value Ratio

Active
$359,900
3
bds
|
3
ba
|
1,325
sqft
|
built
2008
9219 SW 227th St, Cutler Bay, FL 33190
$-1,092
Cash flow
-15.8%
Cash-on-Cash Return
2.5%
Cap rate
0.7%
Rent to Value Ratio
Active
$430,000
3
bds
|
3
ba
|
2,157
sqft
|
built
2016
828 Terra Vista St, Brandon, FL 33511
$-1,098
Cash flow
-13.3%
Cash-on-Cash Return
3.1%
Cap rate
0.6%
Rent to Value Ratio
Active
$599,000
6
bds
|
4
ba
|
0
sqft
|
built
2017
40 Cotton Bowl Cv, Rossville, TN 38066
$-570
Cash flow
-5.0%
Cash-on-Cash Return
4.5%
Cap rate
0.6%
Rent to Value Ratio
Active
$113,000
3
bds
|
1
ba
|
0
sqft
|
built
1967
646 Semple Ave, Memphis, TN 38127
$212
Cash flow
9.8%
Cash-on-Cash Return
7.9%
Cap rate
1.1%
Rent to Value Ratio
Active
$949,000
5
bds
|
4.5
ba
|
0
sqft
|
built
2001
160 Monterey Mills Cv, Collierville, TN 38017
$-2,109
Cash flow
-11.6%
Cash-on-Cash Return
3.0%
Cap rate
0.4%
Rent to Value Ratio
Active
$117,250
3
bds
|
1
ba
|
0
sqft
|
built
1972
3430 Dobbin Ferry Ave, Memphis, TN 38118
$115
Cash flow
5.1%
Cash-on-Cash Return
6.9%
Cap rate
0.9%
Rent to Value Ratio
Active
$82,000
2
bds
|
1
ba
|
0
sqft
|
built
1950
603 Burlington Cir, Memphis, TN 38127
$323
Cash flow
20.6%
Cash-on-Cash Return
10.4%
Cap rate
1.3%
Rent to Value Ratio