United States Investment Properties for Sale
Browse homes for sale and investment properties in United States. Refine your search by price, property type, or more.
Best cash flowing properties in United States

Active
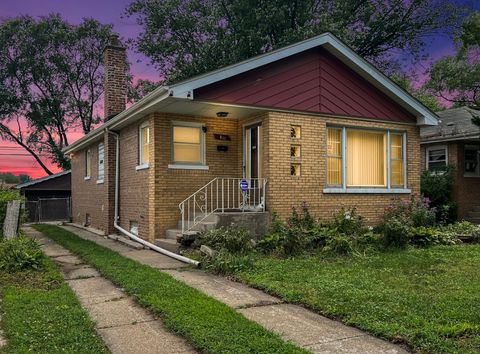
$145,000
3
bds
|
1
ba
|
954
sqft
|
built
1881
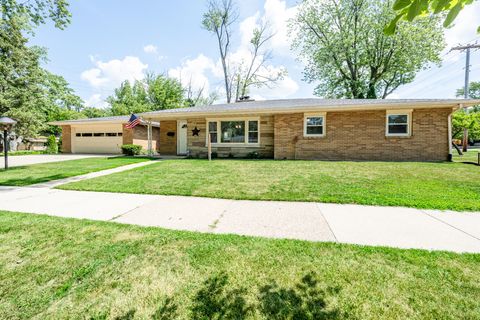
6442 S Loomis Blvd, Chicago, IL 60636
$571
Cash flow
20.5%
Cash-on-Cash Return
10.4%
Cap rate
1.4%
Rent to Value Ratio
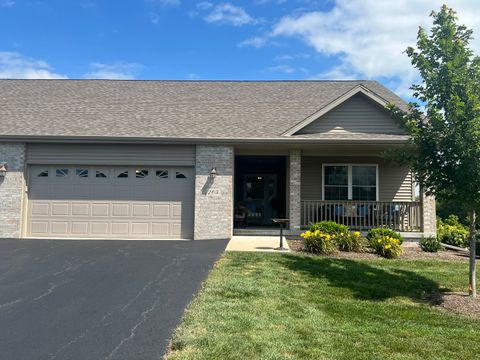
Active
$149,900
3
bds
|
2
ba
|
1,078
sqft
|
built
1956
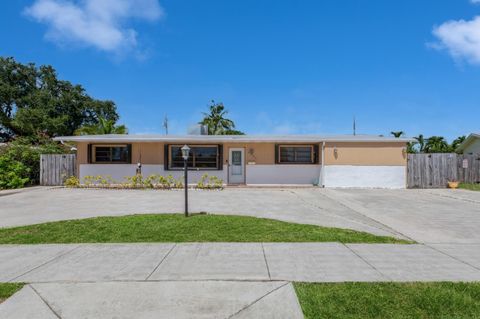
811 Sibley Blvd, Calumet City, IL 60409
$347
Cash flow
12.1%
Cash-on-Cash Return
8.5%
Cap rate
1.3%
Rent to Value Ratio
10,000 out of 315,014 properties for sale in United States
Limited Results Shown
Create a free account, or log in to reveal all property listings and enjoy the complete experience.
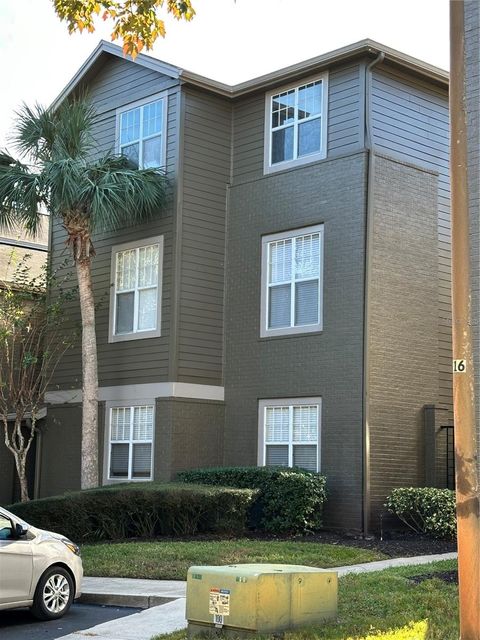
Active
$365,000
2
bds
|
3
ba
|
1,532
sqft
|
built
2021
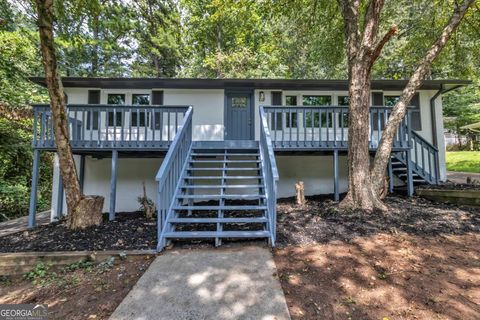
705 Yingling Dr, Dixon, IL 61021
$-1,114
Cash flow
-15.9%
Cash-on-Cash Return
2.0%
Cap rate
0.5%
Rent to Value Ratio
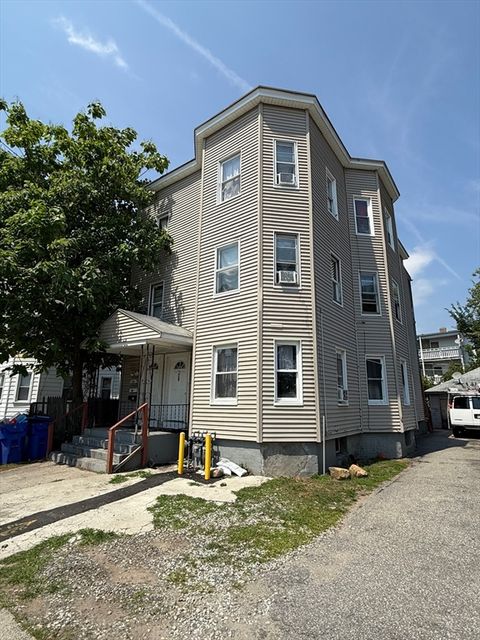
Active
$399,900
9
bds
|
3
ba
|
3,366
sqft
|
built
1909
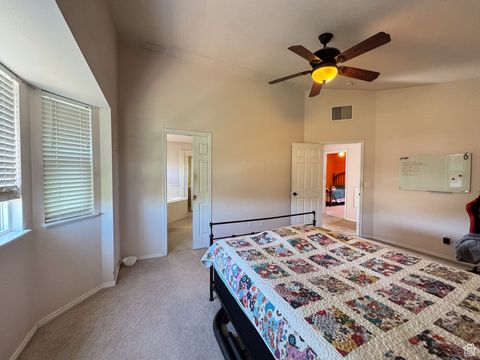
75-77 Mooreland St, Springfield, MA 01104
$-624
Cash flow
-8.1%
Cash-on-Cash Return
3.8%
Cap rate
0.6%
Rent to Value Ratio
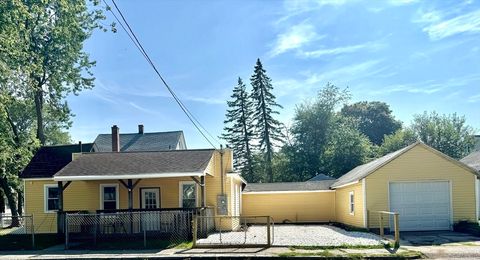
Active
$250,000
2
bds
|
1
ba
|
801
sqft
|
built
1922
140 Wait St, Springfield, MA 01104
$10
Cash flow
0.2%
Cash-on-Cash Return
5.7%
Cap rate
0.7%
Rent to Value Ratio
Active
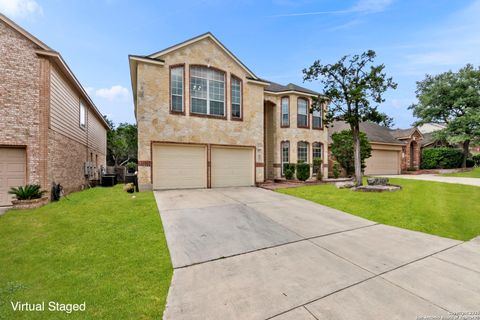
$500,000
5
bds
|
3
ba
|
3,238
sqft
|
built
2006
26415 Walden Oak, San Antonio, TX 78260
$-1,274
Cash flow
-13.3%
Cash-on-Cash Return
2.6%
Cap rate
0.5%
Rent to Value Ratio
Active
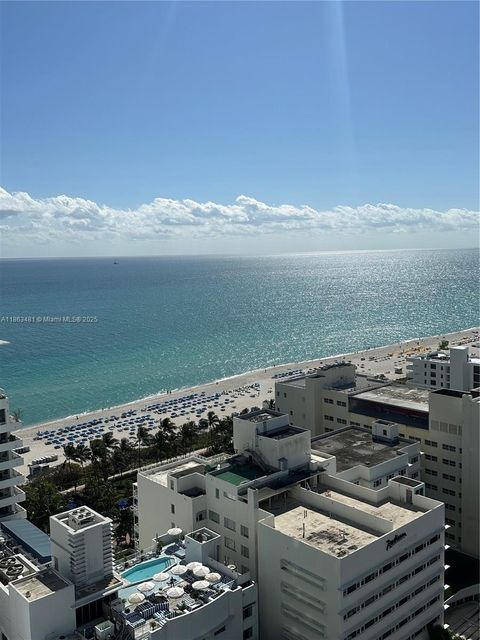
$890,000
bds
|
1
ba
|
526
sqft
|
built
2005
4401 Collins Ave, Miami Beach, FL 33140
$-3,614
Cash flow
-21.2%
Cash-on-Cash Return
1.3%
Cap rate
0.4%
Rent to Value Ratio
Active
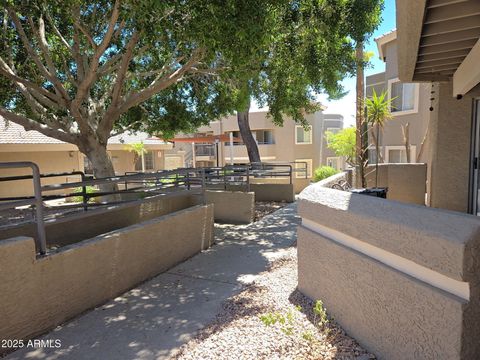
$280,000
2
bds
|
2
ba
|
886
sqft
|
built
1987
1720 E Thunderbird Rd, Phoenix, AZ 85022
$-606
Cash flow
-11.3%
Cash-on-Cash Return
3.1%
Cap rate
0.6%
Rent to Value Ratio
Active
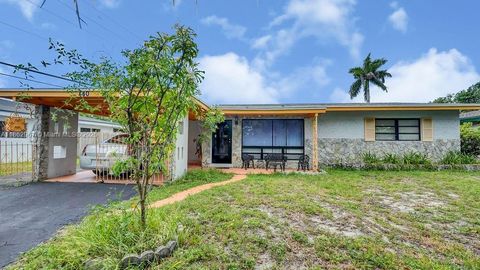
$389,000
2
bds
|
2
ba
|
1,598
sqft
|
built
1958
440 SW 29th Ter, Fort Lauderdale, FL 33312
$-188
Cash flow
-2.5%
Cash-on-Cash Return
5.6%
Cap rate
0.7%
Rent to Value Ratio
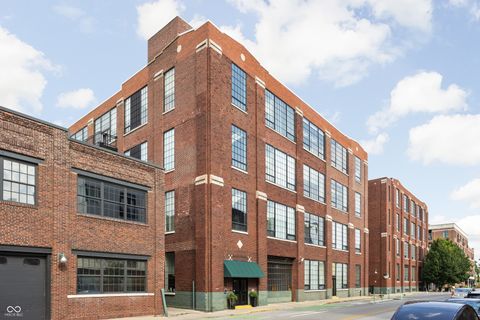
Active
$620,000
2
bds
|
2
ba
|
1,827
sqft
|
built
1922
630 N College Ave, Indianapolis, IN 46204
$-1,946
Cash flow
-16.4%
Cash-on-Cash Return
2.4%
Cap rate
0.5%
Rent to Value Ratio
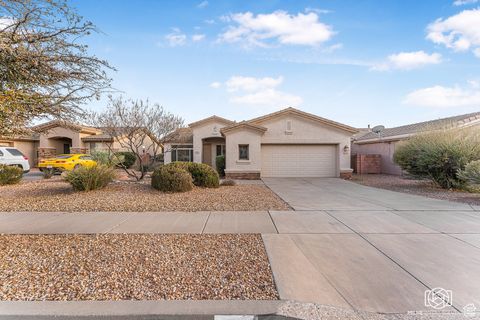
Active
$485,000
3
bds
|
2
ba
|
1,916
sqft
|
built
2001
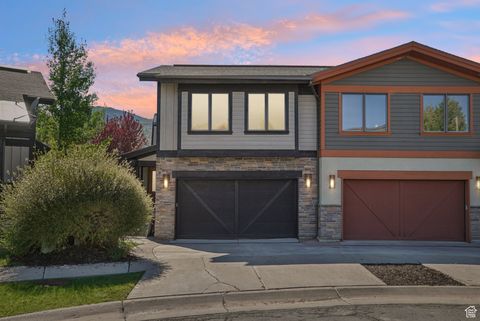
3414 E Willow Springs Dr, Washington, UT 84780
$-959
Cash flow
-10.3%
Cash-on-Cash Return
3.3%
Cap rate
0.5%
Rent to Value Ratio
Active
$935,000
8
bds
|
6
ba
|
4,036
sqft
|
built
2022
3520 Lavender Dr, Davenport, FL 33897
$-3,344
Cash flow
-18.7%
Cash-on-Cash Return
1.9%
Cap rate
0.5%
Rent to Value Ratio
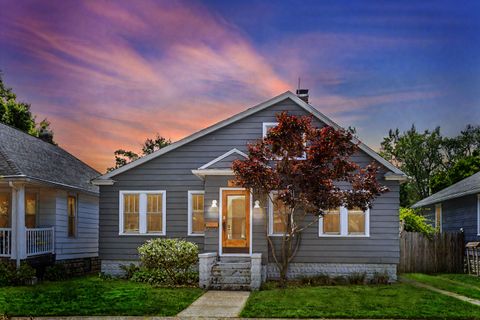
Active
$269,900
2
bds
|
1
ba
|
1,068
sqft
|
built
1928
526 La Salle Ave, Saint Joseph, MI 49085
$-598
Cash flow
-11.6%
Cash-on-Cash Return
3.5%
Cap rate
0.7%
Rent to Value Ratio
Active
$315,000
3
bds
|
2
ba
|
1,474
sqft
|
built
1954
2019 Sunset Dr, Saint Joseph, MI 49085
$-649
Cash flow
-10.7%
Cash-on-Cash Return
3.7%
Cap rate
0.6%
Rent to Value Ratio
Active
$465,000
3
bds
|
2
ba
|
1,956
sqft
|
built
1962
4221 NW 16th Ave, Oakland Park, FL 33309
$-107
Cash flow
-1.2%
Cash-on-Cash Return
5.9%
Cap rate
0.8%
Rent to Value Ratio
Active
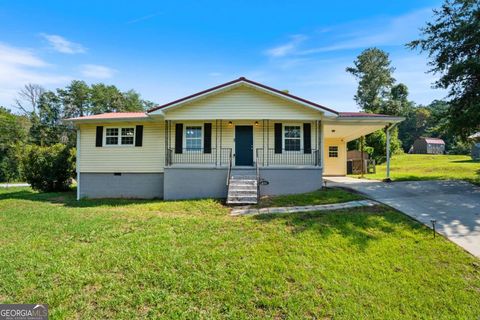
$355,000
3
bds
|
1
ba
|
1,075
sqft
|
built
1954
831 Daniell Dr SE, Smyrna, GA 30080
$-477
Cash flow
-7.0%
Cash-on-Cash Return
4.5%
Cap rate
0.6%
Rent to Value Ratio
Active
$337,900
3
bds
|
2
ba
|
1,190
sqft
|
built
2003
16618 W Tasha Dr, Surprise, AZ 85388
$-520
Cash flow
-8.0%
Cash-on-Cash Return
3.8%
Cap rate
0.5%
Rent to Value Ratio
Active
$650,000
6
bds
|
4
ba
|
3,159
sqft
|
built
1998
4678 W Emmons Dr, West Jordan, UT 84088
$-1,627
Cash flow
-13.1%
Cash-on-Cash Return
2.7%
Cap rate
0.4%
Rent to Value Ratio
Active
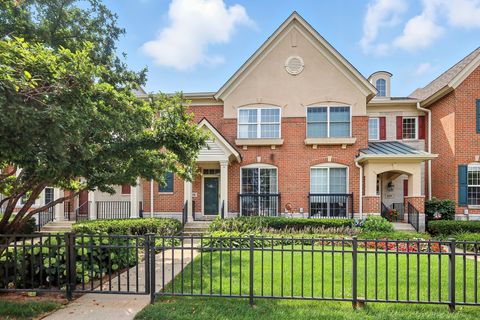
$575,000
3
bds
|
4
ba
|
1,726
sqft
|
built
2001
679 Central Ave, Deerfield, IL 60015
$-1,084
Cash flow
-9.8%
Cash-on-Cash Return
3.4%
Cap rate
0.8%
Rent to Value Ratio
Active
$249,900
3
bds
|
2
ba
|
1,586
sqft
|
built
1996
420 Summit Ridge Pl, Longwood, FL 32779
$-718
Cash flow
-15.0%
Cash-on-Cash Return
2.7%
Cap rate
0.8%
Rent to Value Ratio
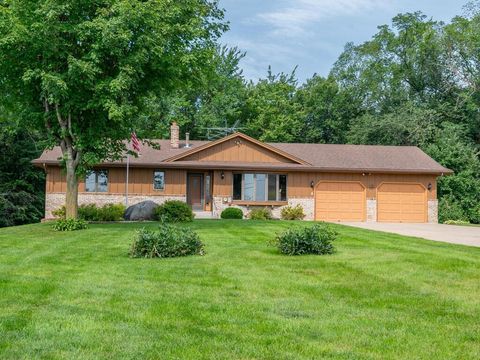
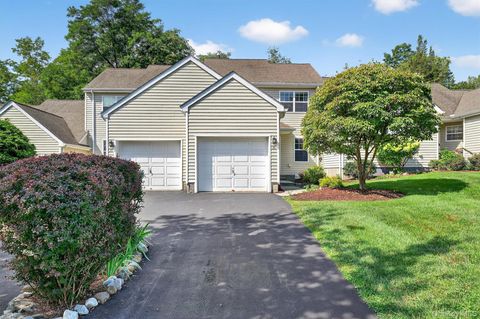
Active
$699,000
4
bds
|
3
ba
|
2,468
sqft
|
built
1985
1760 Mount Hope Rd, Carver, MN 55315
$-1,932
Cash flow
-14.4%
Cash-on-Cash Return
2.4%
Cap rate
0.4%
Rent to Value Ratio
Active
$450,000
3
bds
|
2
ba
|
1,452
sqft
|
built
1992
1265 Comanche Path, Bandera, TX 78003
$-1,044
Cash flow
-12.1%
Cash-on-Cash Return
2.9%
Cap rate
0.5%
Rent to Value Ratio
Active
$999,000
7
bds
|
3
ba
|
3,802
sqft
|
built
1900
447 Boston St, Lynn, MA 01905
$-3,149
Cash flow
-16.4%
Cash-on-Cash Return
1.9%
Cap rate
0.4%
Rent to Value Ratio
Active
$1,475,000
3
bds
|
3
ba
|
2,221
sqft
|
built
2007
1238 Hailstone Dr, Heber City, UT 84032
$-4,147
Cash flow
-14.7%
Cash-on-Cash Return
2.3%
Cap rate
0.3%
Rent to Value Ratio
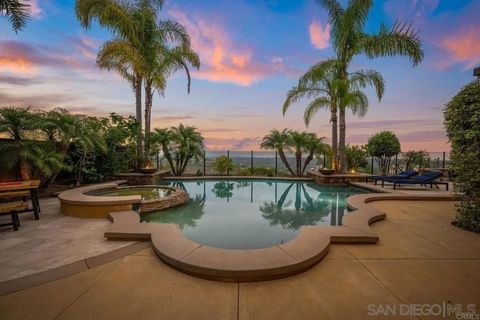
Active
$3,499,900
4
bds
|
5
ba
|
4,757
sqft
|
built
2008
3219 Corte Paloma, Carlsbad, CA 92009
$-12,488
Cash flow
-18.6%
Cash-on-Cash Return
1.8%
Cap rate
0.2%
Rent to Value Ratio
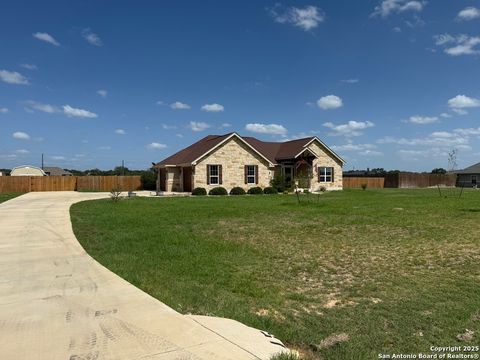
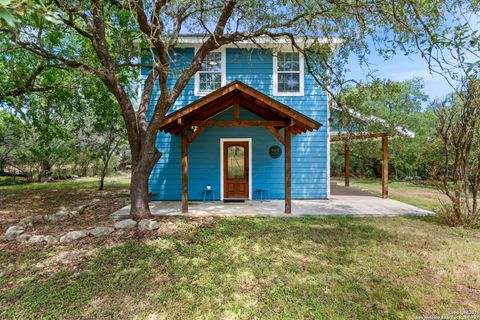
Active
$565,000
3
bds
|
2
ba
|
2,520
sqft
|
built
2018
153 Westfield Lndg, La Vernia, TX 78121
$-1,514
Cash flow
-14.0%
Cash-on-Cash Return
2.5%
Cap rate
0.5%
Rent to Value Ratio
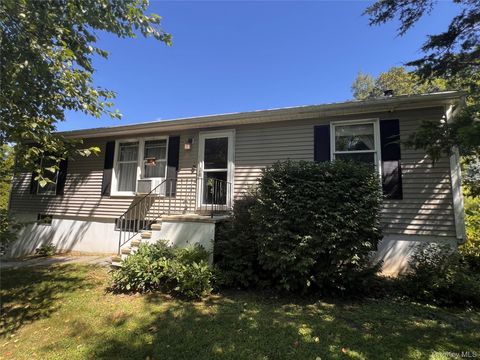
Active
$419,000
3
bds
|
2
ba
|
1,144
sqft
|
built
1993
5 Red Cedar Ln, Millerton, NY 12546
$-613
Cash flow
-7.6%
Cash-on-Cash Return
4.3%
Cap rate
0.7%
Rent to Value Ratio
Active
$230,000
3
bds
|
2
ba
|
1,253
sqft
|
built
1972
415 Springdale Rd, Rockmart, GA 30153
$-197
Cash flow
-4.5%
Cash-on-Cash Return
5.1%
Cap rate
0.7%
Rent to Value Ratio
Active
$410,000
2
bds
|
2
ba
|
1,392
sqft
|
built
1990
38 Prestwick Ct, Poughkeepsie, NY 12603
$-1,408
Cash flow
-17.9%
Cash-on-Cash Return
1.9%
Cap rate
0.7%
Rent to Value Ratio
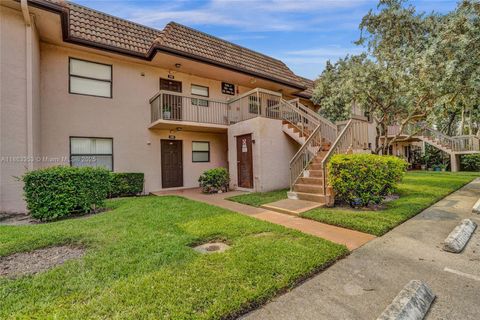
Active
$245,000
2
bds
|
2
ba
|
806
sqft
|
built
1986
1156 NW 106th Ter, Pembroke Pines, FL 33026
$-236
Cash flow
-5.0%
Cash-on-Cash Return
5.0%
Cap rate
0.9%
Rent to Value Ratio

Active
$599,000
3
bds
|
2
ba
|
2,623
sqft
|
built
1983
1249 Heritage Hills Cir, Snellville, GA 30078
$-1,429
Cash flow
-12.4%
Cash-on-Cash Return
3.3%
Cap rate
0.4%
Rent to Value Ratio
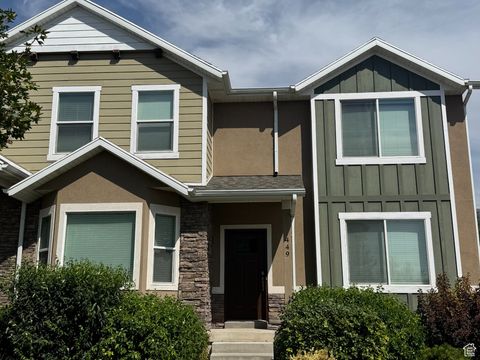
Active
$349,900
3
bds
|
3
ba
|
1,481
sqft
|
built
2015
449 E 2170 N, Logan, UT 84341
$-804
Cash flow
-12.0%
Cash-on-Cash Return
2.9%
Cap rate
0.5%
Rent to Value Ratio
Active
$1,199,900
8
bds
|
5
ba
|
0
sqft
|
built
2018
6616 S Figueroa St, Los Angeles, CA 90003
$-4,066
Cash flow
-17.7%
Cash-on-Cash Return
2.0%
Cap rate
0.2%
Rent to Value Ratio
Active
$234,900
2
bds
|
2
ba
|
0
sqft
|
built
1975
1425 Sandpebble Dr, Wheeling, IL 60090
$-245
Cash flow
-5.4%
Cash-on-Cash Return
4.4%
Cap rate
0.9%
Rent to Value Ratio
Active
$1,189,000
6
bds
|
6
ba
|
5,522
sqft
|
built
2012
15896 N Gray Rd, Noblesville, IN 46062
$-3,055
Cash flow
-13.4%
Cash-on-Cash Return
3.1%
Cap rate
0.4%
Rent to Value Ratio
Active
$295,000
3
bds
|
2
ba
|
1,700
sqft
|
built
1992
10303 N Andover Coach Ln, Wellington, FL 33449
$-789
Cash flow
-14.0%
Cash-on-Cash Return
2.9%
Cap rate
0.9%
Rent to Value Ratio
Active
$308,000
3
bds
|
2.1
ba
|
0
sqft
|
built
1988
8463 Stoksund Cv, Cordova, TN 38018
$-219
Cash flow
-3.7%
Cash-on-Cash Return
4.8%
Cap rate
0.7%
Rent to Value Ratio
Active
$749,000
4
bds
|
2
ba
|
2,201
sqft
|
built
1986
8626 NW 50th Dr, Coral Springs, FL 33067
$-1,623
Cash flow
-11.3%
Cash-on-Cash Return
3.5%
Cap rate
0.6%
Rent to Value Ratio

Active
$285,000
3
bds
|
2
ba
|
1,434
sqft
|
built
1960
56915 Wilbur Hill Rd, Dowagiac, MI 49047
$-559
Cash flow
-10.2%
Cash-on-Cash Return
3.8%
Cap rate
0.5%
Rent to Value Ratio
Active
$749,500
3
bds
|
2.5
ba
|
2,249
sqft
|
built
1996
2254 Wayside Dr NE, Brookhaven, GA 30319
$-1,796
Cash flow
-12.5%
Cash-on-Cash Return
3.3%
Cap rate
0.5%
Rent to Value Ratio