United States Investment Properties for Sale
Browse homes for sale and investment properties in United States. Refine your search by price, property type, or more.
Best cash flowing properties in United States
Active
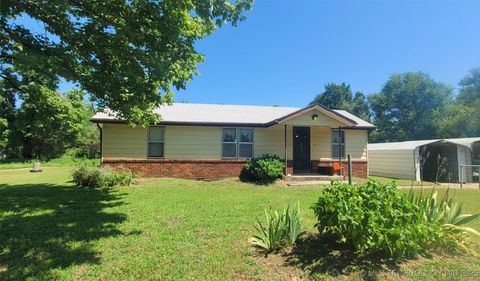
$82,500
2
bds
|
2
ba
|
1,646
sqft
|
built
1965
110 W 6th St, Oilton, OK 74052
$471
Cash flow
29.8%
Cash-on-Cash Return
12.5%
Cap rate
1.6%
Rent to Value Ratio
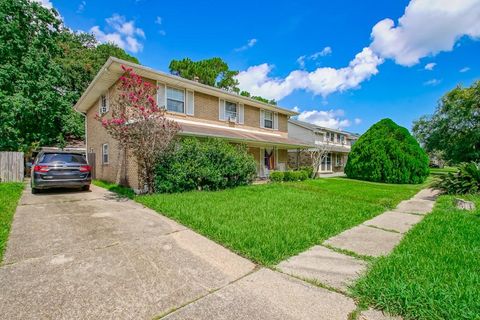
Active
$275,000
5
bds
|
3
ba
|
2,462
sqft
|
built
1967
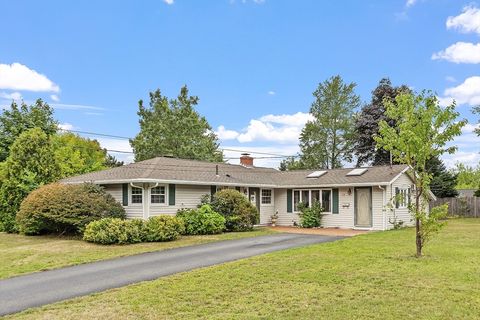
2333 Beck St, New Orleans, LA 70131
$424
Cash flow
8.0%
Cash-on-Cash Return
7.5%
Cap rate
0.9%
Rent to Value Ratio
10,000 out of 338,511 properties for sale in United States
Limited Results Shown
Create a free account, or log in to reveal all property listings and enjoy the complete experience.
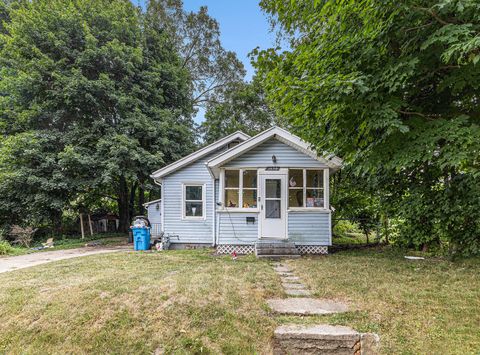
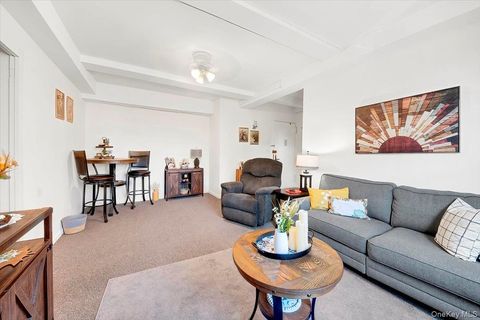
Active
$117,900
2
bds
|
1
ba
|
756
sqft
|
built
1940
1638 Cherry St, Niles, MI 49120
$237
Cash flow
10.5%
Cash-on-Cash Return
8.6%
Cap rate
1.2%
Rent to Value Ratio
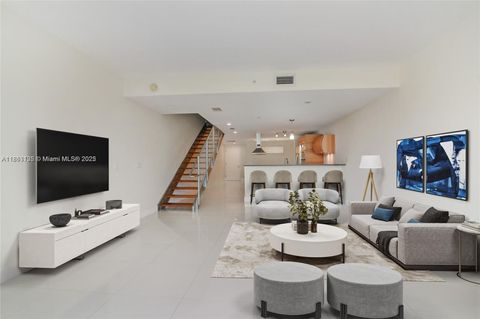
Active
$699,000
2
bds
|
3
ba
|
1,663
sqft
|
built
2008
2950 NE 188th St, Aventura, FL 33180
$-2,931
Cash flow
-21.9%
Cash-on-Cash Return
1.1%
Cap rate
0.7%
Rent to Value Ratio
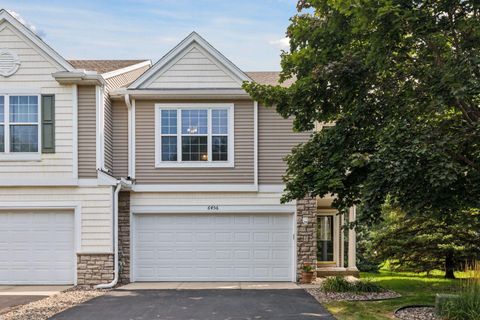
Active
$305,000
2
bds
|
3
ba
|
1,536
sqft
|
built
2002
6456 157th St W, Apple Valley, MN 55124
$-435
Cash flow
-7.4%
Cash-on-Cash Return
4.0%
Cap rate
0.8%
Rent to Value Ratio
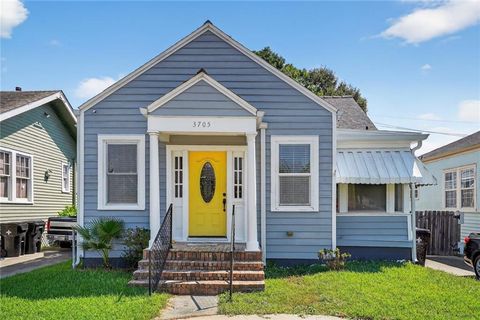
Active
$265,000
3
bds
|
2
ba
|
1,497
sqft
|
built
1969
3705 Fairmont Dr, New Orleans, LA 70122
$264
Cash flow
5.2%
Cash-on-Cash Return
6.9%
Cap rate
0.8%
Rent to Value Ratio
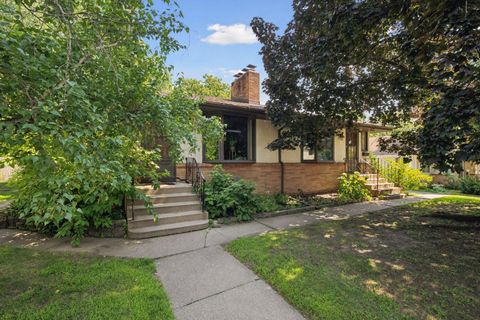
Active
$749,900
5
bds
|
3
ba
|
3,219
sqft
|
built
1960
4937 Sheridan Ave S, Minneapolis, MN 55410
$-2,907
Cash flow
-20.2%
Cash-on-Cash Return
1.0%
Cap rate
0.3%
Rent to Value Ratio
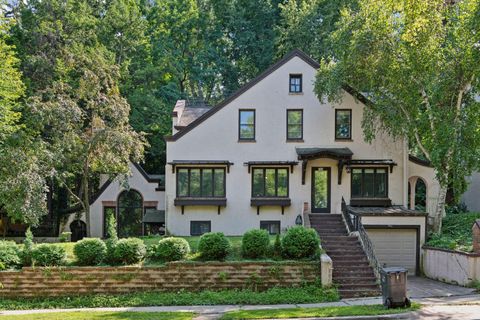
Active
$649,000
3
bds
|
4
ba
|
3,700
sqft
|
built
1919
741 Kenwood Pkwy, Minneapolis, MN 55403
$-1,221
Cash flow
-9.8%
Cash-on-Cash Return
3.4%
Cap rate
0.6%
Rent to Value Ratio
Active
$450,000
2
bds
|
3
ba
|
1,600
sqft
|
built
2016
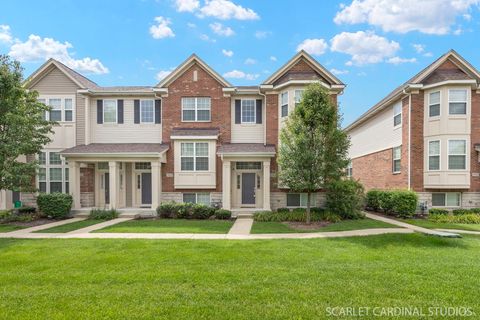
2925 Henley Ln, Naperville, IL 60540
$-970
Cash flow
-11.2%
Cash-on-Cash Return
3.1%
Cap rate
0.7%
Rent to Value Ratio
Active
$239,000
1
bds
|
1
ba
|
700
sqft
|
built
1940
1595 Metropolitan Ave, Bronx, NY 10462
$-774
Cash flow
-16.9%
Cash-on-Cash Return
2.2%
Cap rate
0.9%
Rent to Value Ratio
Active
$1,200,000
4
bds
|
4
ba
|
3,040
sqft
|
built
2025
54 Hazelton Rd, Yonkers, NY 10710
$-3,222
Cash flow
-14.0%
Cash-on-Cash Return
2.8%
Cap rate
0.5%
Rent to Value Ratio

Active
$315,000
3
bds
|
2
ba
|
1,566
sqft
|
built
2023
4229 SW 169th Lane Rd, Ocala, FL 34473
$-683
Cash flow
-11.3%
Cash-on-Cash Return
3.5%
Cap rate
0.6%
Rent to Value Ratio
Active
$475,000
5
bds
|
4
ba
|
3,737
sqft
|
built
1954
2024 7th St NW, Grand Rapids, MI 49504
$-871
Cash flow
-9.6%
Cash-on-Cash Return
3.9%
Cap rate
0.6%
Rent to Value Ratio
Active
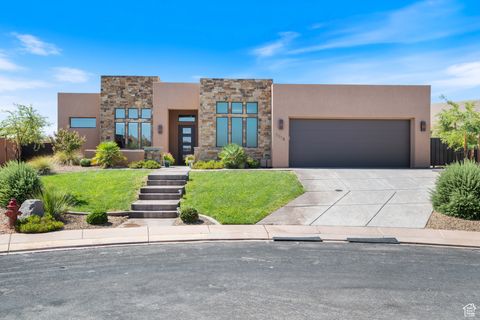
$1,100,000
4
bds
|
3
ba
|
2,600
sqft
|
built
2021
5378 W 3200 S, Hurricane, UT 84737
$-3,572
Cash flow
-16.9%
Cash-on-Cash Return
1.8%
Cap rate
0.3%
Rent to Value Ratio
Active
$415,000
2
bds
|
2
ba
|
1,412
sqft
|
built
2012
44 E 1300 N, Brigham City, UT 84302
$-1,034
Cash flow
-13.0%
Cash-on-Cash Return
2.7%
Cap rate
0.4%
Rent to Value Ratio

Active
$512,000
3
bds
|
2
ba
|
1,244
sqft
|
built
1952
1985 NE 177th St, North Miami Beach, FL 33162
$-943
Cash flow
-9.6%
Cash-on-Cash Return
3.9%
Cap rate
0.6%
Rent to Value Ratio
Active
$260,000
2
bds
|
2
ba
|
822
sqft
|
built
1974
3582 NE 171st St, North Miami Beach, FL 33160
$-690
Cash flow
-13.8%
Cash-on-Cash Return
3.0%
Cap rate
0.8%
Rent to Value Ratio
Active
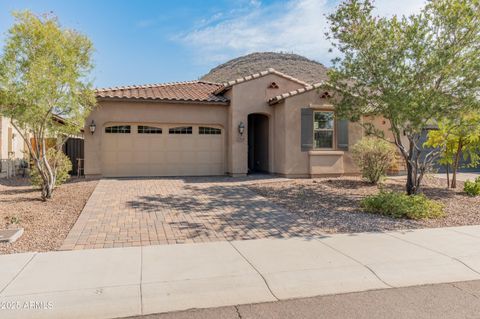
$510,000
3
bds
|
2
ba
|
1,841
sqft
|
built
2016
12764 W Caraveo Pl, Peoria, AZ 85383
$-868
Cash flow
-8.9%
Cash-on-Cash Return
3.6%
Cap rate
0.5%
Rent to Value Ratio
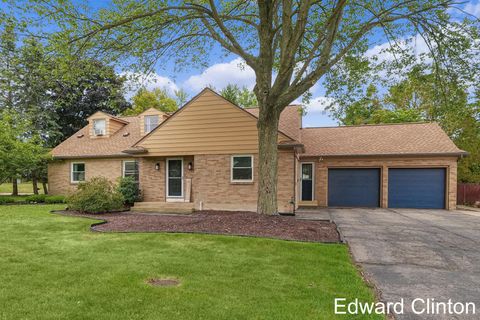
Active
$387,900
3
bds
|
3
ba
|
2,092
sqft
|
built
1975
8343 Atlas Dr, Brighton, MI 48116
$-678
Cash flow
-9.1%
Cash-on-Cash Return
4.0%
Cap rate
0.6%
Rent to Value Ratio
Active
$659,900
3
bds
|
2
ba
|
1,703
sqft
|
built
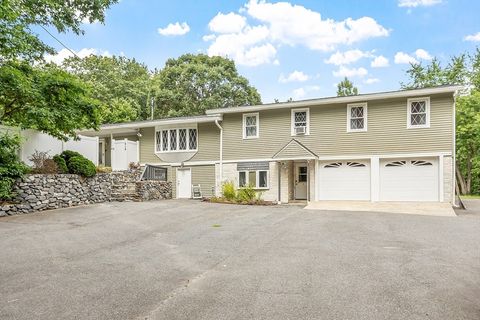
1955
115 Richard Rd, Braintree, MA 02184
$-877
Cash flow
-6.9%
Cash-on-Cash Return
4.1%
Cap rate
0.5%
Rent to Value Ratio
Active
$494,900
3
bds
|
2
ba
|
1,328
sqft
|
built
2004
3837 Riedel Ave, Palm Springs, FL 33461
$-1,217
Cash flow
-12.8%
Cash-on-Cash Return
3.2%
Cap rate
0.6%
Rent to Value Ratio

Active
$275,000
3
bds
|
2
ba
|
1,125
sqft
|
built
1917
3835 Vincent Ave N, Minneapolis, MN 55412
$-89
Cash flow
-1.7%
Cash-on-Cash Return
5.3%
Cap rate
0.8%
Rent to Value Ratio
Active
$440,000
1
bds
|
1
ba
|
903
sqft
|
built
2007
133 NE 2nd Ave, Miami, FL 33132
$-1,378
Cash flow
-16.3%
Cash-on-Cash Return
2.4%
Cap rate
0.7%
Rent to Value Ratio
Active
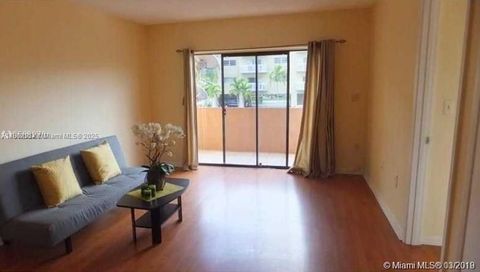
$395,000
2
bds
|
2
ba
|
1,832
sqft
|
built
1979
501 Lake Hinsdale Dr, Willowbrook, IL 60527
$-476
Cash flow
-6.3%
Cash-on-Cash Return
4.2%
Cap rate
0.8%
Rent to Value Ratio
Active
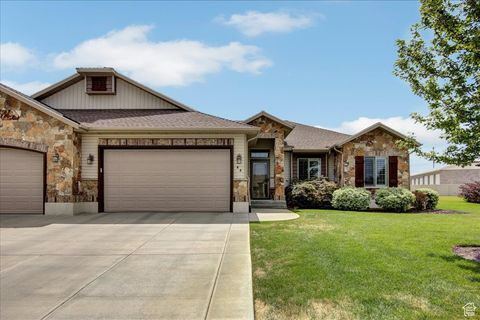
$449,000
3
bds
|
2
ba
|
1,896
sqft
|
built
1985
186 S 200 W, Washington, UT 84780
$-855
Cash flow
-9.9%
Cash-on-Cash Return
3.4%
Cap rate
0.4%
Rent to Value Ratio
Active
$599,900
12
bds
|
3
ba
|
3,709
sqft
|
built
1900
25 Cohasse St, Southbridge, MA 01550
$-1,629
Cash flow
-14.2%
Cash-on-Cash Return
2.4%
Cap rate
0.4%
Rent to Value Ratio
Active
$199,900
2
bds
|
2
ba
|
1,414
sqft
|
built
1900
1282 Ashville Rd, Leeds, AL 35094
$20
Cash flow
0.5%
Cash-on-Cash Return
5.8%
Cap rate
0.7%
Rent to Value Ratio
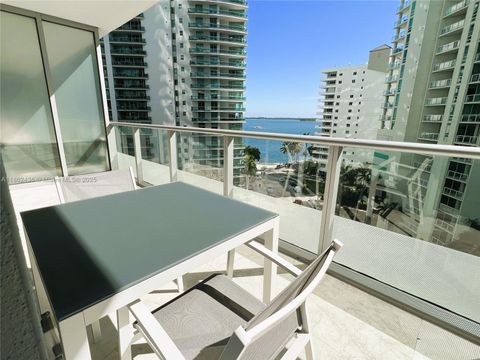
Active
$635,000
1
bds
|
1
ba
|
701
sqft
|
built
2014
1300 Brickell Bay Dr, Miami, FL 33131
$-1,727
Cash flow
-14.2%
Cash-on-Cash Return
2.9%
Cap rate
0.7%
Rent to Value Ratio
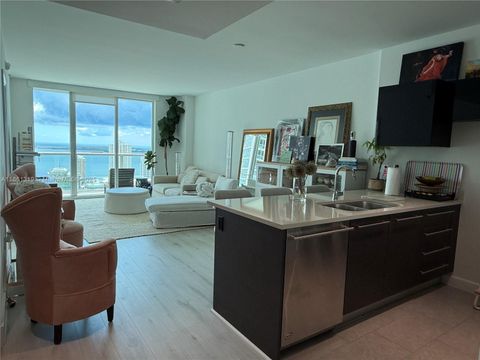
Active
$595,000
1
bds
|
1
ba
|
806
sqft
|
built
2009
500 Brickell Ave, Miami, FL 33131
$-2,072
Cash flow
-18.2%
Cash-on-Cash Return
2.0%
Cap rate
0.7%
Rent to Value Ratio
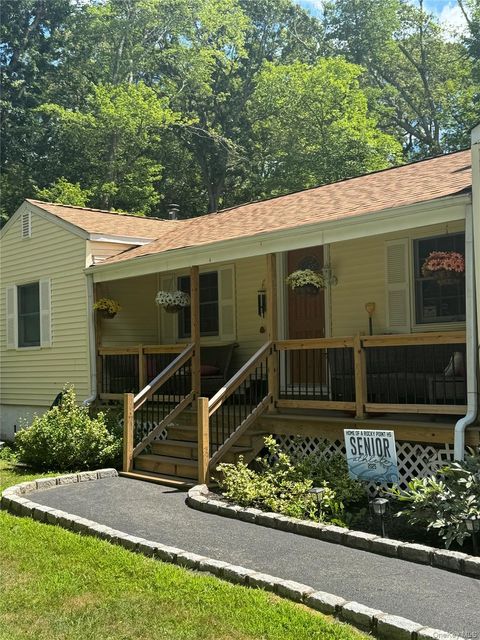
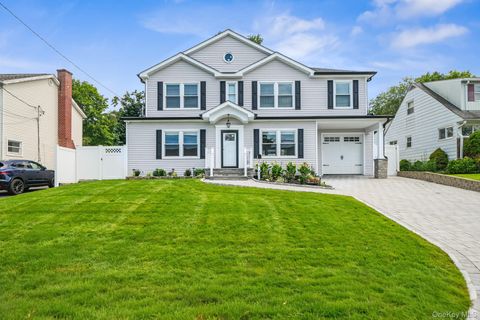
Active
$489,000
3
bds
|
1
ba
|
1,160
sqft
|
built
1945
238 Locust Dr, Rocky Point, NY 11778
$-732
Cash flow
-7.8%
Cash-on-Cash Return
4.3%
Cap rate
0.7%
Rent to Value Ratio
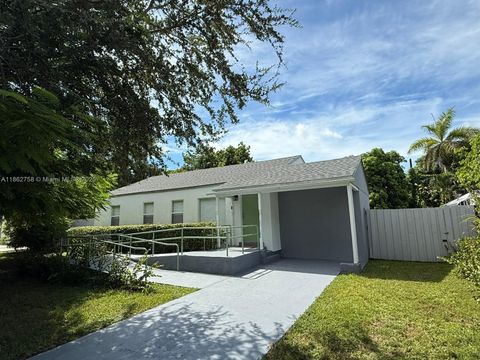
Active
$875,000
3
bds
|
2
ba
|
1,199
sqft
|
built
1948
5822 SW 60th St, Miami, FL 33143
$-2,746
Cash flow
-16.4%
Cash-on-Cash Return
2.4%
Cap rate
0.4%
Rent to Value Ratio
Active
$245,000
2
bds
|
2
ba
|
0
sqft
|
built
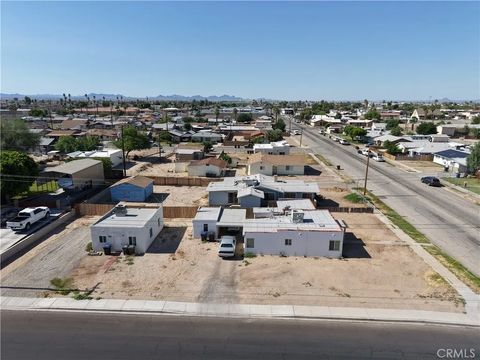
1937
290 N 3rd St, Blythe, CA 92225
$-273
Cash flow
-5.8%
Cash-on-Cash Return
4.7%
Cap rate
0.6%
Rent to Value Ratio
Active
$780,000
6
bds
|
3
ba
|
3,443
sqft
|
built
1951
51 Old City Rd, Townsend, MA 01474
$-2,200
Cash flow
-14.7%
Cash-on-Cash Return
2.3%
Cap rate
0.4%
Rent to Value Ratio
Active
$179,000
2
bds
|
1
ba
|
964
sqft
|
built
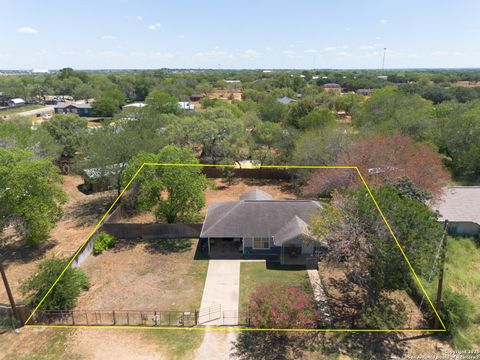
1997
804 County Line Rd, Jourdanton, TX 78026
$119
Cash flow
3.5%
Cash-on-Cash Return
6.5%
Cap rate
0.8%
Rent to Value Ratio
Active
$1,295,000
3
bds
|
2
ba
|
1,703
sqft
|
built
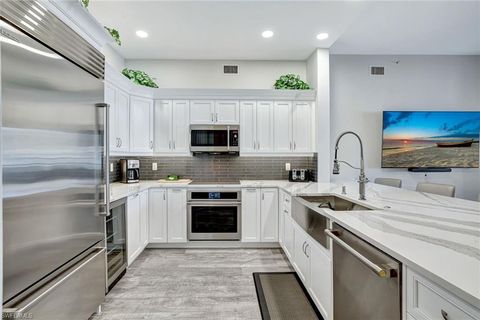
1996
770 Bentwater Cir, Naples, FL 34108
$-4,802
Cash flow
-19.3%
Cash-on-Cash Return
1.7%
Cap rate
0.4%
Rent to Value Ratio
Active
$550,000
3
bds
|
3
ba
|
1,056
sqft
|
built
1926
8280 NW 5th Ave, Miami, FL 33150
$-1,287
Cash flow
-12.2%
Cash-on-Cash Return
3.3%
Cap rate
0.5%
Rent to Value Ratio
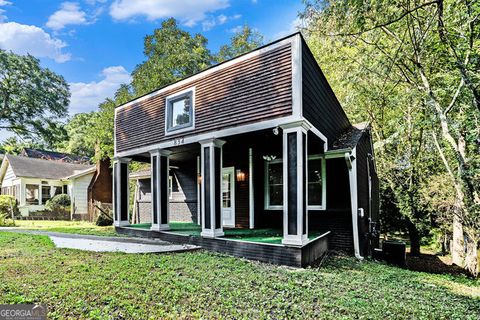
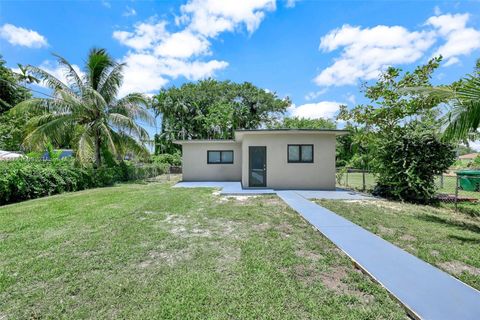
Active
$299,000
3
bds
|
2
ba
|
1,280
sqft
|
built
1966
834 Woods Dr NW, Atlanta, GA 30318
$-281
Cash flow
-4.9%
Cash-on-Cash Return
5.0%
Cap rate
0.8%
Rent to Value Ratio
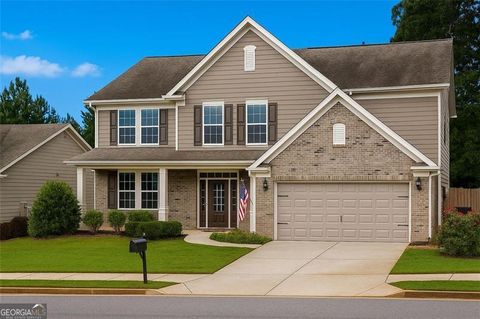
Active
$465,000
4
bds
|
2.5
ba
|
2,932
sqft
|
built
2016
824 Commerce Trl, Canton, GA 30114
$-745
Cash flow
-8.4%
Cash-on-Cash Return
4.2%
Cap rate
0.6%
Rent to Value Ratio
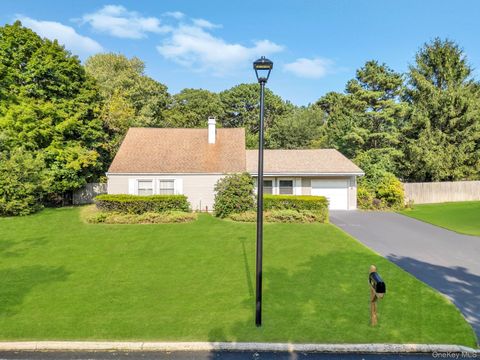
Active
$549,999
5
bds
|
2
ba
|
1,684
sqft
|
built
1972
75 White Pine Way, Medford, NY 11763
$-1,457
Cash flow
-13.8%
Cash-on-Cash Return
2.9%
Cap rate
0.6%
Rent to Value Ratio
Active
$390,000
4
bds
|
2.5
ba
|
3,161
sqft
|
built
2006
2356 Mc Intosh Dr, Locust Grove, GA 30248
$-738
Cash flow
-9.9%
Cash-on-Cash Return
3.9%
Cap rate
0.6%
Rent to Value Ratio