United States Investment Properties for Sale
Browse homes for sale and investment properties in United States. Refine your search by price, property type, or more.
Best cash flowing properties in United States
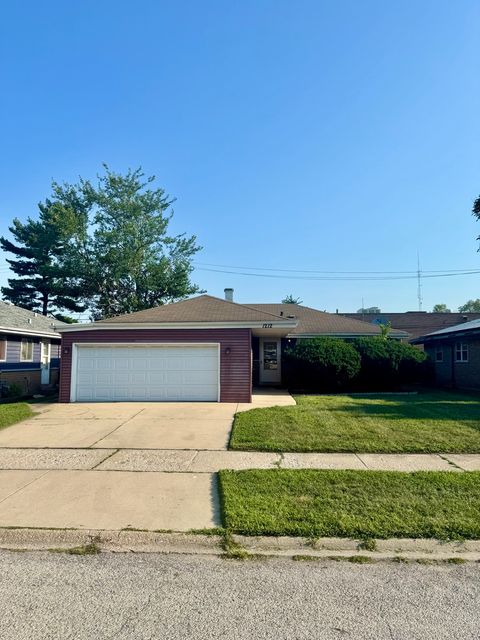
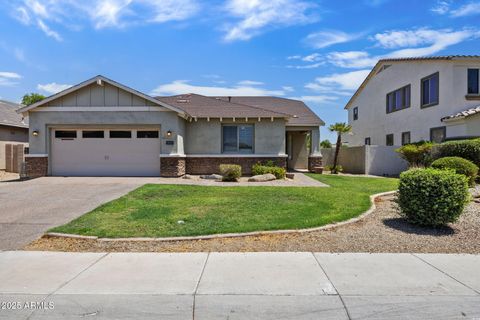
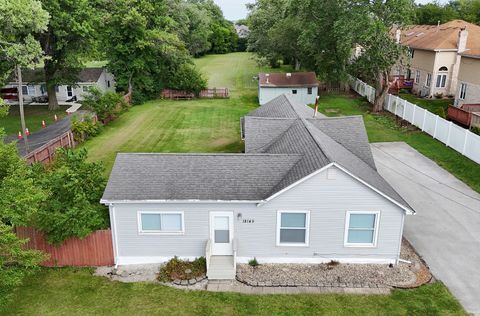
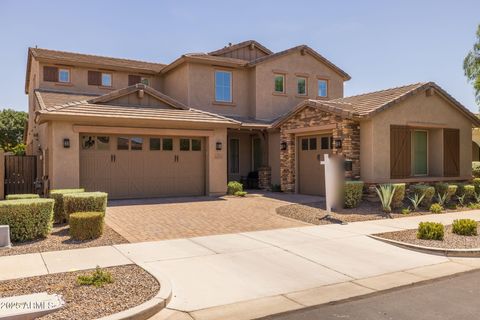
Active
$194,000
3
bds
|
1
ba
|
1,204
sqft
|
built
1958
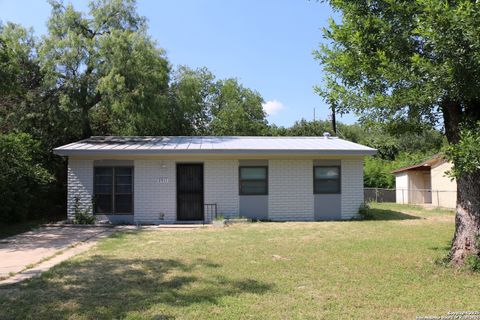
1212 E 151st St, Dolton, IL 60419
$152
Cash flow
4.1%
Cash-on-Cash Return
6.6%
Cap rate
1.2%
Rent to Value Ratio
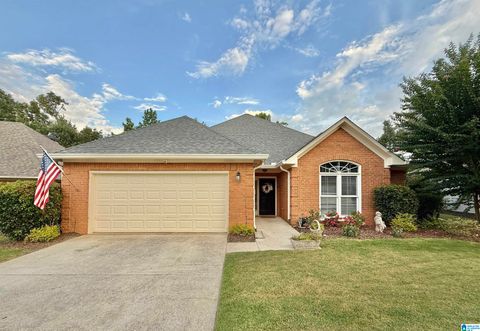
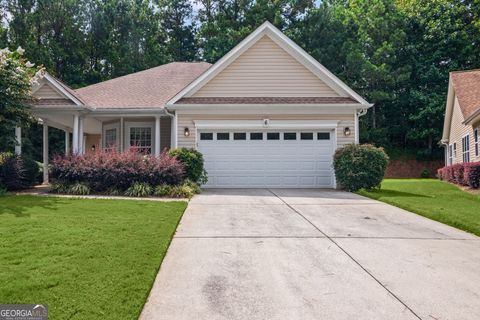
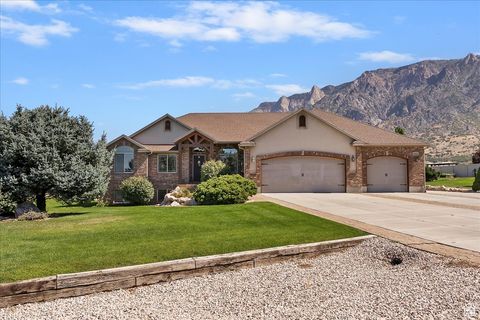
Active
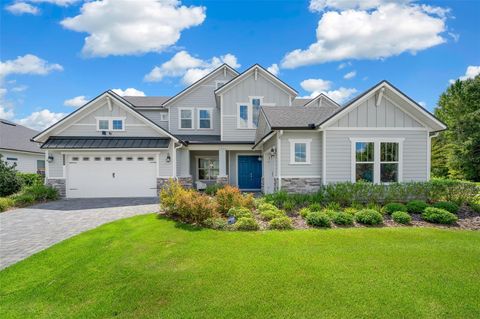
$379,900
3
bds
|
2
ba
|
1,824
sqft
|
built
1996
6567 Mill Creek Cir, Hoover, AL 35242
$-148
Cash flow
-2.0%
Cash-on-Cash Return
5.2%
Cap rate
0.7%
Rent to Value Ratio
10,000 out of 322,834 properties for sale in United States
Limited Results Shown
Create a free account, or log in to reveal all property listings and enjoy the complete experience.
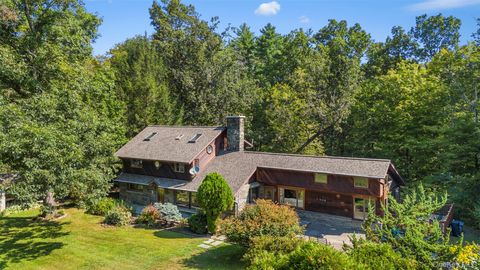
Active
$795,000
3
bds
|
2
ba
|
2,390
sqft
|
built
1955
1 Blues Quarry, Saugerties, NY 12477
$-2,044
Cash flow
-13.4%
Cash-on-Cash Return
3.0%
Cap rate
0.6%
Rent to Value Ratio
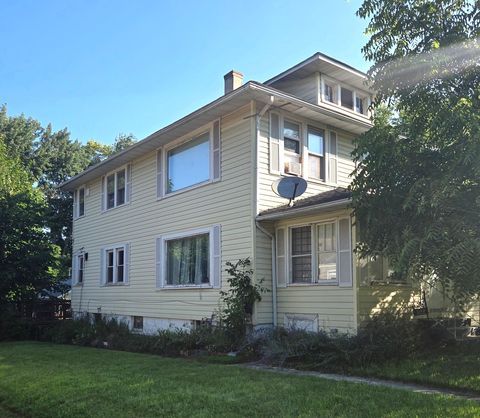
Active
$238,000
4
bds
|
2
ba
|
0
sqft
|
built
1920
522 George Ave, Waukegan, IL 60085
$-175
Cash flow
-3.8%
Cash-on-Cash Return
4.8%
Cap rate
0.8%
Rent to Value Ratio
Active
$1,050,000
6
bds
|
4
ba
|
3,916
sqft
|
built
2022
3579 SW 111th Dr, Gainesville, FL 32608
$-3,573
Cash flow
-17.8%
Cash-on-Cash Return
2.1%
Cap rate
0.5%
Rent to Value Ratio
Active
$999,999
3
bds
|
4
ba
|
3,191
sqft
|
built
2015
1328 Riverside Ln, Mendota Heights, MN 55118
$-3,723
Cash flow
-19.4%
Cash-on-Cash Return
1.2%
Cap rate
0.3%
Rent to Value Ratio
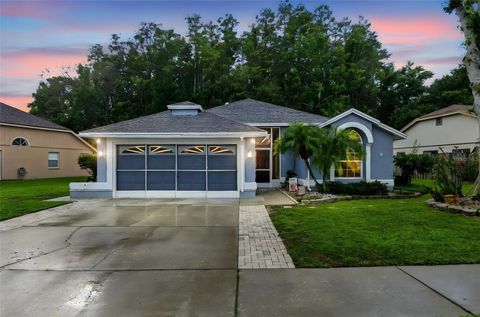
Active
$279,900
3
bds
|
1
ba
|
1,023
sqft
|
built
1985
1242 Mohrlake Dr, Brandon, FL 33511
$-394
Cash flow
-7.3%
Cash-on-Cash Return
4.5%
Cap rate
0.7%
Rent to Value Ratio
Active
$999,990
4
bds
|
3
ba
|
3,392
sqft
|
built
1999
18410 Jackson St NE, East Bethel, MN 55011
$-3,250
Cash flow
-17.0%
Cash-on-Cash Return
1.8%
Cap rate
0.3%
Rent to Value Ratio
Active
$695,000
3
bds
|
3
ba
|
2,001
sqft
|
built
2005
8312 Tobago Ln, Wellington, FL 33414
$-2,003
Cash flow
-15.0%
Cash-on-Cash Return
2.7%
Cap rate
0.6%
Rent to Value Ratio
Active
$425,000
5
bds
|
3
ba
|
2,959
sqft
|
built
2021
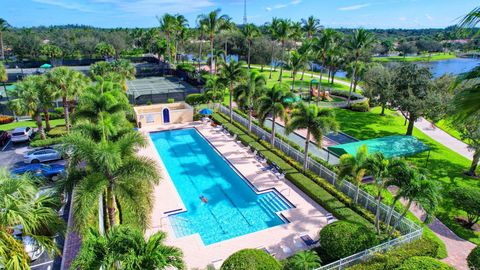
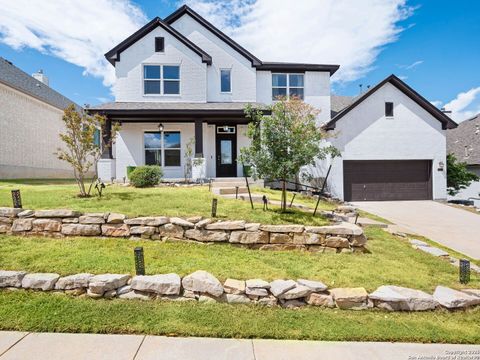
13826 Chester Knl, San Antonio, TX 78253
$-901
Cash flow
-11.1%
Cash-on-Cash Return
3.1%
Cap rate
0.6%
Rent to Value Ratio
Active
$179,900
3
bds
|
2
ba
|
962
sqft
|
built
1971
2911 Cumbre Dr, San Antonio, TX 78237
$-298
Cash flow
-8.6%
Cash-on-Cash Return
3.7%
Cap rate
0.7%
Rent to Value Ratio
Active
$239,900
3
bds
|
2
ba
|
1,243
sqft
|
built
1980
9134 Ocean Gate St, San Antonio, TX 78242
$-439
Cash flow
-9.5%
Cash-on-Cash Return
3.5%
Cap rate
0.7%
Rent to Value Ratio
Active
$569,900
5
bds
|
4
ba
|
4,228
sqft
|
built
2006
2747 Trinity Vw, San Antonio, TX 78261
$-1,705
Cash flow
-15.6%
Cash-on-Cash Return
2.1%
Cap rate
0.5%
Rent to Value Ratio

Active
$420,000
4
bds
|
3
ba
|
2,621
sqft
|
built
1966
3703 Newrock Dr, San Antonio, TX 78230
$-1,021
Cash flow
-12.7%
Cash-on-Cash Return
2.8%
Cap rate
0.5%
Rent to Value Ratio
Active
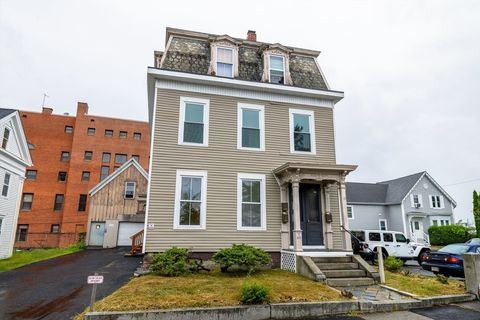
$825,000
8
bds
|
3
ba
|
3,490
sqft
|
built
1856
10 Sycamore St, Worcester, MA 01608
$-2,440
Cash flow
-15.4%
Cash-on-Cash Return
2.1%
Cap rate
0.4%
Rent to Value Ratio
Active
$349,900
2
bds
|
2
ba
|
1,088
sqft
|
built
1900
63 Orange St, Attleboro, MA 02703
$-499
Cash flow
-7.4%
Cash-on-Cash Return
4.0%
Cap rate
0.6%
Rent to Value Ratio
Active
$340,000
4
bds
|
3
ba
|
2,362
sqft
|
built
2002
1820 Highland Trl, Saint Cloud, MN 56301
$-406
Cash flow
-6.2%
Cash-on-Cash Return
4.2%
Cap rate
0.6%
Rent to Value Ratio
Active
$420,000
4
bds
|
2
ba
|
2,319
sqft
|
built
2005
151 N 109th Ave, Avondale, AZ 85323
$-659
Cash flow
-8.2%
Cash-on-Cash Return
3.8%
Cap rate
0.5%
Rent to Value Ratio
Active
$350,000
2
bds
|
2
ba
|
1,666
sqft
|
built
2004
6 Scenic Hills Dr, Newnan, GA 30265
$-479
Cash flow
-7.1%
Cash-on-Cash Return
4.5%
Cap rate
0.6%
Rent to Value Ratio
Active
$599,000
3
bds
|
2
ba
|
2,053
sqft
|
built
1974
2457 E Ivy St, Mesa, AZ 85213
$-1,004
Cash flow
-8.7%
Cash-on-Cash Return
3.7%
Cap rate
0.5%
Rent to Value Ratio

Active
$496,000
3
bds
|
2
ba
|
1,690
sqft
|
built
1960
616 N Freestone Cir, Mesa, AZ 85203
$-899
Cash flow
-9.5%
Cash-on-Cash Return
3.5%
Cap rate
0.5%
Rent to Value Ratio
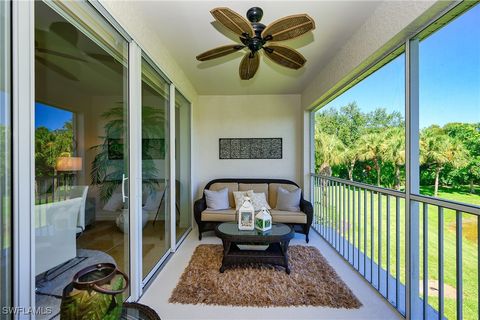
Active
$324,900
2
bds
|
2
ba
|
1,432
sqft
|
built
2002
14581 Sherbrook Pl, Fort Myers, FL 33912
$-1,098
Cash flow
-17.6%
Cash-on-Cash Return
2.1%
Cap rate
0.7%
Rent to Value Ratio
Active
$499,000
3
bds
|
2
ba
|
1,488
sqft
|
built
1936
18145 Harlem Ave, Tinley Park, IL 60477
$-886
Cash flow
-9.3%
Cash-on-Cash Return
3.5%
Cap rate
0.6%
Rent to Value Ratio
Active
$320,000
3
bds
|
2
ba
|
1,499
sqft
|
built
1990
4651 Rowe Dr, New Port Richey, FL 34653
$-297
Cash flow
-4.8%
Cash-on-Cash Return
5.0%
Cap rate
0.7%
Rent to Value Ratio
Active
$1,575,000
5
bds
|
4
ba
|
4,578
sqft
|
built
2014
9 Washington Ave, Woburn, MA 01801
$-2,357
Cash flow
-7.8%
Cash-on-Cash Return
3.9%
Cap rate
0.6%
Rent to Value Ratio

Active
$735,000
4
bds
|
4
ba
|
2,507
sqft
|
built
1999
5129 Inagua Way, Naples, FL 34119
$-1,191
Cash flow
-8.5%
Cash-on-Cash Return
4.2%
Cap rate
0.7%
Rent to Value Ratio
Active
$519,000
3
bds
|
3
ba
|
1,818
sqft
|
built
2002
3048 Horizon Ln, Naples, FL 34109
$-1,644
Cash flow
-16.5%
Cash-on-Cash Return
2.3%
Cap rate
0.6%
Rent to Value Ratio
Active
$499,000
2
bds
|
2
ba
|
1,540
sqft
|
built
2006
7824 Umberto Ct, Naples, FL 34114
$-1,192
Cash flow
-12.5%
Cash-on-Cash Return
3.3%
Cap rate
0.6%
Rent to Value Ratio
Active
$365,000
2
bds
|
2
ba
|
1,751
sqft
|
built
2004
7010 Willow Pine Way, Port Saint Lucie, FL 34986
$-1,159
Cash flow
-16.6%
Cash-on-Cash Return
2.3%
Cap rate
0.7%
Rent to Value Ratio
Active
$329,900
4
bds
|
3
ba
|
2,668
sqft
|
built
2007
205 Rustic Acres, Selma, TX 78154
$-556
Cash flow
-8.8%
Cash-on-Cash Return
3.7%
Cap rate
0.7%
Rent to Value Ratio
Active
$599,900
3
bds
|
3
ba
|
3,100
sqft
|
built
2002
988 County Road T, Hammond, WI 54015
$-1,046
Cash flow
-9.1%
Cash-on-Cash Return
4.1%
Cap rate
0.6%
Rent to Value Ratio
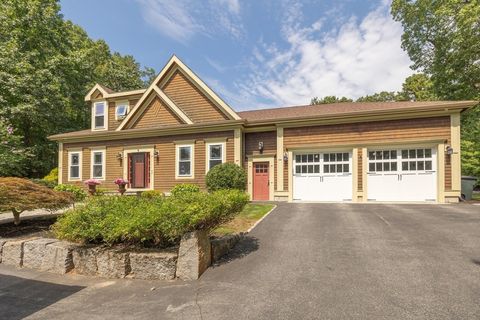
Active
$562,000
6
bds
|
4
ba
|
3,106
sqft
|
built
1959
3751 NW 8th Pl, Lauderhill, FL 33311
$-1,571
Cash flow
-14.6%
Cash-on-Cash Return
2.8%
Cap rate
0.7%
Rent to Value Ratio
Active
$489,000
2
bds
|
2
ba
|
1,043
sqft
|
built
1989
6245 Engram Rd, New Smyrna Beach, FL 32169
$-1,084
Cash flow
-11.6%
Cash-on-Cash Return
3.5%
Cap rate
0.6%
Rent to Value Ratio
Active
$265,000
4
bds
|
3
ba
|
2,050
sqft
|
built
1971
11 Walnut Valley Dr, Little Rock, AR 72211
$-259
Cash flow
-5.1%
Cash-on-Cash Return
4.5%
Cap rate
0.7%
Rent to Value Ratio
Active
$1,175,000
3
bds
|
2
ba
|
1,475
sqft
|
built
1952
75 George St, Roslyn Heights, NY 11577
$-3,854
Cash flow
-17.1%
Cash-on-Cash Return
2.1%
Cap rate
0.4%
Rent to Value Ratio

Active
$435,000
3
bds
|
3
ba
|
1,651
sqft
|
built
2000
21528 Walnut St, Garfield, AR 72732
$-1,079
Cash flow
-12.9%
Cash-on-Cash Return
2.7%
Cap rate
0.4%
Rent to Value Ratio
Active
$774,900
4
bds
|
4
ba
|
3,716
sqft
|
built
2016
10515 E Sheffield Dr, Mesa, AZ 85212
$-1,922
Cash flow
-12.9%
Cash-on-Cash Return
2.7%
Cap rate
0.4%
Rent to Value Ratio
Active
$845,000
4
bds
|
5
ba
|
3,800
sqft
|
built
2006
860 W 8100 S, Willard, UT 84340
$-2,774
Cash flow
-17.1%
Cash-on-Cash Return
1.7%
Cap rate
0.3%
Rent to Value Ratio

Active
$2,499,900
5
bds
|
4
ba
|
5,005
sqft
|
built
1965
124 Evergreen St, Duxbury, MA 02332
$-8,460
Cash flow
-17.7%
Cash-on-Cash Return
1.6%
Cap rate
0.3%
Rent to Value Ratio
Active
$525,000
3
bds
|
2
ba
|
1,754
sqft
|
built
1973
9516 Merrimoor Blvd, Seminole, FL 33777
$-939
Cash flow
-9.3%
Cash-on-Cash Return
4.0%
Cap rate
0.5%
Rent to Value Ratio