United States Investment Properties for Sale
Browse homes for sale and investment properties in United States. Refine your search by price, property type, or more.
Best cash flowing properties in United States
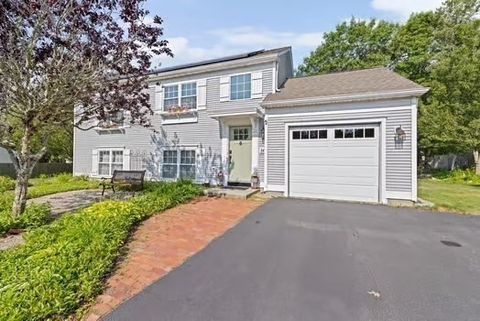
Active
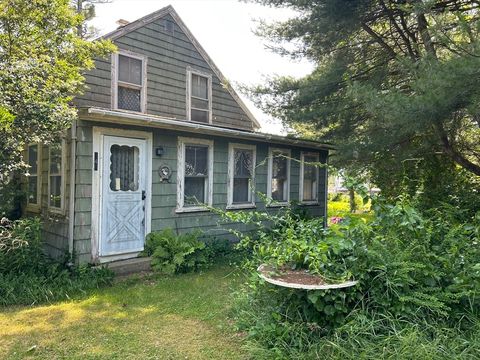
$169,990
2
bds
|
1
ba
|
1,046
sqft
|
built
1940
148 Lakeview Ave, Taunton, MA 02780
$670
Cash flow
20.6%
Cash-on-Cash Return
10.4%
Cap rate
1.5%
Rent to Value Ratio
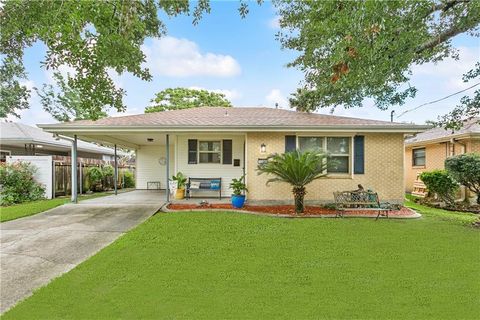
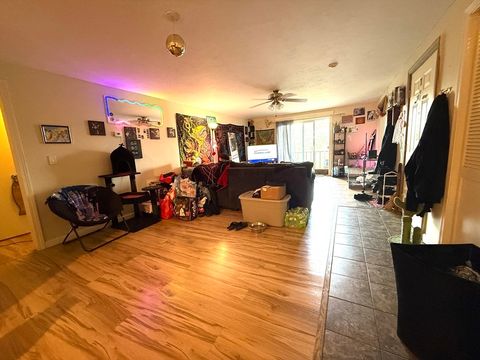
Active
$219,000
3
bds
|
1
ba
|
1,117
sqft
|
built
1970
3732 Arizona Ave, Kenner, LA 70065
$206
Cash flow
4.9%
Cash-on-Cash Return
6.8%
Cap rate
0.8%
Rent to Value Ratio
10,000 out of 432,530 properties for sale in United States
Limited Results Shown
Create a free account, or log in to reveal all property listings and enjoy the complete experience.
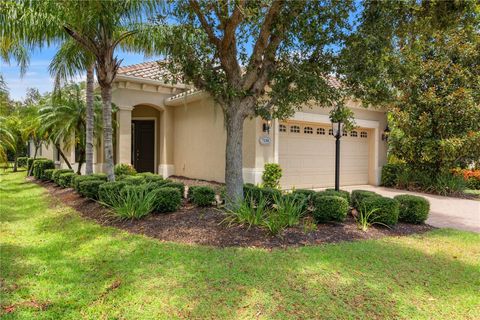
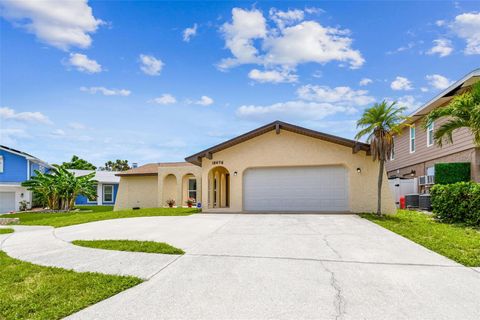
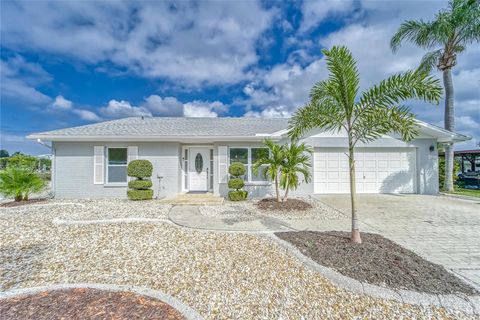
Active
$479,000
2
bds
|
2
ba
|
1,977
sqft
|
built
2014
7130 Westhill Ct, Lakewood Ranch, FL 34202
$-1,034
Cash flow
-11.3%
Cash-on-Cash Return
3.7%
Cap rate
0.7%
Rent to Value Ratio
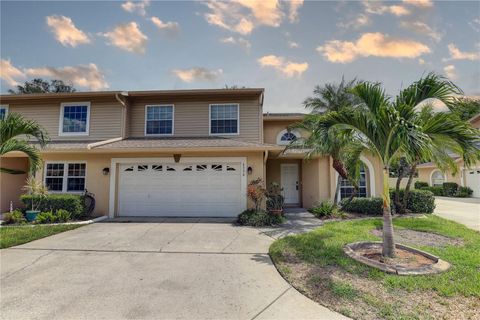
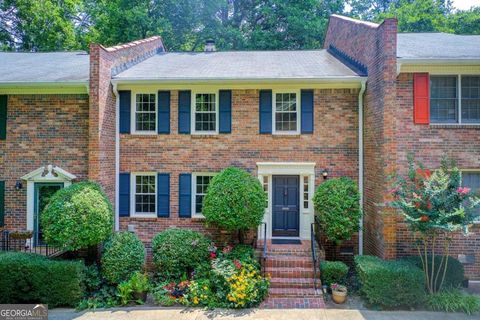
Active
$375,000
3
bds
|
3
ba
|
1,817
sqft
|
built
1995
8990 Antigua Dr, Seminole, FL 33777
$-361
Cash flow
-5.0%
Cash-on-Cash Return
5.1%
Cap rate
0.7%
Rent to Value Ratio
Active
$575,000
3
bds
|
2
ba
|
1,622
sqft
|
built
1979
12476 81st Ct, Seminole, FL 33772
$-1,231
Cash flow
-11.2%
Cash-on-Cash Return
3.7%
Cap rate
0.5%
Rent to Value Ratio
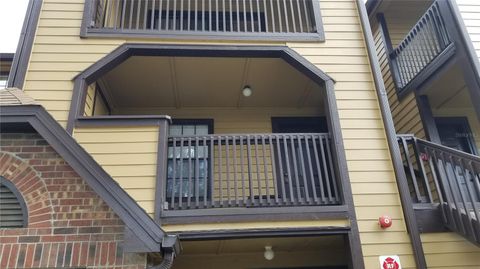
Active
$139,000
1
bds
|
1
ba
|
712
sqft
|
built
1986
420 Forestway Cir, Altamonte Springs, FL 32701
$17
Cash flow
0.6%
Cash-on-Cash Return
6.4%
Cap rate
0.9%
Rent to Value Ratio
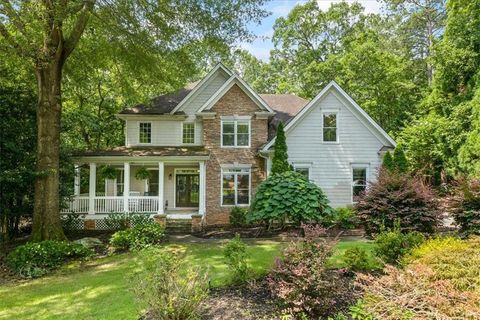
Active
$815,000
6
bds
|
5
ba
|
0
sqft
|
built
1998
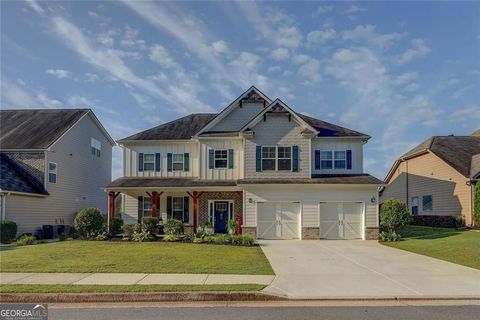
1788 River Bluff Vw, Duluth, GA 30097
$-2,375
Cash flow
-15.2%
Cash-on-Cash Return
2.8%
Cap rate
0.5%
Rent to Value Ratio
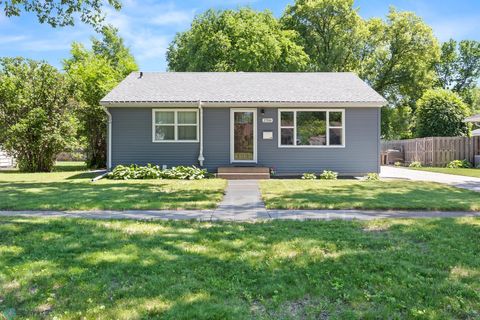
Active
$285,000
4
bds
|
2
ba
|
1,844
sqft
|
built
1955
1706 14 1/2 St S, Fargo, ND 58103
$-253
Cash flow
-4.6%
Cash-on-Cash Return
5.2%
Cap rate
0.8%
Rent to Value Ratio
Active
$199,900
2
bds
|
1
ba
|
800
sqft
|
built
1930
1322 N Prairie Ave, Joliet, IL 60435
$-369
Cash flow
-9.6%
Cash-on-Cash Return
4.1%
Cap rate
0.8%
Rent to Value Ratio
Active
$289,000
3
bds
|
2
ba
|
0
sqft
|
built
2024
1108 Blackjack Creek Dr, Yukon, OK 73099
$-7
Cash flow
-0.1%
Cash-on-Cash Return
5.7%
Cap rate
0.7%
Rent to Value Ratio
Active
$415,000
4
bds
|
3
ba
|
2,455
sqft
|
built
2003
1521 Atami Ct, Zephyrhills, FL 33544
$-693
Cash flow
-8.7%
Cash-on-Cash Return
4.3%
Cap rate
0.6%
Rent to Value Ratio
Active
$135,000
3
bds
|
2
ba
|
1,168
sqft
|
built
1930
404 North Ave NE, Rome, GA 30161
$168
Cash flow
6.5%
Cash-on-Cash Return
7.8%
Cap rate
1.0%
Rent to Value Ratio
Active
$489,000
2
bds
|
2
ba
|
1,396
sqft
|
built
1962
41 NE 47th Ct, Oakland Park, FL 33334
$-1,167
Cash flow
-12.5%
Cash-on-Cash Return
3.4%
Cap rate
0.6%
Rent to Value Ratio
Active
$345,000
3
bds
|
1
ba
|
680
sqft
|
built
1958
1721 NW 152nd St, Miami Gardens, FL 33054
$-777
Cash flow
-11.8%
Cash-on-Cash Return
3.6%
Cap rate
0.6%
Rent to Value Ratio

Active
$280,000
4
bds
|
0
ba
|
2,324
sqft
|
built
2006
308 Sarasota Ln, Locust Grove, GA 30248
$-479
Cash flow
-8.9%
Cash-on-Cash Return
4.2%
Cap rate
0.7%
Rent to Value Ratio
Active
$300,000
3
bds
|
2
ba
|
1,536
sqft
|
built
1969
479 Tara Ln, Orange Park, FL 32073
$-175
Cash flow
-3.0%
Cash-on-Cash Return
5.6%
Cap rate
0.7%
Rent to Value Ratio
Active
$300,000
4
bds
|
3
ba
|
1,805
sqft
|
built
2010
15420 Quail Woods Pl, Ruskin, FL 33573
$-559
Cash flow
-9.7%
Cash-on-Cash Return
4.0%
Cap rate
0.7%
Rent to Value Ratio
Active
$685,000
3
bds
|
2
ba
|
2,071
sqft
|
built
1981
805 Leisey Cir, Ruskin, FL 33570
$-1,907
Cash flow
-14.5%
Cash-on-Cash Return
2.9%
Cap rate
0.5%
Rent to Value Ratio
Active
$589,900
3
bds
|
2
ba
|
1,428
sqft
|
built
2000
544 Lunns Way, Plymouth, MA 02360
$-1,404
Cash flow
-12.4%
Cash-on-Cash Return
3.4%
Cap rate
0.5%
Rent to Value Ratio
Active
$239,000
2
bds
|
1
ba
|
1,064
sqft
|
built
1988
199 Perry Ave, Worcester, MA 01610
$-376
Cash flow
-8.2%
Cash-on-Cash Return
4.4%
Cap rate
0.8%
Rent to Value Ratio
Active
$529,000
4
bds
|
0
ba
|
2,005
sqft
|
built
1978
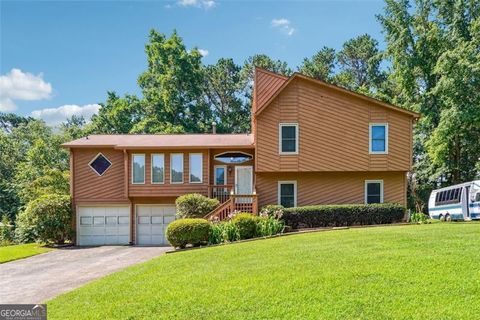
1105 Clairemont Ave, Decatur, GA 30030
$-1,837
Cash flow
-18.1%
Cash-on-Cash Return
2.0%
Cap rate
0.5%
Rent to Value Ratio
Active
$544,900
5
bds
|
0
ba
|
2,937
sqft
|
built
2017
110 Ashbury Cir, Dallas, GA 30157
$-1,433
Cash flow
-13.7%
Cash-on-Cash Return
3.0%
Cap rate
0.5%
Rent to Value Ratio
Active
$399,000
3
bds
|
0
ba
|
2,224
sqft
|
built
1984
1159 Midland Dr NW, Acworth, GA 30102
$-624
Cash flow
-8.2%
Cash-on-Cash Return
4.4%
Cap rate
0.6%
Rent to Value Ratio
Active
$359,000
4
bds
|
0
ba
|
2,986
sqft
|
built
2006
136 Lakeshore Pkwy, Newnan, GA 30263
$-463
Cash flow
-6.7%
Cash-on-Cash Return
4.7%
Cap rate
0.7%
Rent to Value Ratio
Active
$250,000
1
bds
|
1
ba
|
806
sqft
|
built
1969
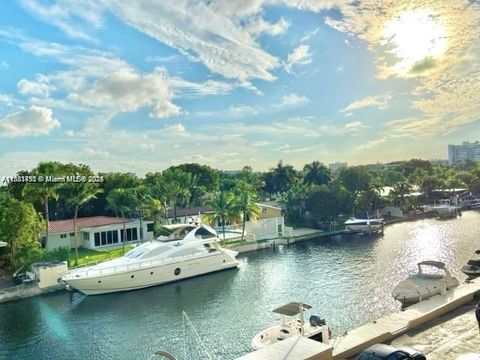
2020 NE 135th St, North Miami, FL 33181
$-918
Cash flow
-19.2%
Cash-on-Cash Return
1.9%
Cap rate
0.8%
Rent to Value Ratio
Active
$399,900
3
bds
|
4
ba
|
2,464
sqft
|
built
2014
3815 Canyon Heights Rd, Belton, TX 76513
$-669
Cash flow
-8.7%
Cash-on-Cash Return
4.3%
Cap rate
0.7%
Rent to Value Ratio
Active
$385,000
3
bds
|
2
ba
|
0
sqft
|
built
1972
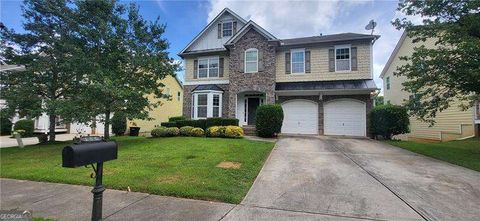
824 Hickory Ridge Rd SW, Lilburn, GA 30047
$-740
Cash flow
-10.0%
Cash-on-Cash Return
4.0%
Cap rate
0.6%
Rent to Value Ratio
Active
$229,000
3
bds
|
2
ba
|
1,826
sqft
|
built
1979
827 E Nopal St, Uvalde, TX 78801
$-377
Cash flow
-8.6%
Cash-on-Cash Return
4.3%
Cap rate
0.7%
Rent to Value Ratio
Active
$215,000
4
bds
|
2
ba
|
0
sqft
|
built
1987
12513 Canterbury Dr W, Ocean Springs, MS 39564
$71
Cash flow
1.7%
Cash-on-Cash Return
6.1%
Cap rate
0.8%
Rent to Value Ratio
Active
$425,000
3
bds
|
3
ba
|
3,127
sqft
|
built
2004
1735 Savannah Ln, Ypsilanti, MI 48198
$-863
Cash flow
-10.6%
Cash-on-Cash Return
3.7%
Cap rate
0.7%
Rent to Value Ratio
Active
$175,000
1
bds
|
1
ba
|
873
sqft
|
built
1973
1321 S Finley Rd, Lombard, IL 60148
$-306
Cash flow
-9.1%
Cash-on-Cash Return
3.6%
Cap rate
0.9%
Rent to Value Ratio

Active
$249,900
2
bds
|
2
ba
|
1,000
sqft
|
built
1972
805 W Oakland Park Blvd, Wilton Manors, FL 33311
$-773
Cash flow
-16.1%
Cash-on-Cash Return
2.6%
Cap rate
0.9%
Rent to Value Ratio
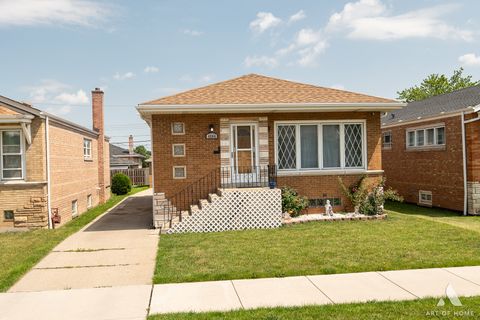
Active
$329,000
4
bds
|
2
ba
|
1,800
sqft
|
built
1923
2620 E 91st St, Chicago, IL 60617
$-532
Cash flow
-8.4%
Cash-on-Cash Return
4.3%
Cap rate
0.6%
Rent to Value Ratio
Active
$314,900
1
bds
|
1
ba
|
804
sqft
|
built
1971
1636 N Wells St, Chicago, IL 60614
$-1,131
Cash flow
-18.7%
Cash-on-Cash Return
2.0%
Cap rate
0.8%
Rent to Value Ratio
Active
$359,900
3
bds
|
2
ba
|
1,170
sqft
|
built
1958
4504 W 65th Pl, Chicago, IL 60629
$-427
Cash flow
-6.2%
Cash-on-Cash Return
4.8%
Cap rate
0.7%
Rent to Value Ratio
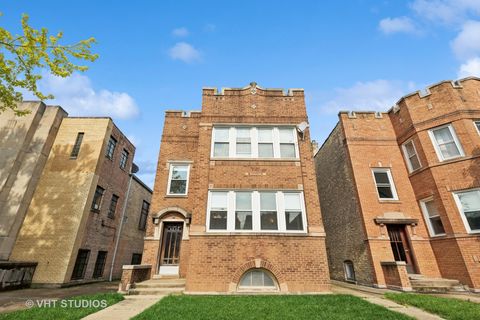
Active
$650,000
7
bds
|
3
ba
|
0
sqft
|
built
1919
6208 N Artesian Ave, Chicago, IL 60659
$-2,235
Cash flow
-17.9%
Cash-on-Cash Return
2.1%
Cap rate
0.4%
Rent to Value Ratio
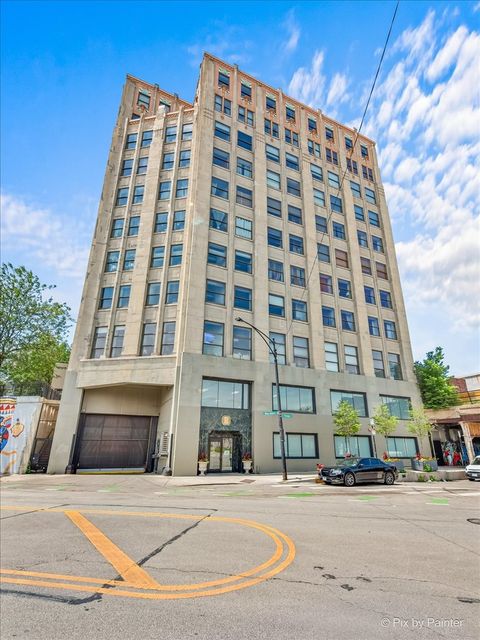
Active
$269,900
2
bds
|
2
ba
|
0
sqft
|
built
1927
1550 S Blue Island Ave, Chicago, IL 60608
$-923
Cash flow
-17.8%
Cash-on-Cash Return
2.2%
Cap rate
0.8%
Rent to Value Ratio
Active
$199,900
2
bds
|
2
ba
|
1,350
sqft
|
built
2005
6938 S Dorchester Ave, Chicago, IL 60637
$167
Cash flow
4.4%
Cash-on-Cash Return
7.3%
Cap rate
1.0%
Rent to Value Ratio
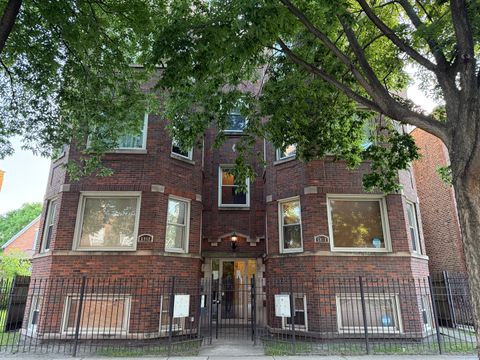
Active
$349,900
2
bds
|
2
ba
|
980
sqft
|
built
1920
1070 W 15th St, Chicago, IL 60608
$-1,053
Cash flow
-15.7%
Cash-on-Cash Return
2.7%
Cap rate
0.7%
Rent to Value Ratio
Active
$293,999
3
bds
|
2
ba
|
1,662
sqft
|
built
2022
13032 Minuet Sway, San Antonio, TX 78252
$-710
Cash flow
-12.6%
Cash-on-Cash Return
3.4%
Cap rate
0.7%
Rent to Value Ratio