
$18,800,000
Investment Summary
- Monthly Cash Flow
- -$87,422
- Cap Rate
- 0.1%
- Cash-on-Cash Return
- -24.3%
- Debt Coverage Ratio
- 0.02
- Internal Rate of Return (5 years)
- -19.4%
Cash Flow
Net Operating Income (NOI) minus mortgage payments.
Calculation:
NOI - Mortgage Payments
Cap Rate (Market Value)
Capitalization Rate is a rate of return that compares the yearly Net Operating Income (NOI) to the market value.
Calculation:
NOI / Market Value
Cash-on-Cash Return (CoC)
Annual Cash Flow / Cash Invested
Calculation:
Annual cash flow divided by initial cash invested.
Debt Coverage Ratio (DCR)
Net Operating Income (NOI) divided by total debt payments.
Calculation:
NOI / Total Debt Payments
Internal Rate of Return (IRR)
A metric for assessing profitability over time. IRR is the discount rate at which the net present value (NPV) of all future cash flows (positive and negative) from an investment equals zero — including both periodic cash flow (such as rent) and a projected sale at the end of the holding period. It represents the expected annualized return, accounting for income, expenses, and the recovery of capital through a future sale.
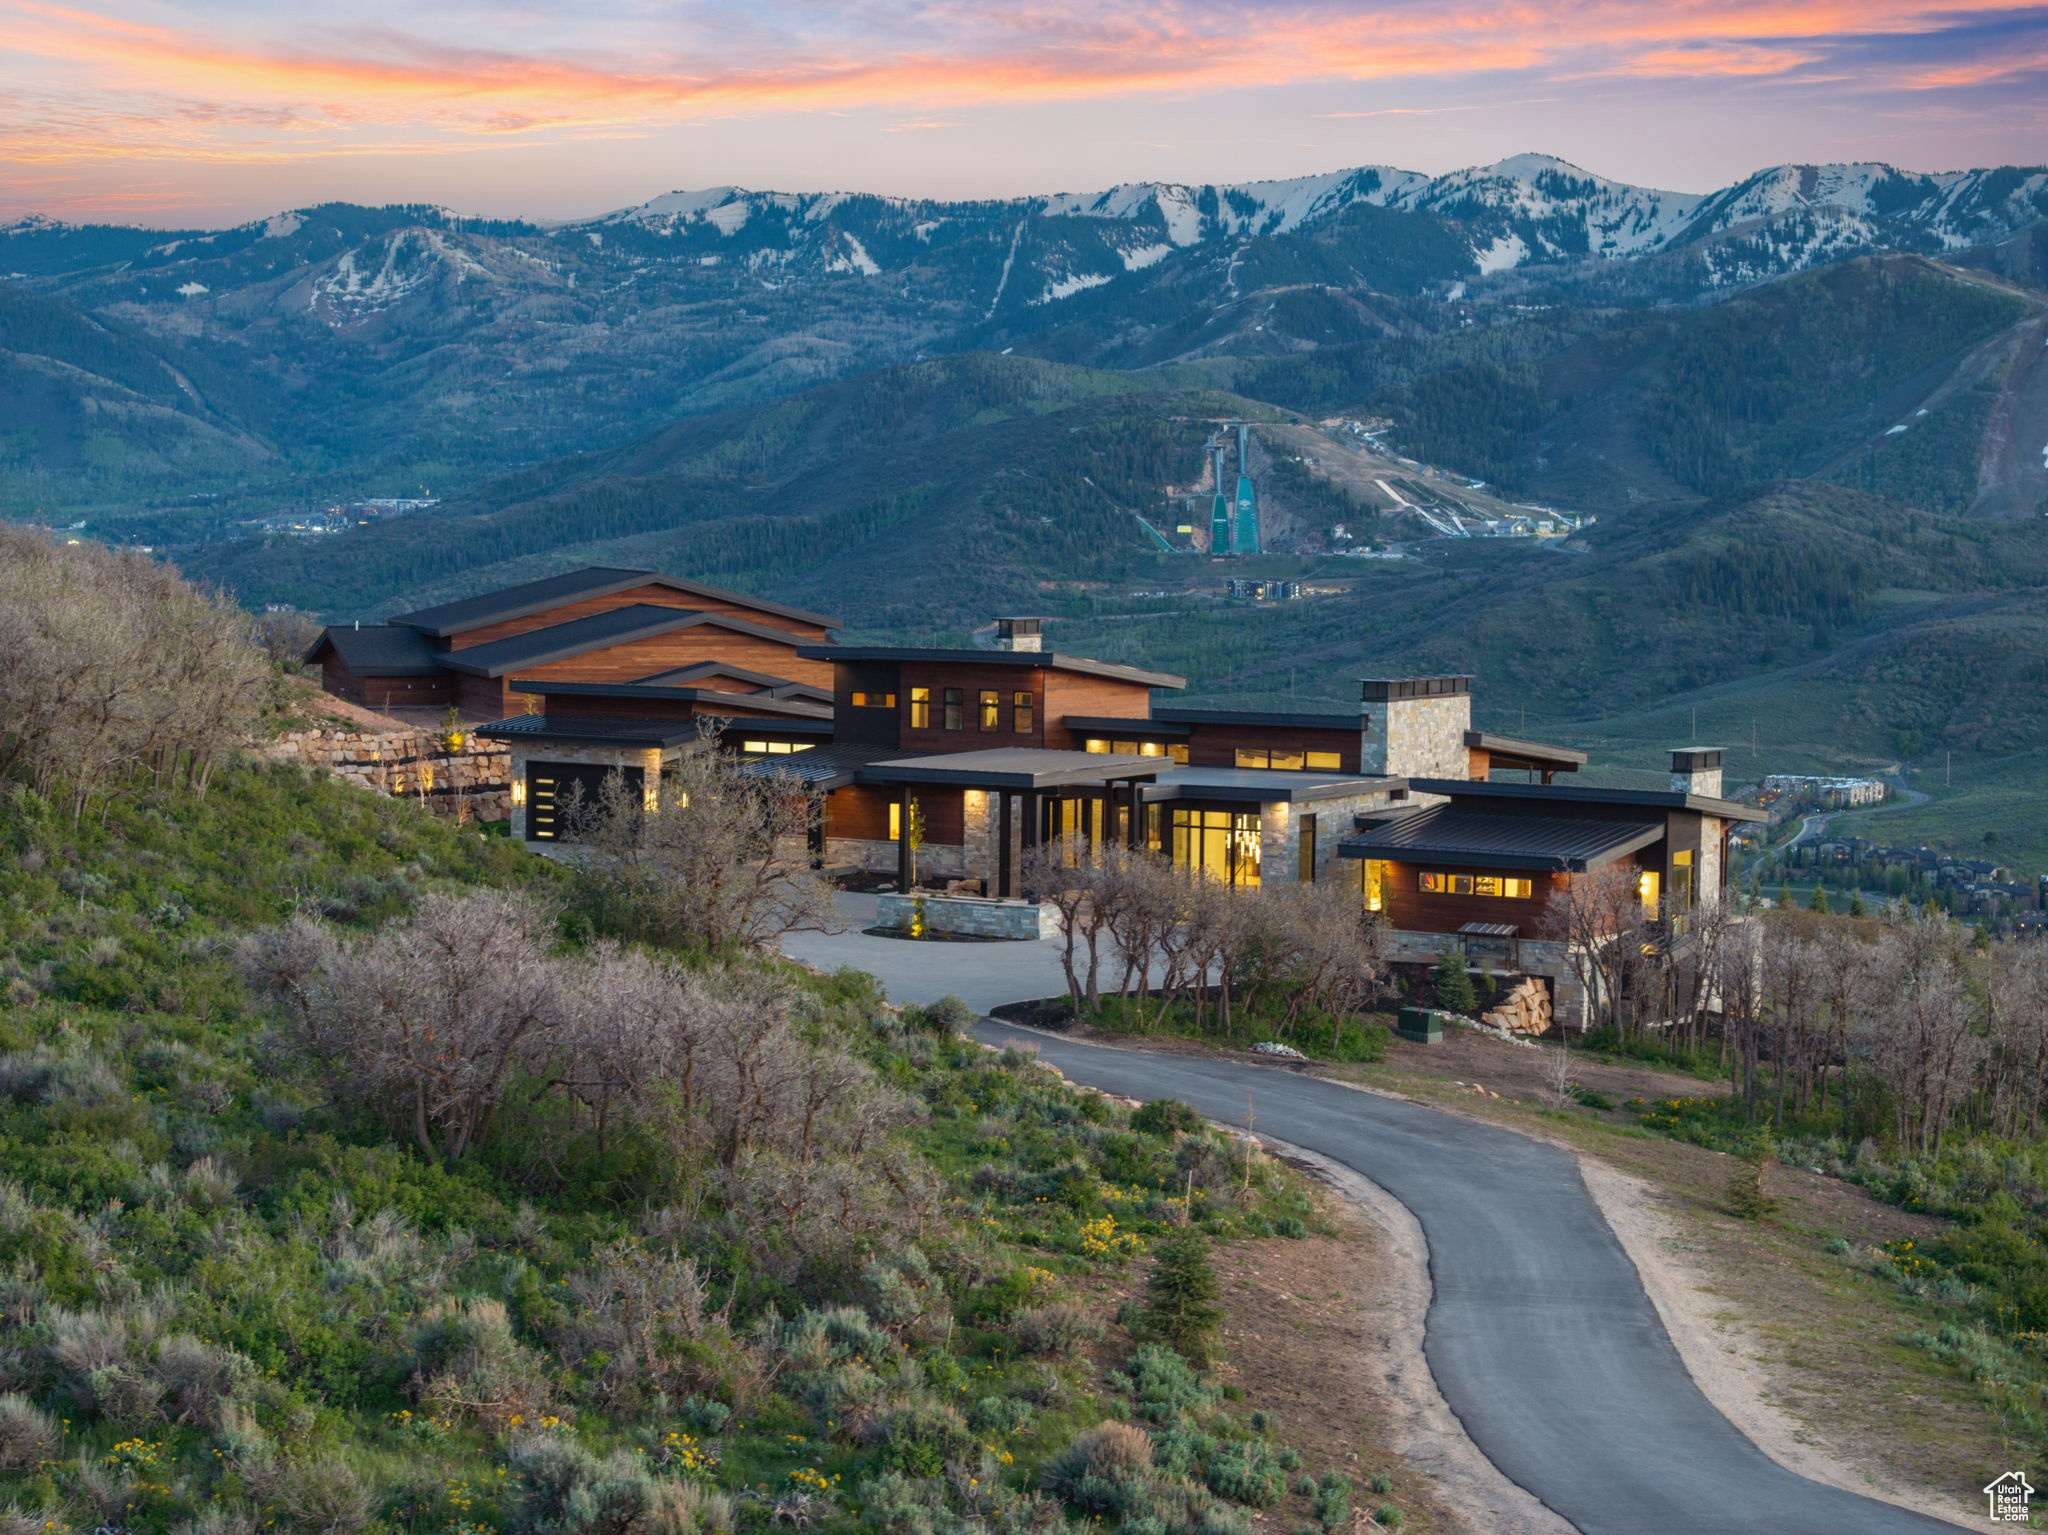
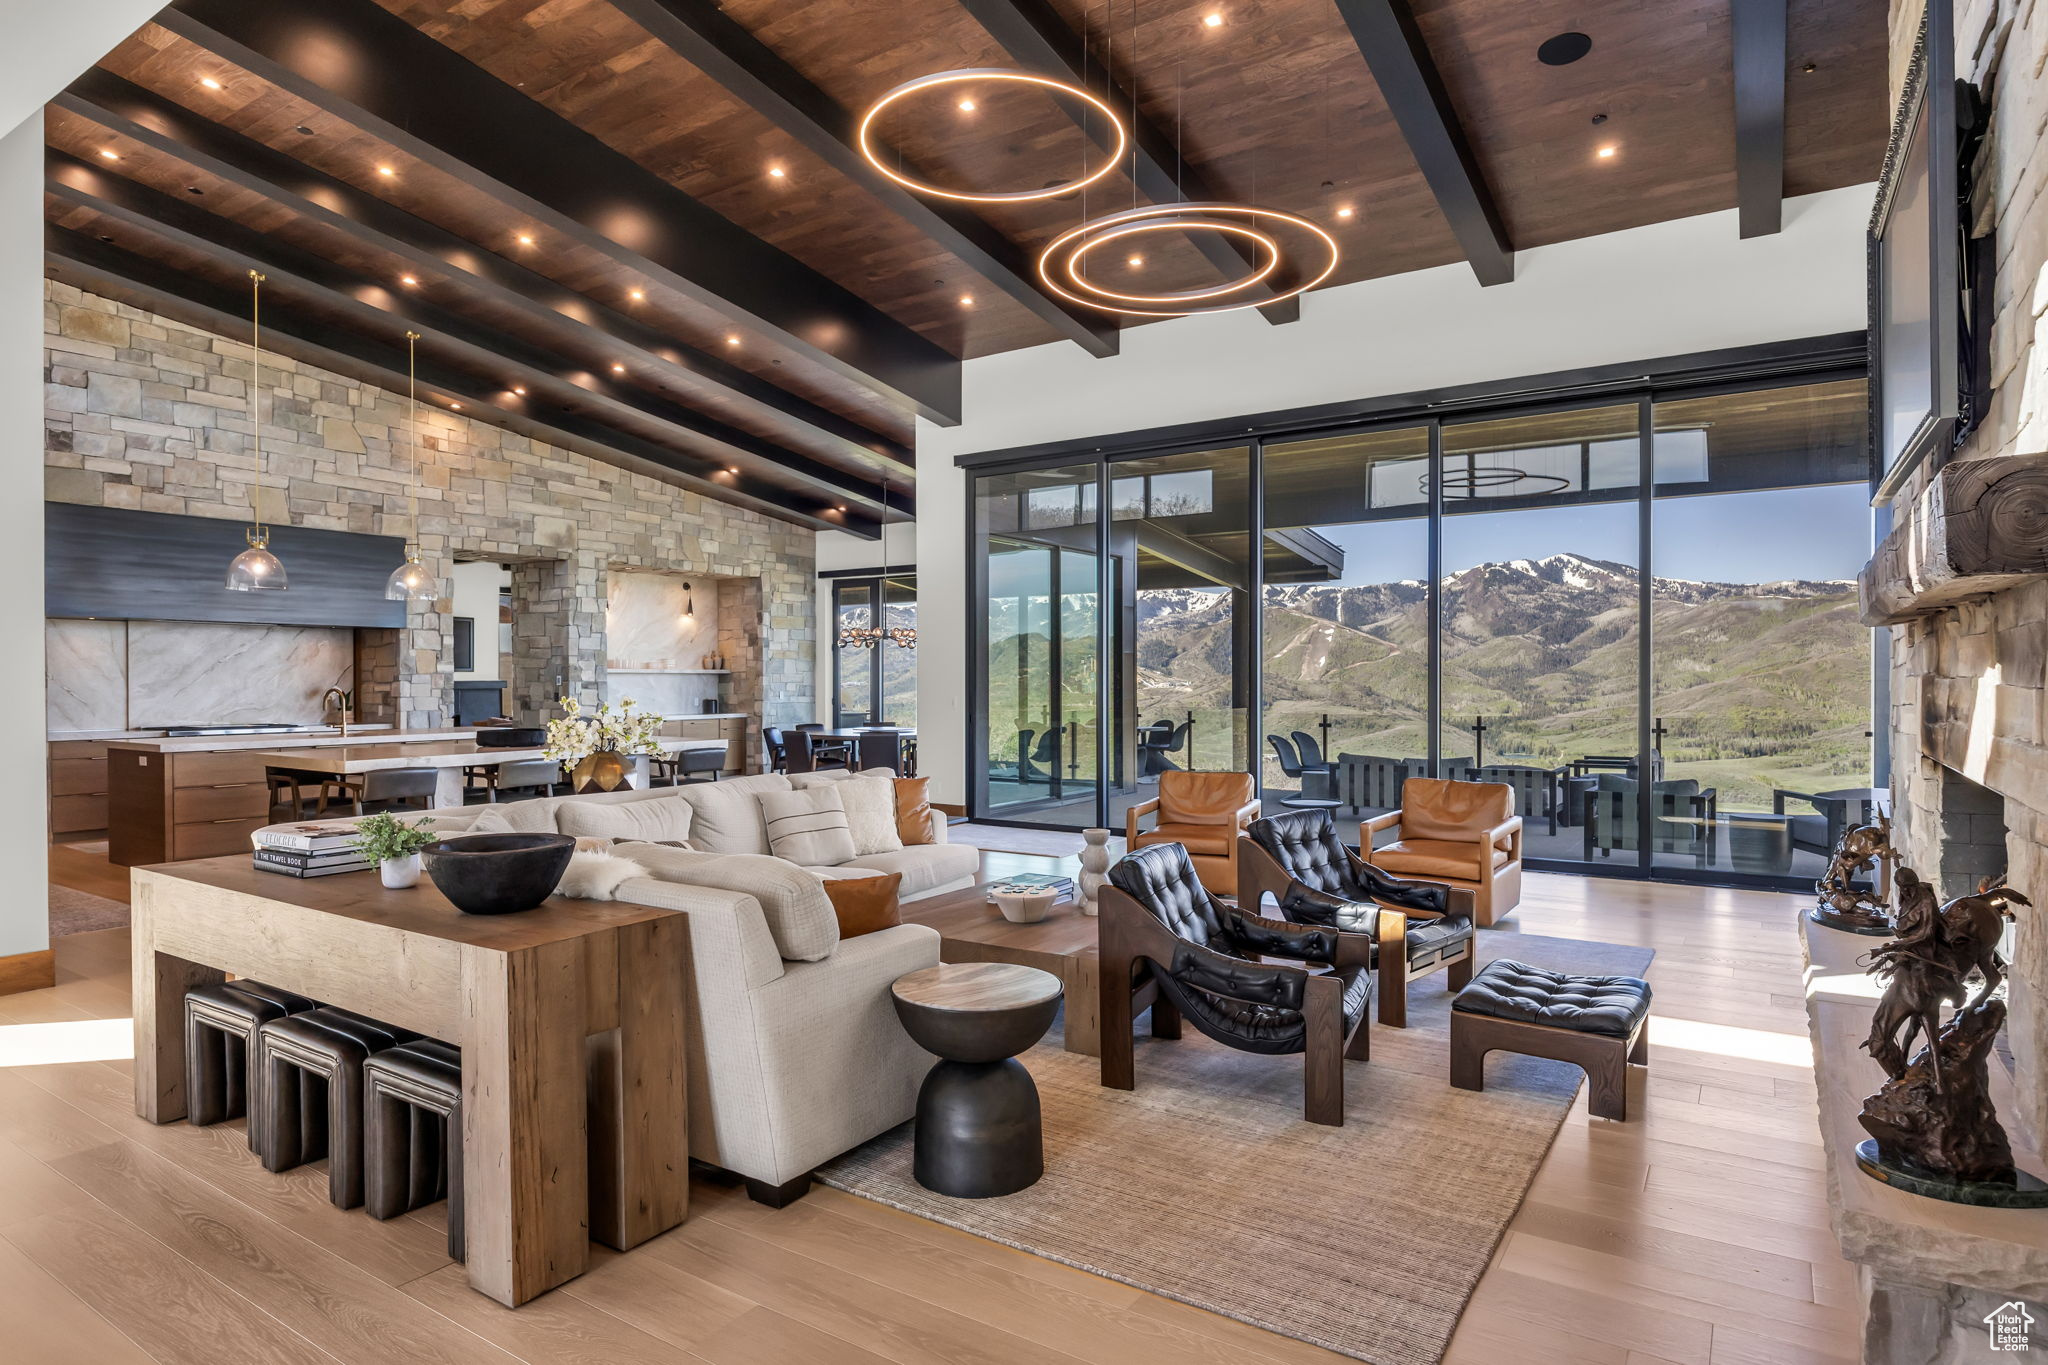
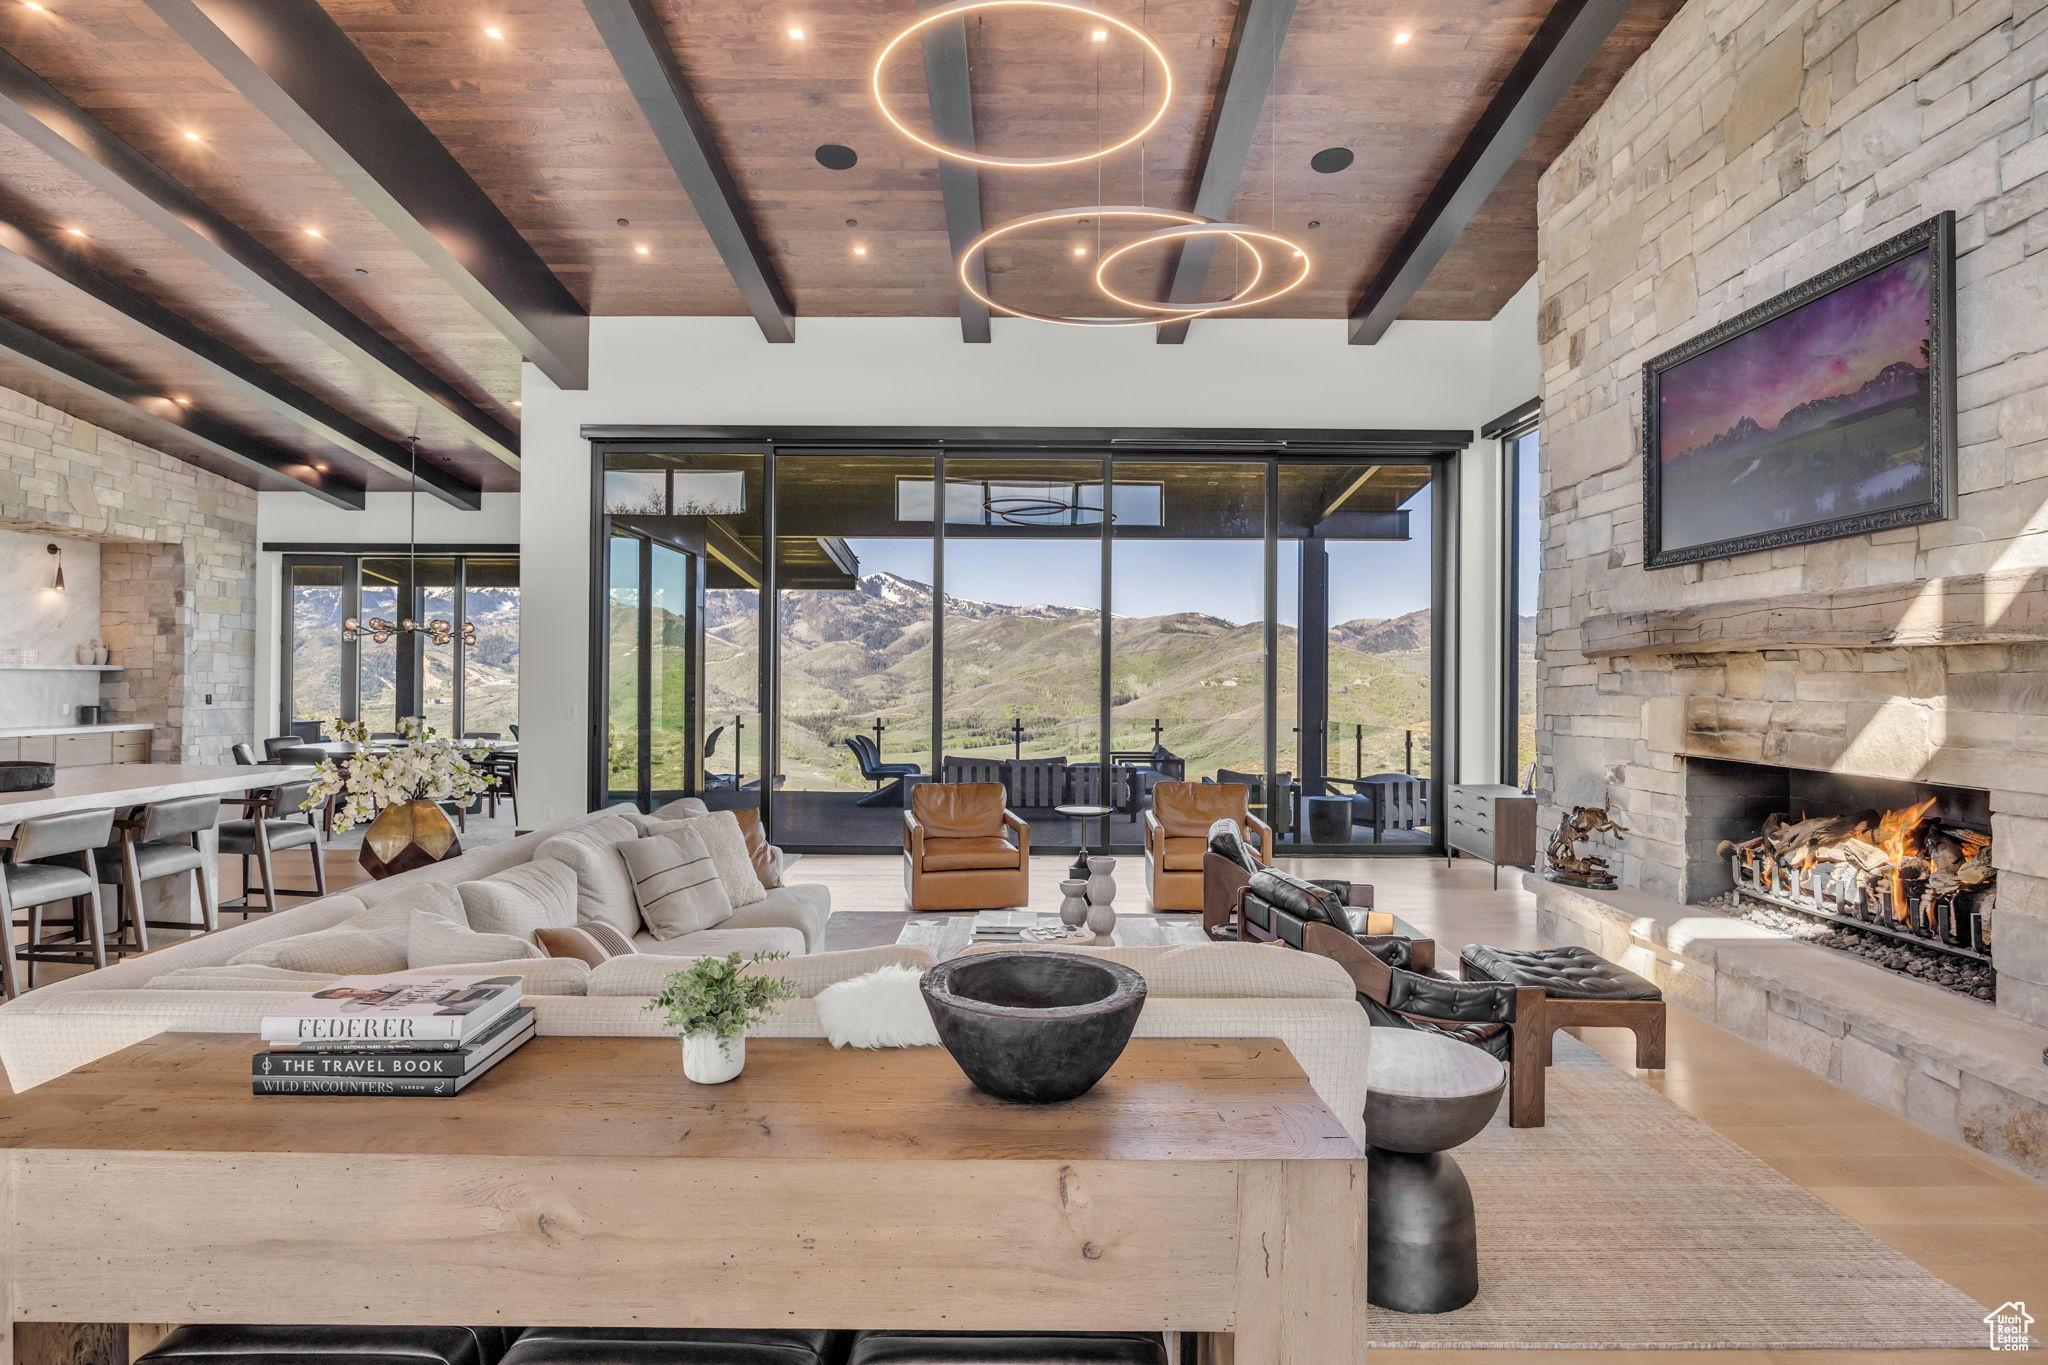
Property Description
Perched on 24.68 acres in the gated Ranches at the Preserve-one of Park City's most private and expansive neighborhoods-this newly built estate, including a separate structure with indoor tennis court, is a rare combination of seclusion, sophistication, and proximity to everything Park City has to offer. Surrounded by untouched nature, yet only 10 minutes to Kimball Junction and just 25 minutes to Historic Main Street, this legacy property offers the best of both privacy and convenience. Crafted for luxurious main-level living, the 10,954-square-foot residence showcases striking architectural design and refined craftsmanship throughout, from custom cabinetry and woodwork to curated designer lighting and finishes. An expansive great room with vaulted ceilings and a wall of glass that opens at the push of a button invites the outdoors in, framing panoramic views of the Wasatch Mountains and ski resorts. Multiple outdoor living spaces provide unforgettable backdrops for entertaining or relaxation. At the heart of the home is a stunning chef's kitchen, designed with both form and function in mind. Two oversized islands provide ample space for cooking and gathering, while a fully equipped butler's pantry ensures seamless entertaining and storage. The primary suite is a private sanctuary with spa-caliber amenities, generous closet space, and private terrace access. For focus and productivity, enjoy a private executive office and a fully equipped conference room, also ideal as a second office, both enhanced by expansive mountain views and situated in a private wing inside the house. Additional features include a dedicated exercise room, multiple gathering spaces, and a custom bunk room with eight built-in beds, creating a luxurious yet practical retreat for guests or family. The showpiece of the property is the 8,907-square-foot indoor sports facility, designed to meet USTA specifications for tennis, with the versatility to accommodate a basketball court or four pickleball courts. Beyond sport, this one-of-a-kind space offers endless possibilities: transform it into a world-class car gallery, private event venue, music and film studio, or a health and wellness retreat with room for a full gym, lap pool, and golf simulator. For outdoor enthusiasts, take advantage of direct access to the Glenwild trail system from your backyard for miles of hiking, biking, and year-round outdoor adventure. For equestrian lovers, there is a large fully irrigated pasture, and the foundation for a stable has already been poured and plans approved by the HOA and county. Wildlife roam freely around the estate, enhancing its sense of escape, while everyday conveniences remain close at hand. Skiers will appreciate being within 20 minutes of Park City Mountain, Deer Valley, and only 10 minutes from Woodward resorts. 5 minutes from the private Glenwild Golf Club-Park City's premier country club offering world-class golf, dining, and amenities-and only 30 minutes from Salt Lake City International Airport and the vibrant downtown Salt Lake City.
Build Your Team
Quickly find investor-friendly professionals who can help you succeed in real estate investing at any stage of the investing journey.


Agents
Match with investor-friendly agents who can help you find, analyze, and close your next deal


Lenders
Get the best funding…find investor-friendly lenders who specialize in your deal strategy


Property Managers
Transition to passive investing. Find a trusted property management partnership that lasts.


Tax Pros & Accountants
Taxes and financial reporting made easy—find experts to create tax savings strategies, file taxes, and more
Location
Property Details
Parking
- Details: RV Access/Parking
- Garage Spaces: 6
- Spaces Total: 6
Bedroom Information
- # of Bedrooms: 6
Bathroom Information
- # of Baths (Full): 1
- # of Baths (Partial): 3
- # of Baths (Total): 9.0
Interior Features
- # of Rooms: 33
- # of Stories: 3
- Basement: Yes
- Basement Description: Daylight, Full, Walk-Out Access
- Fireplace: Yes
Exterior Features
- Roof Material: Metal
HOA
- Has HOA: Yes
- HOA Fee: $7,050/annually
Land Information
- Land Use: Residential
- Land Use Subtype: Single Family Residential
Lot Information
- Parcel ID: RRH16
- Lot Size: 1075060 sqft
Property Information
- Property Type: Single Family Residence
- Year Built: 2024
Tax Information
- Annual Tax: $15,809
Utilities
- Heating: Fireplace Insert, Forced Air, Radiant Floor, Radiant
- Cooling: Ceiling Fan(s), Central Air
Location
- County: Summit
Listing Details
Investment Summary
- Monthly Cash Flow
- -$87,422
- Cap Rate
- 0.1%
- Cash-on-Cash Return
- -24.3%
- Debt Coverage Ratio
- 0.02
- Internal Rate of Return (5 years)
- -19.4%
Cash Flow
Net Operating Income (NOI) minus mortgage payments.
Calculation:
NOI - Mortgage Payments
Cap Rate (Market Value)
Capitalization Rate is a rate of return that compares the yearly Net Operating Income (NOI) to the market value.
Calculation:
NOI / Market Value
Cash-on-Cash Return (CoC)
Annual Cash Flow / Cash Invested
Calculation:
Annual cash flow divided by initial cash invested.
Debt Coverage Ratio (DCR)
Net Operating Income (NOI) divided by total debt payments.
Calculation:
NOI / Total Debt Payments
Internal Rate of Return (IRR)
A metric for assessing profitability over time. IRR is the discount rate at which the net present value (NPV) of all future cash flows (positive and negative) from an investment equals zero — including both periodic cash flow (such as rent) and a projected sale at the end of the holding period. It represents the expected annualized return, accounting for income, expenses, and the recovery of capital through a future sale.
Purchase Details
Purchase PriceThe price paid for the property. Purchase price:
| $18,800,000 |
|---|---|
Amount FinancedThe amount of the purchase financed through a loan. Amount financed:
| -$15,040,000 |
Down paymentThe initial payment made towards the purchase. Down payment:
| $3,760,000 |
Closing CostsFees and expenses associated with purchasing a property, typically ranging from 2% to 5% of the home’s purchase price, paid at the end of a home purchase to cover services like lending, title transfer, and taxes. Closing costs:
| $564,000 |
Rehab CostsCosts incurred to repair or improve the property, including: roof, flooring, exterior siding, kitchen, exterior paint, bathrooms, etc. Rehab costs:
| $0 |
Initial Cash InvestedThe total initial cash invested in the property. Calculation:Down payment + Buying costs + Rehab costs Initial cash invested:
| $4,324,000 |
Square Feet (SQFT)The total square footage of the property. Square feet:
| 10,954 |
Cost Per Square FootCost per square foot of the property. Calculation:Purchase Price / Square Feet Cost per square foot:
| $1,716 |
Monthly Rent Per Square FootMonthly rent divided by the number of square feet. This ratio helps investors compare rental income efficiency across properties, markets, and unit sizes Calculation:Monthly Rent / Square Feet Monthly rent per square foot:
| $0.46 |
Financing Details
Loan AmountThe total sum of money borrowed from a lender to finance a property purchase. Calculation:Purchase Price - Down Payment
Loan amount:
| $15,040,000 |
|---|---|
Loan to Value Ratio (LTV)Loan amount divided by the market value of the property. Calculation:Loan Amount / Market Value
Loan to value ratio:
| 80.0% |
Loan TypeThe type of loan (e.g., fixed, adjustable).
Loan type:
| Amortizing |
TermThe loan repayment period in years.
Term:
| 30 years |
Interest RateThe percentage a lender charges on the borrowed amount of a loan, determining the cost of borrowing money.
Interest rate:
| 5.875% |
Principal & Interest (PI)The principal is the portion of the loan payment that reduces the loan balance. The interest is the lender's charge for borrowing money. Calculation:(P * r * (1 + r) ** n) / ((1 + r) ** n - 1) Where:
P = Loan amount (principal)
Principal & interest:
| $88,967 |
Property TaxesAnnual taxes levied by local governments on real estate properties. These taxes fund public services like schools, roads, and emergency services.
Property tax:
| $1,317 |
InsuranceThe costs for insurance coverage to protect against financial losses due to risks like fire, natural disasters, theft, liability, or tenant-related damages. Calculation:Assumes 7% of gross rental income, unless insurance rates are specified.
Insurance:
| $350 |
Private Mortgage Insurance (PMI)A fee that borrowers pay when they take out a conventional loan with a loan-to-value (LTV) ratio above 80%.
Private mortgage insurance (PMI):
| $0 |
Monthly PaymentThe fixed amount a borrower pays each month to repay a loan. It typically includes principal and interest (P&I) and may also cover property taxes, insurance, HOA fees, and PMI if escrowed. Monthly payment:
| $90,634 |
Operating Income
| % Rent | Monthly | Yearly | |
|---|---|---|---|
Gross RentThe total rental income received from tenants before deducting any expenses. Includes base rent, late fees, pet fees, parking fees, and other recurring charges.
Gross rent:
| $5,000 | $60,000 | |
Vacancy LossExpected loss of rent due to vacancies.
Vacancy loss:
(6%)
| 6% | -$300 | -$3,600 |
Operating IncomeGross rental income minus vacancy loss. Calculation:Gross rent - Vacancy loss
Operating income:
| $4,700 | $56,400 |
Operating Expenses
| % Rent | Monthly | Yearly | |
|---|---|---|---|
Property TaxesAnnual taxes levied by local governments on real estate properties. These taxes fund public services like schools, roads, and emergency services. | 26% | -$1,317 | -$15,809 |
InsuranceThe costs for insurance coverage to protect against financial losses due to risks like fire, natural disasters, theft, liability, or tenant-related damages. Calculation:Assumes 7% of gross rental income, unless insurance rates are specified. | 7% | -$350 | -$4,200 |
Property ManagementThe costs associated with hiring a property manager to handle the day-to-day operations of a rental property. Includes management fees, leasing fes, eviction fees, etc. Calculation:Assumes 8% of gross rental income. | 8% | -$400 | -$4,800 |
Repairs & MaintenanceOngoing costs for routine upkeep and minor fixes needed to keep a property in good working condition. Calculation:Assumes 5% of gross rental income. Varies by property age and condition. | 5% | -$250 | -$3,000 |
Capital ExpensesLarge, infrequent costs for major improvements or replacements, like a new roof, HVAC system, or appliances. Calculation:Assumes 5% of gross rental income. Varies by property age. | 5% | -$250 | -$3,000 |
HOA FeesRegular dues paid to a Homeowners Association for community maintenance, amenities, and management. Similar fees include: Condo Association Fees, Co-op Maintenance Fees, etc. | 12% | -$588 | -$7,056 |
Operating ExpensesRecurring costs required to maintain and manage a rental property, including property taxes, insurance, maintenance, repairs, utilities (if paid by the owner), property management fees, and other day-to-day expenses. Calculation:Insurance + Property Taxes + Property Management + Repairs & Maintenance + Capital Expenditures + HOA Fees | 63% | -$3,155 | -$37,865 |
Cash Flow
| Monthly | Yearly | |
|---|---|---|
Net Operating Income (NOI)The income generated from a property after deducting all operating expenses but before deducting mortgage payments, taxes, and capital expenditures. Calculation:Gross Operating Income - Operating Expenses
Net operating income:
| $1,545 | $18,540 |
Mortgage PaymentThe fixed amount a borrower pays each month to repay a loan. It typically includes principal and interest (P&I) and may also cover property taxes, insurance, HOA fees, and PMI if escrowed. | -$88,967 | -$1,067,604 |
Cash FlowNet Operating Income (NOI) minus mortgage payments. Calculation:NOI - Mortgage Payments | $87,422 | $1,049,064 |