Summit County Investment Properties for Sale
Browse homes for sale and investment properties in Summit County. Refine your search by price, property type, or more.
Best cash flowing properties in Summit County
Active
$399,900
1
bds
|
1
ba
|
670
sqft
|
built
1973
1900 Homestake Rd, Park City, UT 84060
$-911
Cash flow
-11.9%
Cash-on-Cash Return
2.9%
Cap rate
0.5%
Rent to Value Ratio
Active
$375,000
1
bds
|
1
ba
|
648
sqft
|
built
1983
7065 N 2200 W, Park City, UT 84098
$-1,142
Cash flow
-15.9%
Cash-on-Cash Return
2.0%
Cap rate
0.5%
Rent to Value Ratio
289 out of 613 properties for sale in Summit County
Limited Results Shown
Create a free account, or log in to reveal all property listings and enjoy the complete experience.
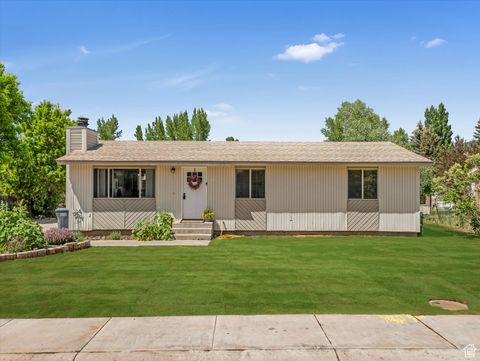
Active
$1,149,900
5
bds
|
2
ba
|
2,404
sqft
|
built
2007
2029 W Tollgate Canyon Rd, Coalville, UT 84017
$-3,150
Cash flow
-14.3%
Cash-on-Cash Return
2.4%
Cap rate
0.3%
Rent to Value Ratio
Active
$17,900,000
5
bds
|
8
ba
|
11,242
sqft
|
built
2001
22 White Pine Canyon Rd, Park City, UT 84060
$-86,487
Cash flow
-25.2%
Cash-on-Cash Return
-0.1%
Cap rate
0.0%
Rent to Value Ratio
Active
$3,990,000
6
bds
|
7
ba
|
6,874
sqft
|
built
2004
1978 Kidd Cir, Park City, UT 84098
$-14,820
Cash flow
-19.4%
Cash-on-Cash Return
1.2%
Cap rate
0.2%
Rent to Value Ratio
Active
$5,950,000
5
bds
|
6
ba
|
5,977
sqft
|
built
2015
3428 Westview Trl, Park City, UT 84098
$-24,113
Cash flow
-21.1%
Cash-on-Cash Return
0.8%
Cap rate
0.1%
Rent to Value Ratio
Active
$19,900,000
8
bds
|
9
ba
|
9,646
sqft
|
built
2001
2500 White Pine Ln, Park City, UT 84060
$-92,314
Cash flow
-24.2%
Cash-on-Cash Return
0.1%
Cap rate
0.0%
Rent to Value Ratio
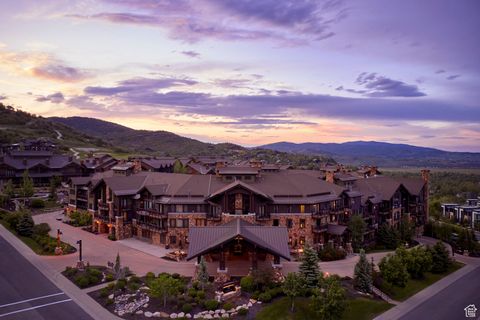
Active
$435,000
bds
|
1
ba
|
406
sqft
|
built
2020
2670 Canyons Resort Dr, Park City, UT 84098
$-1,270
Cash flow
-15.2%
Cash-on-Cash Return
2.2%
Cap rate
0.5%
Rent to Value Ratio
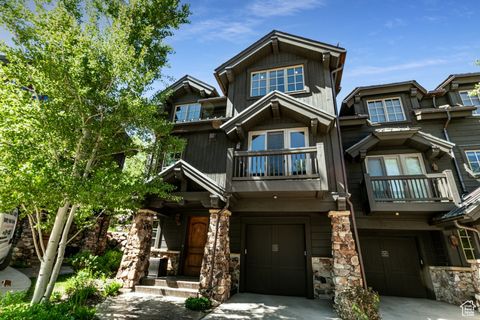
Active
$1,499,000
2
bds
|
3
ba
|
1,880
sqft
|
built
2022
6427 Double Deer Loop, Park City, UT 84098
$-5,170
Cash flow
-18.0%
Cash-on-Cash Return
1.5%
Cap rate
0.4%
Rent to Value Ratio
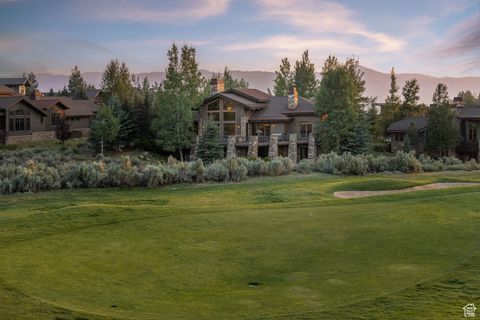
Active
$3,445,000
4
bds
|
4
ba
|
3,057
sqft
|
built
1985
1582 Deer Valley Dr N, Park City, UT 84060
$-13,400
Cash flow
-20.3%
Cash-on-Cash Return
1.0%
Cap rate
0.2%
Rent to Value Ratio
Active
$9,699,000
4
bds
|
5
ba
|
6,172
sqft
|
built
2018
800 Hollyhock St, Park City, UT 84098
$-42,280
Cash flow
-22.7%
Cash-on-Cash Return
0.4%
Cap rate
0.1%
Rent to Value Ratio
Active
$640,000
2
bds
|
2
ba
|
1,035
sqft
|
built
1997
900 Bitner Rd, Park City, UT 84098
$-1,845
Cash flow
-15.0%
Cash-on-Cash Return
2.2%
Cap rate
0.5%
Rent to Value Ratio
Active
$880,000
4
bds
|
3
ba
|
1,772
sqft
|
built
2022
6785 N Silver Creek Dr, Park City, UT 84098
$-2,817
Cash flow
-16.7%
Cash-on-Cash Return
1.8%
Cap rate
0.3%
Rent to Value Ratio
Active
$10,100,000
5
bds
|
6
ba
|
7,595
sqft
|
built
2019
1310 Mellow Mountain Rd, Park City, UT 84060
$-43,435
Cash flow
-22.4%
Cash-on-Cash Return
0.5%
Cap rate
0.1%
Rent to Value Ratio
Active
$6,250,000
5
bds
|
6
ba
|
6,368
sqft
|
built
2009
3023 E Wapiti Canyon Rd, Park City, UT 84098
$-26,441
Cash flow
-22.1%
Cash-on-Cash Return
0.6%
Cap rate
0.1%
Rent to Value Ratio
Active
$5,900,000
9
bds
|
8
ba
|
7,513
sqft
|
built
2001
7816 Long Rifle Rd, Park City, UT 84098
$-25,667
Cash flow
-22.7%
Cash-on-Cash Return
0.5%
Cap rate
0.1%
Rent to Value Ratio
Active
$1,048,889
2
bds
|
2
ba
|
1,296
sqft
|
built
1976
2100 Canyons Resort Dr, Park City, UT 84098
$-4,092
Cash flow
-20.4%
Cash-on-Cash Return
1.0%
Cap rate
0.3%
Rent to Value Ratio
Active
$1,595,000
2
bds
|
2
ba
|
1,207
sqft
|
built
1995
2650 Deer Valley Dr E, Park City, UT 84060
$-5,954
Cash flow
-19.5%
Cash-on-Cash Return
1.2%
Cap rate
0.3%
Rent to Value Ratio
Active
$1,150,000
3
bds
|
4
ba
|
1,752
sqft
|
built
2016
1348 Fiddich Glen Ln, Park City, UT 84098
$-3,438
Cash flow
-15.6%
Cash-on-Cash Return
2.1%
Cap rate
0.3%
Rent to Value Ratio
Active
$1,675,000
5
bds
|
5
ba
|
4,933
sqft
|
built
2006
279 Wild Willow Dr, Francis, UT 84036
$-3,001
Cash flow
-9.3%
Cash-on-Cash Return
3.5%
Cap rate
0.5%
Rent to Value Ratio
Active
$1,695,000
2
bds
|
2
ba
|
1,391
sqft
|
built
1997
690 Deer Valley Dr, Park City, UT 84060
$-6,543
Cash flow
-20.1%
Cash-on-Cash Return
1.0%
Cap rate
0.2%
Rent to Value Ratio
Active
$2,550,000
3
bds
|
4
ba
|
2,100
sqft
|
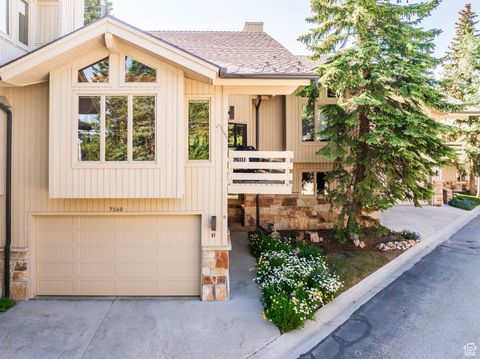
built
1985
7560 Ridge Dr, Park City, UT 84060
$-10,430
Cash flow
-21.3%
Cash-on-Cash Return
0.8%
Cap rate
0.2%
Rent to Value Ratio
Active
$2,575,000
4
bds
|
5
ba
|
3,730
sqft
|
built
2023
11795 N Star Gazer Cir, Hideout, UT 84036
$-9,892
Cash flow
-20.0%
Cash-on-Cash Return
1.1%
Cap rate
0.2%
Rent to Value Ratio
Active
$4,250,000
5
bds
|
4
ba
|
4,730
sqft
|
built
2002
1980 E Chalk Creek Rd, Coalville, UT 84017
$-15,811
Cash flow
-19.4%
Cash-on-Cash Return
1.2%
Cap rate
0.2%
Rent to Value Ratio
Active
$895,000
1
bds
|
1
ba
|
680
sqft
|
built
2007
3558 N Escala Ct, Park City, UT 84098
$-3,904
Cash flow
-22.8%
Cash-on-Cash Return
0.4%
Cap rate
0.3%
Rent to Value Ratio
Active
$1,050,000
4
bds
|
3
ba
|
2,977
sqft
|
built
2017
2143 Aspen Cir, Wanship, UT 84017
$-2,205
Cash flow
-11.0%
Cash-on-Cash Return
3.2%
Cap rate
0.4%
Rent to Value Ratio
Active
$5,000,000
4
bds
|
5
ba
|
3,872
sqft
|
built
2015
333 Main St, Park City, UT 84060
$-24,175
Cash flow
-25.2%
Cash-on-Cash Return
-0.1%
Cap rate
0.1%
Rent to Value Ratio
Active
$375,000
bds
|
1
ba
|
338
sqft
|
built
2020
2670 Canyons Resort Dr, Park City, UT 84098
$-1,179
Cash flow
-16.4%
Cash-on-Cash Return
1.9%
Cap rate
0.5%
Rent to Value Ratio
Active
$630,000
3
bds
|
1
ba
|
1,056
sqft
|
built
1976
155 Hawthorne Dr, Kamas, UT 84036
$-1,368
Cash flow
-11.3%
Cash-on-Cash Return
3.1%
Cap rate
0.4%
Rent to Value Ratio
Active
$995,000
1
bds
|
2
ba
|
741
sqft
|
built
2009
2100 Frostwood Blvd, Park City, UT 84098
$-4,358
Cash flow
-22.9%
Cash-on-Cash Return
0.4%
Cap rate
0.4%
Rent to Value Ratio
Active
$5,995,000
4
bds
|
6
ba
|
3,370
sqft
|
built
2004
8789 Marsac Ave, Park City, UT 84060
$-27,724
Cash flow
-24.1%
Cash-on-Cash Return
0.1%
Cap rate
0.1%
Rent to Value Ratio
Active
$3,995,000
4
bds
|
5
ba
|
5,210
sqft
|
built
2007
2711 E Bitter Brush Dr, Park City, UT 84098
$-14,319
Cash flow
-18.7%
Cash-on-Cash Return
1.4%
Cap rate
0.2%
Rent to Value Ratio
Active
$1,750,000
5
bds
|
5
ba
|
3,236
sqft
|
built
1988
1492 Meadow Loop Rd, Park City, UT 84098
$-3,871
Cash flow
-11.5%
Cash-on-Cash Return
3.0%
Cap rate
0.5%
Rent to Value Ratio
Active
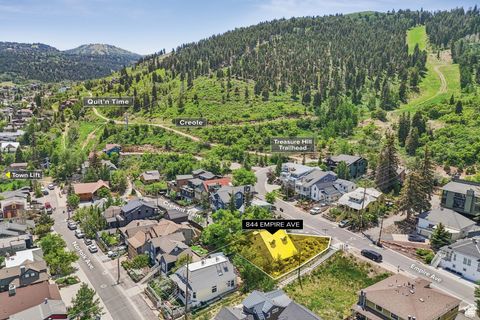
$1,995,000
2
bds
|
1
ba
|
783
sqft
|
built
1904
844 Empire Ave, Park City, UT 84060
$-7,194
Cash flow
-18.8%
Cash-on-Cash Return
1.4%
Cap rate
0.2%
Rent to Value Ratio
Active
$1,699,000
4
bds
|
4
ba
|
3,387
sqft
|
built
1993
366 Valley Dr, Park City, UT 84098
$-4,615
Cash flow
-14.2%
Cash-on-Cash Return
2.4%
Cap rate
0.3%
Rent to Value Ratio

Active
$6,500,000
4
bds
|
4
ba
|
3,986
sqft
|
built
1991
266 Old Ranch Rd, Park City, UT 84098
$-26,244
Cash flow
-21.1%
Cash-on-Cash Return
0.8%
Cap rate
0.1%
Rent to Value Ratio
Active
$2,295,000
2
bds
|
2
ba
|
1,076
sqft
|
built
1885
259 Park Ave, Park City, UT 84060
$-9,222
Cash flow
-21.0%
Cash-on-Cash Return
0.9%
Cap rate
0.2%
Rent to Value Ratio
Active
$7,300,000
5
bds
|
5
ba
|
3,386
sqft
|
built
2007
8902 Empire Club Dr, Park City, UT 84060
$-36,391
Cash flow
-26.0%
Cash-on-Cash Return
-0.3%
Cap rate
0.1%
Rent to Value Ratio
Active
$1,430,000
3
bds
|
2
ba
|
1,608
sqft
|
built
2000
1143 Station Loop Rd, Park City, UT 84098
$-4,413
Cash flow
-16.1%
Cash-on-Cash Return
2.0%
Cap rate
0.3%
Rent to Value Ratio
Active
$519,900
2
bds
|
2
ba
|
854
sqft
|
built
1983
6821 N 2200 W, Park City, UT 84098
$-1,561
Cash flow
-15.7%
Cash-on-Cash Return
2.1%
Cap rate
0.5%
Rent to Value Ratio