Cache County Investment Properties for Sale
Browse homes for sale and investment properties in Cache County. Refine your search by price, property type, or more.
Best cash flowing properties in Cache County
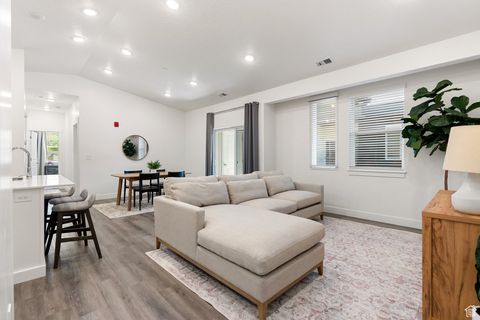
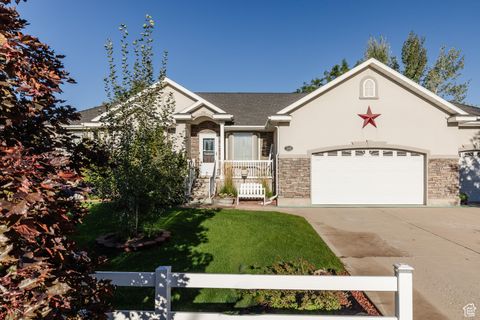
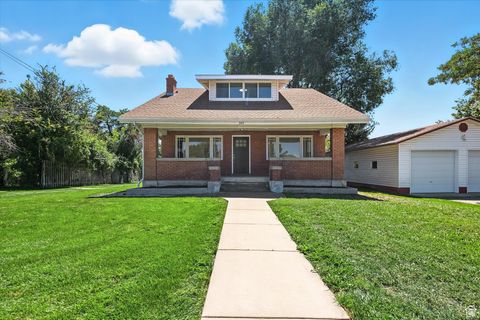
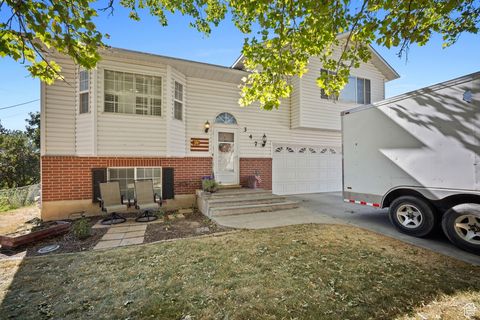
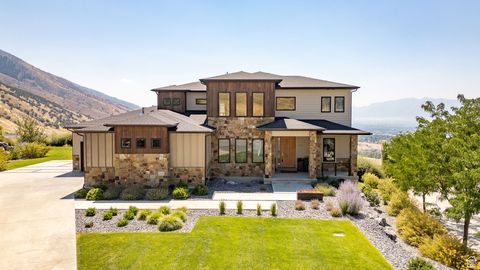
Active
$269,900
2
bds
|
2
ba
|
1,125
sqft
|
built
2020
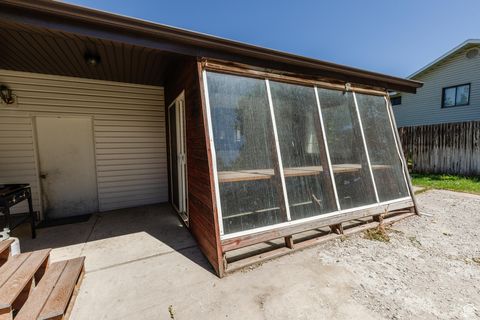
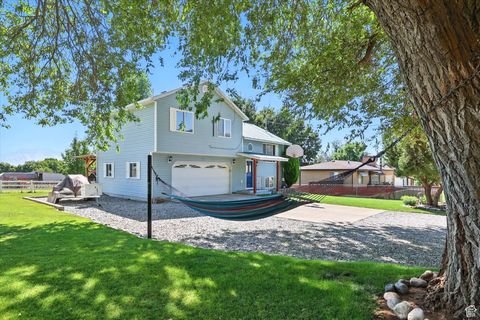
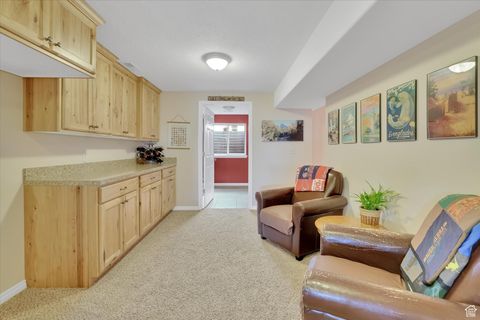
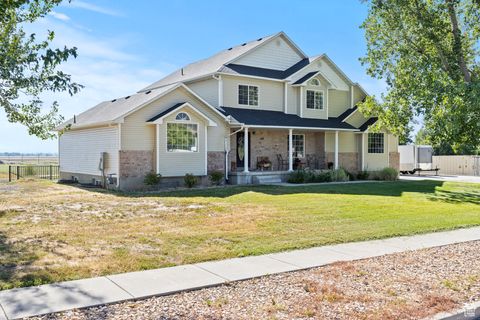
460 W 15 S, Providence, UT 84332
$-266
Cash flow
-5.1%
Cash-on-Cash Return
4.5%
Cap rate
0.7%
Rent to Value Ratio
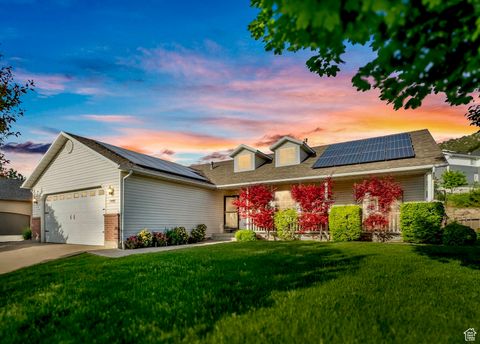
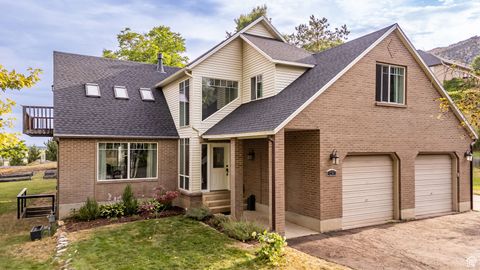
Active
$317,000
2
bds
|
2
ba
|
1,826
sqft
|
built
1988
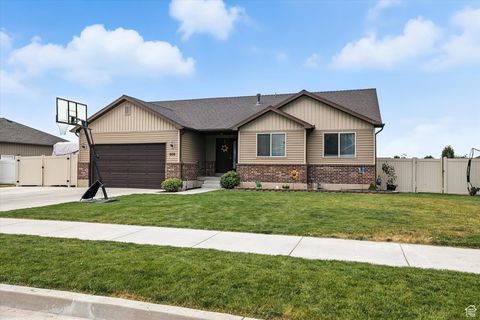
77 N 100 W, Trenton, UT 84338
$-482
Cash flow
-7.9%
Cash-on-Cash Return
3.9%
Cap rate
0.5%
Rent to Value Ratio
186 out of 229 properties for sale in Cache County
Limited Results Shown
Create a free account, or log in to reveal all property listings and enjoy the complete experience.
Active
$749,000
5
bds
|
3
ba
|
3,311
sqft
|
built
1997
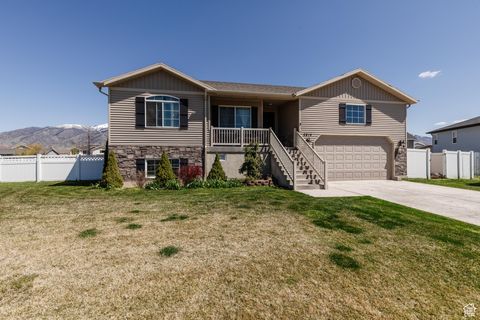
1990 E Canyon Ridge Dr, North Logan, UT 84341
$-1,918
Cash flow
-13.4%
Cash-on-Cash Return
2.6%
Cap rate
0.4%
Rent to Value Ratio
Active
$418,000
3
bds
|
3
ba
|
1,360
sqft
|
built
2012
485 W 880 N, Logan, UT 84321
$-910
Cash flow
-11.4%
Cash-on-Cash Return
3.1%
Cap rate
0.4%
Rent to Value Ratio
Active
$599,900
6
bds
|
3
ba
|
3,053
sqft
|
built
2005
2899 S 1080 W, Nibley, UT 84321
$-1,093
Cash flow
-9.5%
Cash-on-Cash Return
3.5%
Cap rate
0.5%
Rent to Value Ratio
Active
$575,000
5
bds
|
3
ba
|
3,835
sqft
|
built
2000
1092 S 470 E, Providence, UT 84332
$-1,019
Cash flow
-9.2%
Cash-on-Cash Return
3.6%
Cap rate
0.5%
Rent to Value Ratio
Active
$399,900
4
bds
|
2
ba
|
1,640
sqft
|
built
1953
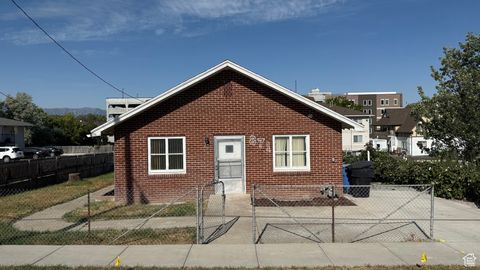
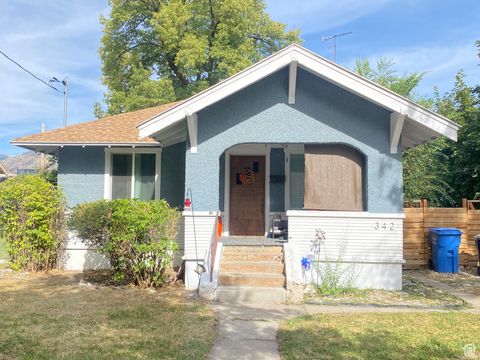
85 N Center St, Hyrum, UT 84319
$-1,087
Cash flow
-14.2%
Cash-on-Cash Return
2.4%
Cap rate
0.4%
Rent to Value Ratio
Active
$349,900
3
bds
|
3
ba
|
1,481
sqft
|
built
2015
449 E 2170 N, Logan, UT 84341
$-804
Cash flow
-12.0%
Cash-on-Cash Return
2.9%
Cap rate
0.5%
Rent to Value Ratio
Active
$549,900
4
bds
|
3
ba
|
2,972
sqft
|
built
1983
330 E 100 N, Hyde Park, UT 84318
$-1,044
Cash flow
-9.9%
Cash-on-Cash Return
3.4%
Cap rate
0.5%
Rent to Value Ratio
Active
$485,000
5
bds
|
3
ba
|
2,666
sqft
|
built
2015
2814 S 1150 W, Nibley, UT 84321
$-774
Cash flow
-8.3%
Cash-on-Cash Return
3.8%
Cap rate
0.5%
Rent to Value Ratio
Active
$539,500
4
bds
|
3
ba
|
3,012
sqft
|
built
1981
235 E 1100 N, Logan, UT 84341
$-1,491
Cash flow
-14.4%
Cash-on-Cash Return
2.4%
Cap rate
0.3%
Rent to Value Ratio
Active
$625,000
5
bds
|
3
ba
|
3,218
sqft
|
built
1994
1575 N 1640 E, Logan, UT 84341
$-1,450
Cash flow
-12.1%
Cash-on-Cash Return
2.9%
Cap rate
0.4%
Rent to Value Ratio
Active
$649,900
5
bds
|
2
ba
|
3,370
sqft
|
built
1919
325 W 300 N, Hyrum, UT 84319
$-1,876
Cash flow
-15.1%
Cash-on-Cash Return
2.2%
Cap rate
0.3%
Rent to Value Ratio
Active
$669,000
5
bds
|
3
ba
|
3,995
sqft
|
built
1996
462 E 520 S, Smithfield, UT 84335
$-1,765
Cash flow
-13.8%
Cash-on-Cash Return
2.5%
Cap rate
0.3%
Rent to Value Ratio
Active
$525,000
3
bds
|
3
ba
|
2,730
sqft
|
built
2007
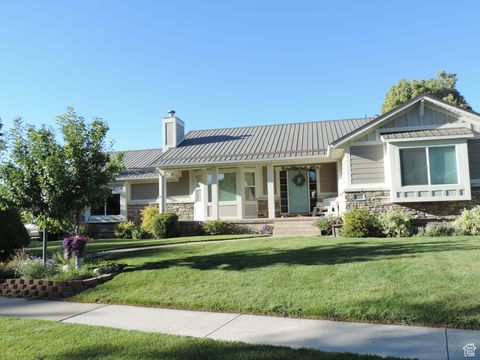
14 Shadow Mountain Dr, Logan, UT 84321
$-1,145
Cash flow
-11.4%
Cash-on-Cash Return
3.1%
Cap rate
0.5%
Rent to Value Ratio
Active
$332,900
3
bds
|
3
ba
|
1,583
sqft
|
built
2007
514 W 1490 N, Logan, UT 84341
$-603
Cash flow
-9.5%
Cash-on-Cash Return
3.5%
Cap rate
0.5%
Rent to Value Ratio
Active
$424,990
3
bds
|
2
ba
|
1,521
sqft
|
built
1996
136 S 200 W, Wellsville, UT 84339
$-786
Cash flow
-9.6%
Cash-on-Cash Return
3.5%
Cap rate
0.5%
Rent to Value Ratio
Active
$1,250,000
5
bds
|
3
ba
|
3,784
sqft
|
built
1974
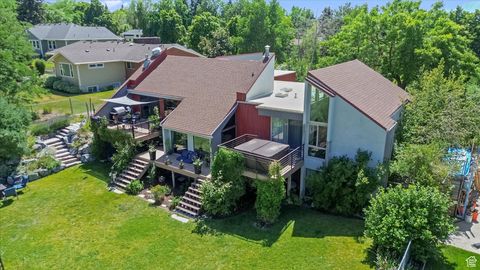
510 Spring Creek Rd, Providence, UT 84332
$-4,248
Cash flow
-17.7%
Cash-on-Cash Return
1.6%
Cap rate
0.2%
Rent to Value Ratio
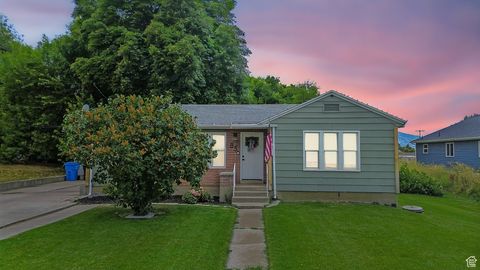
Active
$425,000
4
bds
|
1
ba
|
1,820
sqft
|
built
1915
871 N 700 E, Logan, UT 84321
$-902
Cash flow
-11.1%
Cash-on-Cash Return
3.1%
Cap rate
0.4%
Rent to Value Ratio
Active
$752,000
4
bds
|
3
ba
|
3,668
sqft
|
built
1998
7485 N 2400 W, Amalga, UT 84335
$-2,201
Cash flow
-15.3%
Cash-on-Cash Return
2.2%
Cap rate
0.3%
Rent to Value Ratio
Active
$495,000
4
bds
|
3
ba
|
2,492
sqft
|
built
1999
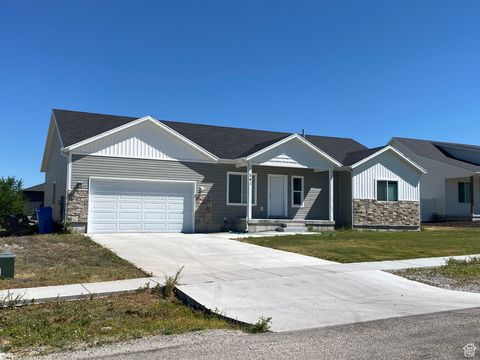
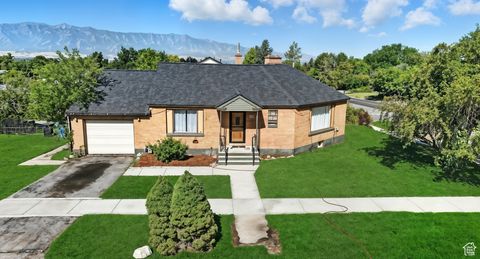
55 S 1000 E, Logan, UT 84321
$-761
Cash flow
-8.0%
Cash-on-Cash Return
3.8%
Cap rate
0.5%
Rent to Value Ratio
Active
$544,900
5
bds
|
3
ba
|
2,960
sqft
|
built
2013
609 N 130 E, Smithfield, UT 84335
$-1,162
Cash flow
-11.1%
Cash-on-Cash Return
3.1%
Cap rate
0.4%
Rent to Value Ratio
Active
$335,000
3
bds
|
2
ba
|
1,404
sqft
|
built
1916
342 N 100 W, Logan, UT 84321
$-530
Cash flow
-8.3%
Cash-on-Cash Return
3.8%
Cap rate
0.5%
Rent to Value Ratio
Active
$498,000
3
bds
|
2
ba
|
2,986
sqft
|
built
2022
341 E 250 N, Richmond, UT 84333
$-822
Cash flow
-8.6%
Cash-on-Cash Return
3.7%
Cap rate
0.5%
Rent to Value Ratio
Active
$769,000
7
bds
|
4
ba
|
4,113
sqft
|
built
1999
518 N 220 E, Mendon, UT 84325
$-2,163
Cash flow
-14.7%
Cash-on-Cash Return
2.3%
Cap rate
0.3%
Rent to Value Ratio
Active
$674,000
5
bds
|
4
ba
|
3,457
sqft
|
built
1992
1801 N 1700 E, North Logan, UT 84341
$-1,489
Cash flow
-11.5%
Cash-on-Cash Return
3.0%
Cap rate
0.4%
Rent to Value Ratio
Active
$670,000
5
bds
|
3
ba
|
3,100
sqft
|
built
2005
2269 Clear Creek Rd, Nibley, UT 84321
$-1,767
Cash flow
-13.8%
Cash-on-Cash Return
2.5%
Cap rate
0.3%
Rent to Value Ratio
Active
$414,999
5
bds
|
3
ba
|
2,460
sqft
|
built
2016
104 E 650 S, Smithfield, UT 84335
$-1,259
Cash flow
-15.8%
Cash-on-Cash Return
2.0%
Cap rate
0.4%
Rent to Value Ratio
Active
$395,000
4
bds
|
2
ba
|
1,800
sqft
|
built
1997
347 S 530 E, Smithfield, UT 84335
$-625
Cash flow
-8.3%
Cash-on-Cash Return
3.8%
Cap rate
0.5%
Rent to Value Ratio
Active
$349,900
4
bds
|
3
ba
|
2,019
sqft
|
built
1998
1950 S 1250 W, Logan, UT 84321
$-521
Cash flow
-7.8%
Cash-on-Cash Return
3.9%
Cap rate
0.5%
Rent to Value Ratio
Active
$399,000
4
bds
|
3
ba
|
2,574
sqft
|
built
1983
2306 S Pelican Pond Rd, Wellsville, UT 84339
$-789
Cash flow
-10.3%
Cash-on-Cash Return
3.3%
Cap rate
0.5%
Rent to Value Ratio
Active
$792,000
5
bds
|
4
ba
|
3,524
sqft
|
built
2017
444 E 100 N, Millville, UT 84326
$-1,574
Cash flow
-10.4%
Cash-on-Cash Return
3.3%
Cap rate
0.4%
Rent to Value Ratio
Active
$1,595,000
6
bds
|
6
ba
|
5,494
sqft
|
built
2018
2835 Naomi Cir, North Logan, UT 84341
$-5,963
Cash flow
-19.5%
Cash-on-Cash Return
1.2%
Cap rate
0.2%
Rent to Value Ratio
Active
$745,000
6
bds
|
4
ba
|
4,517
sqft
|
built
1985
591 Vons Way Dr, Providence, UT 84332
$-1,650
Cash flow
-11.6%
Cash-on-Cash Return
3.0%
Cap rate
0.4%
Rent to Value Ratio
Active
$729,900
4
bds
|
4
ba
|
3,580
sqft
|
built
2013
84 N 820 E, Hyde Park, UT 84318
$-1,216
Cash flow
-8.7%
Cash-on-Cash Return
3.7%
Cap rate
0.5%
Rent to Value Ratio
Active
$410,000
3
bds
|
1
ba
|
2,008
sqft
|
built
1942
14 S 400 W, Hyrum, UT 84319
$-687
Cash flow
-8.7%
Cash-on-Cash Return
3.7%
Cap rate
0.5%
Rent to Value Ratio
Active
$1,200,000
6
bds
|
4
ba
|
4,447
sqft
|
built
1995
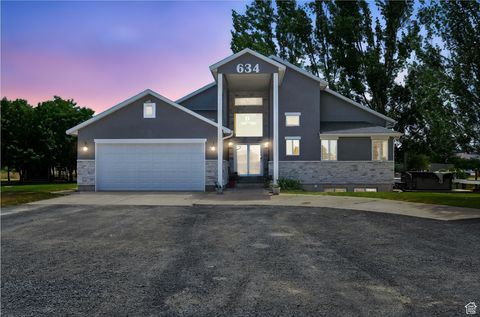
634 W 8300 S, Paradise, UT 84328
$-4,034
Cash flow
-17.5%
Cash-on-Cash Return
1.6%
Cap rate
0.2%
Rent to Value Ratio
Active
$480,000
4
bds
|
2
ba
|
2,960
sqft
|
built
1951
407 S 100 W, Providence, UT 84332
$-515
Cash flow
-5.6%
Cash-on-Cash Return
4.4%
Cap rate
0.6%
Rent to Value Ratio
Active
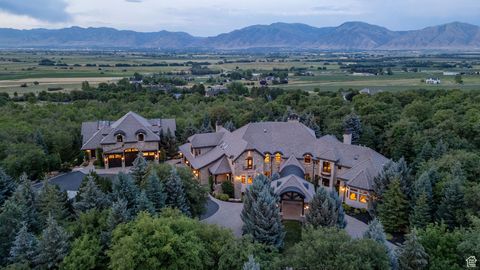
$11,600,000
6
bds
|
8
ba
|
16,617
sqft
|
built
2005
5624 W 3400 S, Wellsville, UT 84339
$-53,570
Cash flow
-24.1%
Cash-on-Cash Return
0.1%
Cap rate
0.0%
Rent to Value Ratio
Active
$397,000
2
bds
|
2
ba
|
2,312
sqft
|
built
1921
235 W 500 N, Logan, UT 84321
$-1,117
Cash flow
-14.7%
Cash-on-Cash Return
2.3%
Cap rate
0.3%
Rent to Value Ratio