$434,900
Investment Summary
- Monthly Cash Flow
- -$817
- Cap Rate
- 3.9%
- Cash-on-Cash Return
- -9.8%
- Debt Coverage Ratio
- 0.63
- Internal Rate of Return (5 years)
- -5.5%
Cash Flow
Net Operating Income (NOI) minus mortgage payments.
Calculation:
NOI - Mortgage Payments
Cap Rate (Market Value)
Capitalization Rate is a rate of return that compares the yearly Net Operating Income (NOI) to the market value.
Calculation:
NOI / Market Value
Cash-on-Cash Return (CoC)
Annual Cash Flow / Cash Invested
Calculation:
Annual cash flow divided by initial cash invested.
Debt Coverage Ratio (DCR)
Net Operating Income (NOI) divided by total debt payments.
Calculation:
NOI / Total Debt Payments
Internal Rate of Return (IRR)
A metric for assessing profitability over time. IRR is the discount rate at which the net present value (NPV) of all future cash flows (positive and negative) from an investment equals zero — including both periodic cash flow (such as rent) and a projected sale at the end of the holding period. It represents the expected annualized return, accounting for income, expenses, and the recovery of capital through a future sale.
Property Description
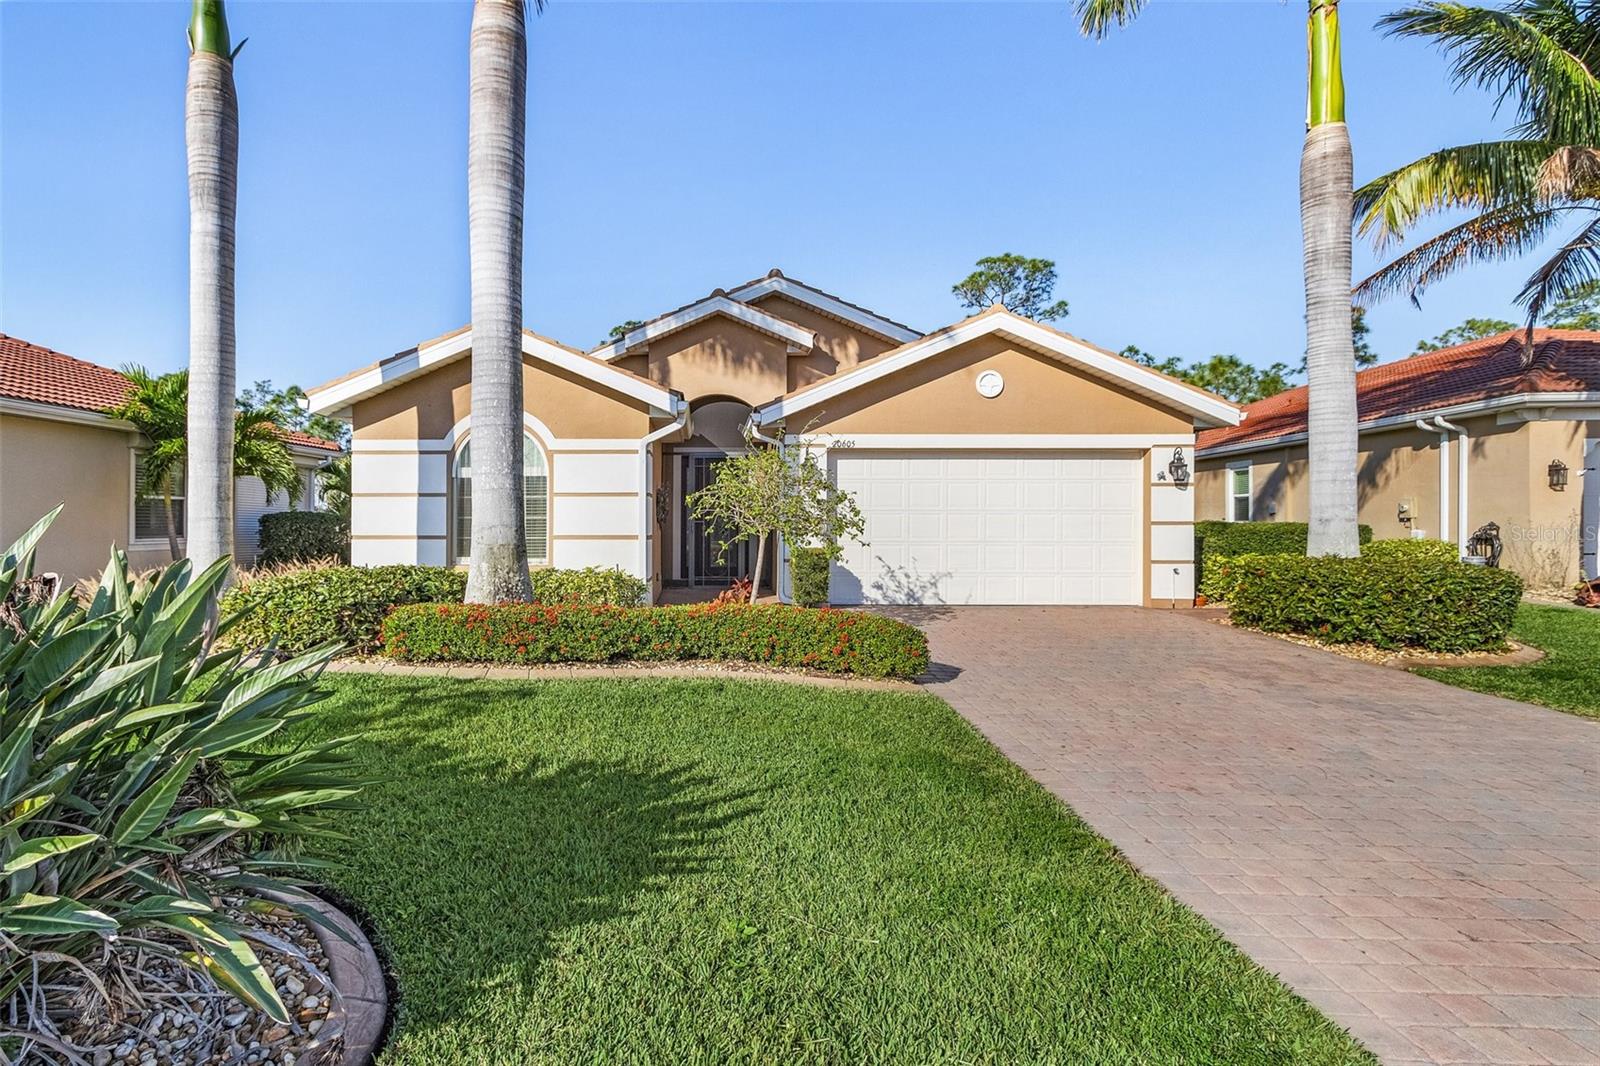
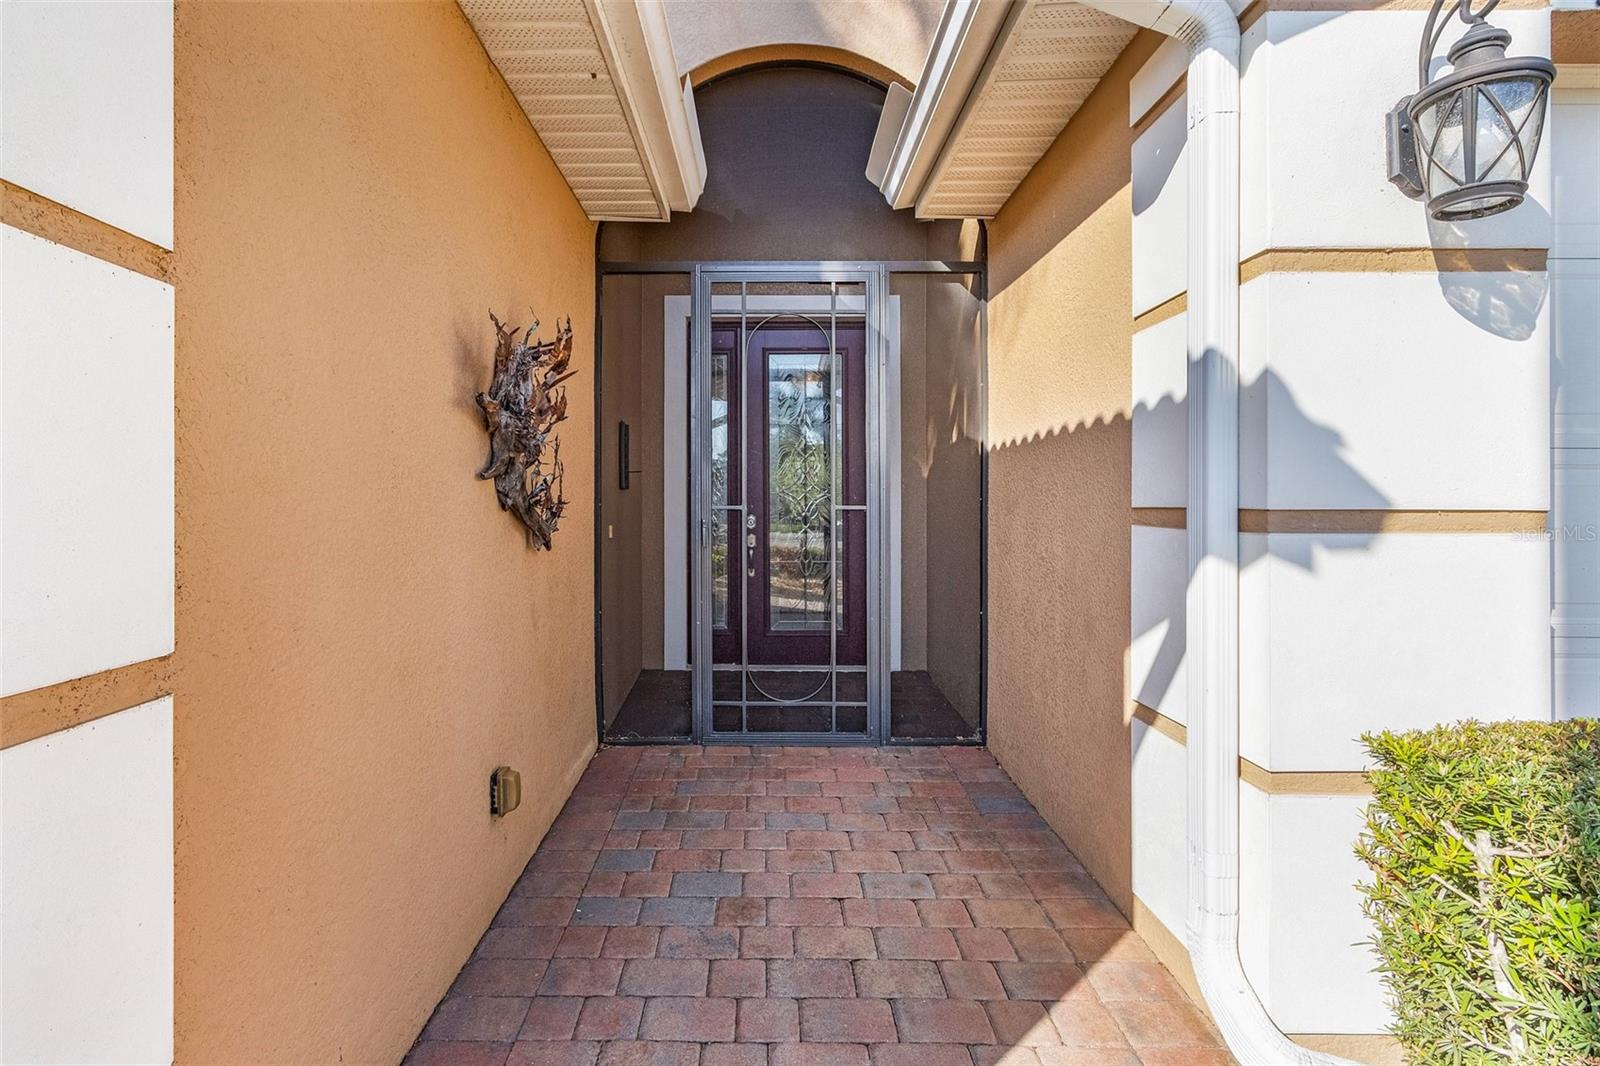
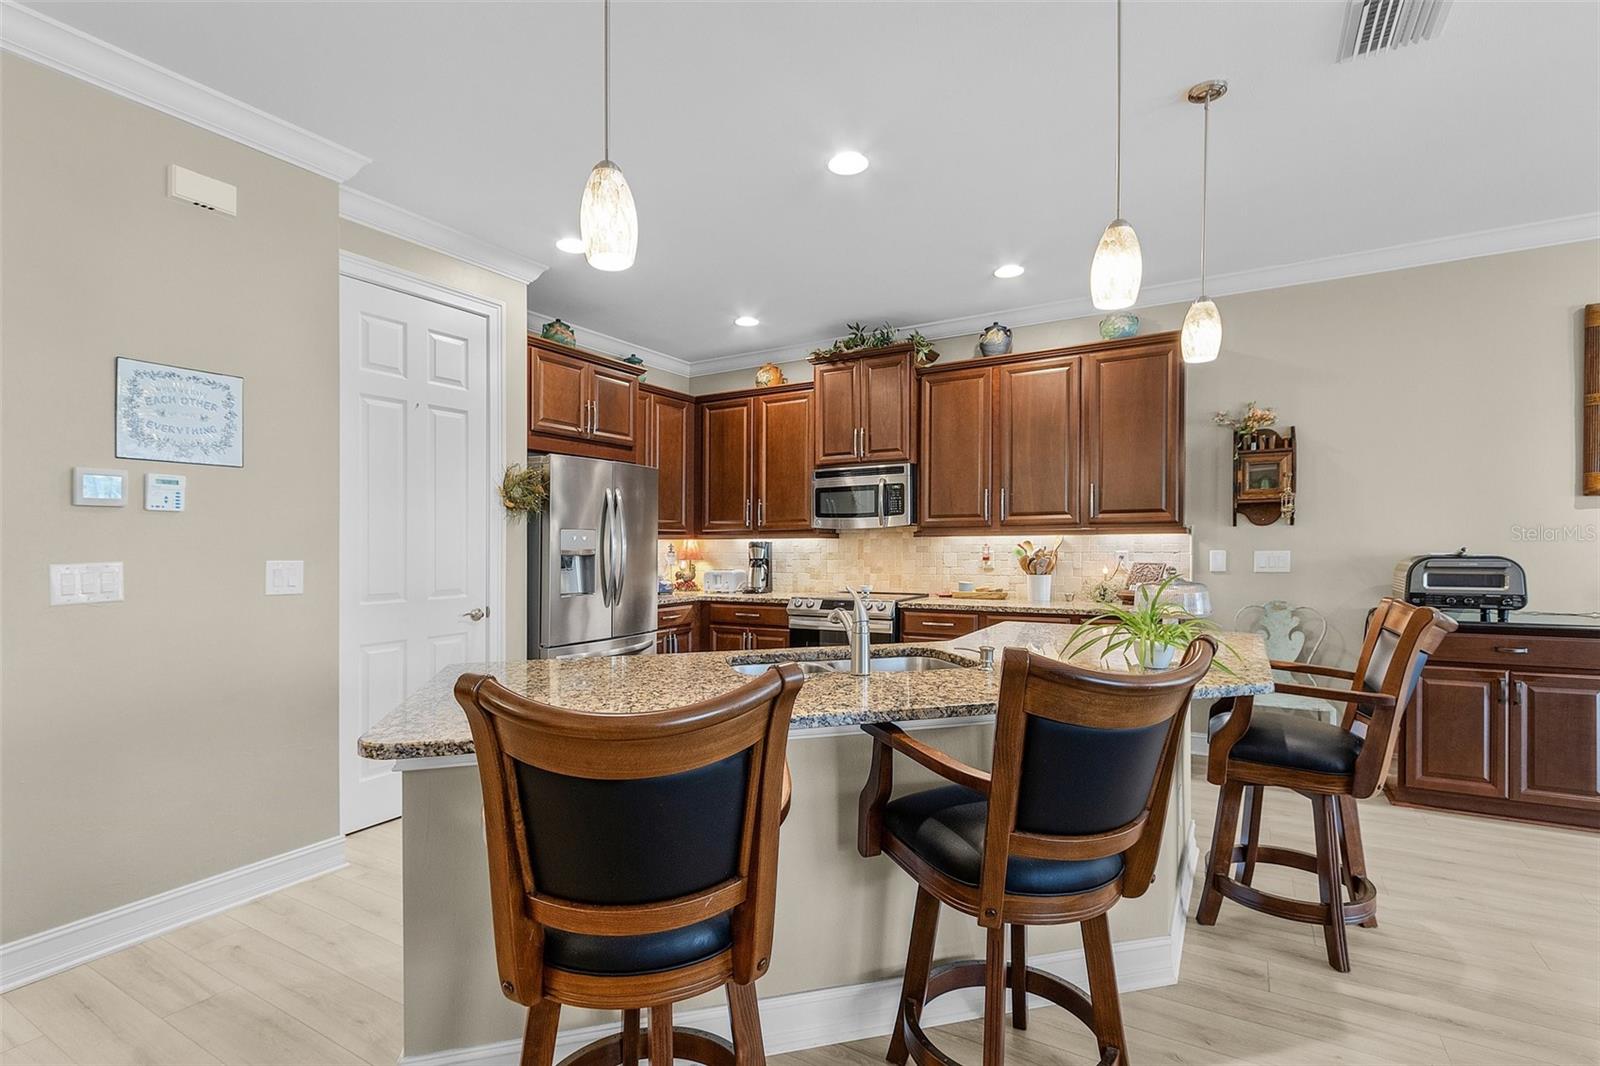
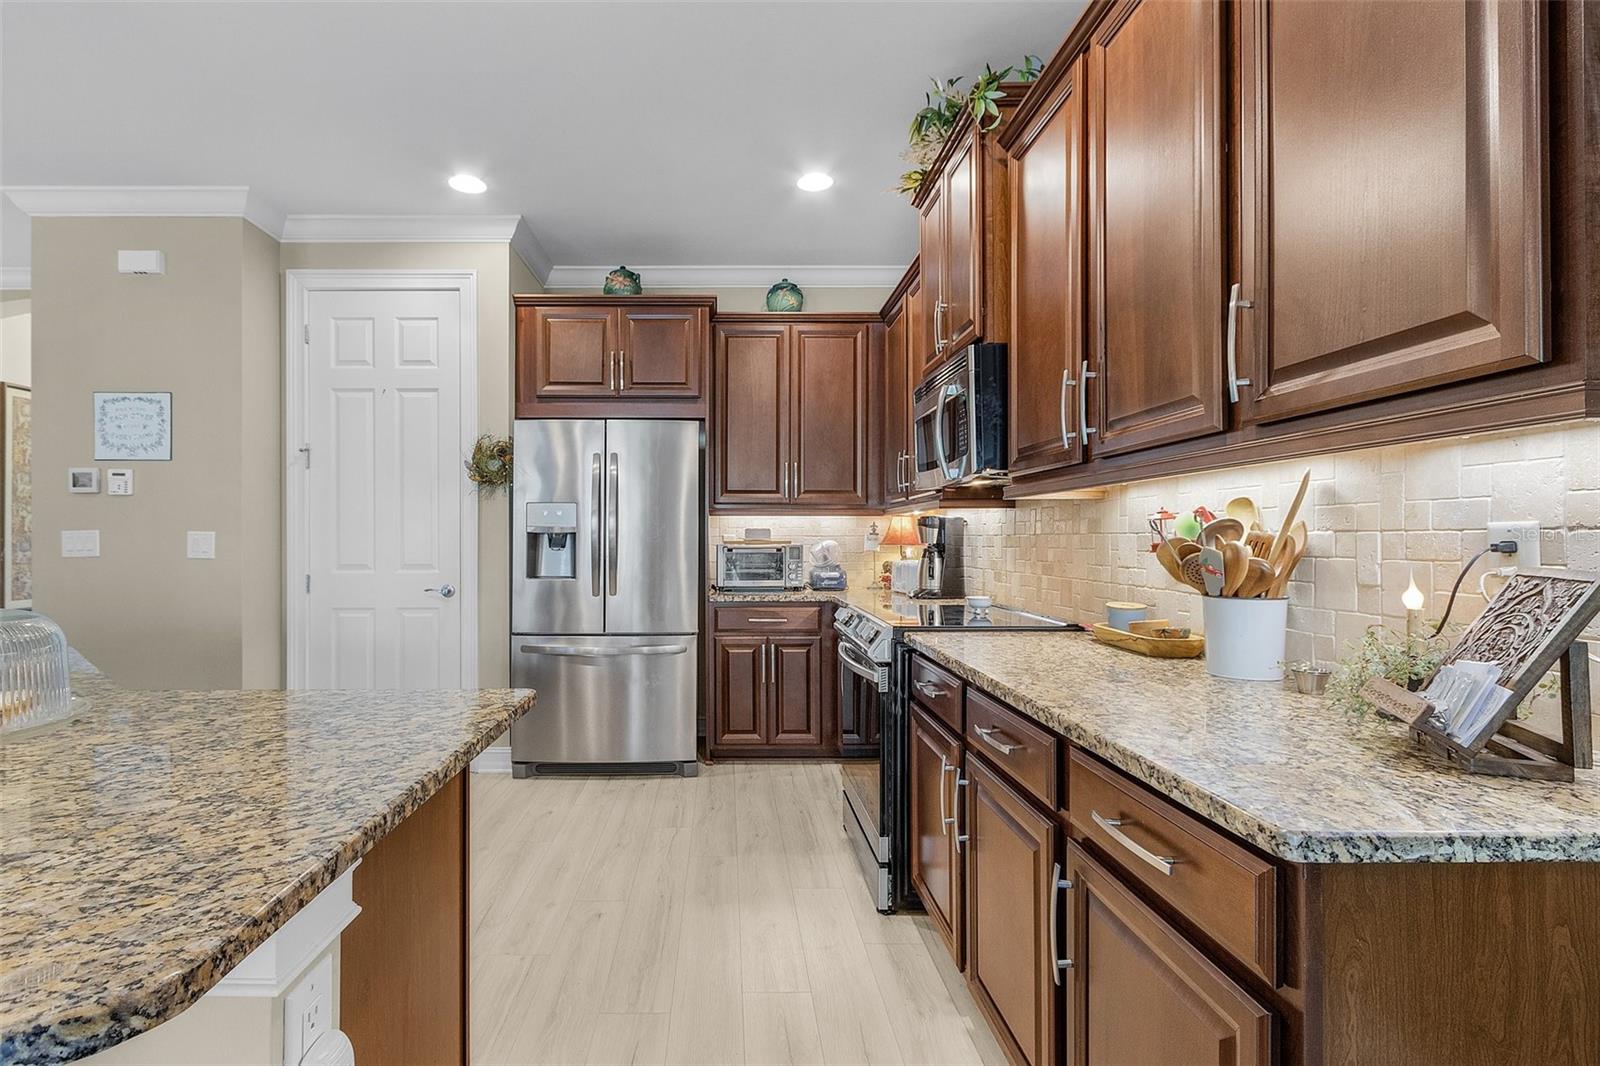
*BEST PRICE PER SQFT IN MAGNOLIA!!*Schedule A Same Day Tour On REDFIN App*Located on the most distinguished street in the desirable Magnolia Landing community, this upgraded 2-bedroom plus den, 2 bathroom Pembroke model home blends luxury, functionality, and privacy. Set back on the ~1/4 acre lot and backing to a protected preserve, the property ensures long-term seclusion. With advanced systems and premium finishes throughout, this home offers both comfort and style. The open-concept design features a gourmet kitchen with granite countertops, tumbled marble backsplashes, soft-close cabinets with pull-out drawers, and upgraded appliances, including induction cooking technology. The spacious living and dining areas are ideal for entertaining, offering a seamless flow to the outdoor covered lanai. A custom TV installation area in the living room, with wires and cables concealed within the walls, conveys with the home for a clean, sleek look. Impact-resistant doors and electric accordion storm shutters on the windows and lanai provide added security. The home is equipped with a GenerLink system for easy generator hookup and an integrated surge protector for peace of mind. MinkaAire ceiling fans with remote controls are installed throughout for optimal air circulation. The primary suite offers a custom Kohler rain shower, a luxurious soaker tub with granite finishes, and a spacious walk-in closet. Another custom TV installation area ensures a sleek look in the suite as well. Upgraded lighting and fixtures, along with crown molding, 10-foot ceilings, and 8-foot doors, add an elegant touch to the entire home. Outdoor living is exceptional, with a heated saltwater pool featuring a Pebble Tec surface, an infinity spill-over spa with glass tile, and LED lighting. The paver pool deck, set on concrete to prevent settling, ensures durability. The expansive lanai connects seamlessly to the indoor living areas, providing an ideal space for relaxation and entertaining. Additional features include a temperature-controlled garage with epoxy flooring, built-in storage cabinets, and shelving. The upgraded laundry room includes a sink, as well as an upgraded HG washer and dryer. The den, an optional builder feature, has French doors and custom TV installation, allowing for flexible use as an office, media room, or additional living space. The property is professionally landscaped to enhance privacy, with tropical plantings that create a secluded oasis. Located within a 24-hour gated community, Magnolia Landing offers resort-style amenities, including a Gordon Lewis-designed golf course (membership optional), a clubhouse with a restaurant and bar, fitness centers, and resort-style swimming pools. This home, with its thoughtful design, high-end finishes, and prime location, provides a sophisticated living experience, combining privacy and convenience in an ideal setting. Welcome home!
Build Your Team
Quickly find investor-friendly professionals who can help you succeed in real estate investing at any stage of the investing journey.


Agents
Match with investor-friendly agents who can help you find, analyze, and close your next deal


Lenders
Get the best funding…find investor-friendly lenders who specialize in your deal strategy


Property Managers
Transition to passive investing. Find a trusted property management partnership that lasts.


Tax Pros & Accountants
Taxes and financial reporting made easy—find experts to create tax savings strategies, file taxes, and more
Location
Property Details
Parking
- Description: Attached, Garage, TwoSpaces, GarageDoorOpener
- Details: Driveway, Garage Door Opener, Attached
- Garage Spaces: 2
- Spaces Total: 0
Bedroom Information
- # of Bedrooms: 2
Bathroom Information
- # of Baths (Full): 2
- # of Baths (Total): 2.0
Interior Features
- # of Rooms: 3
- # of Stories: 1
Exterior Features
- Exterior Walls Materials: Stucco
- Foundation: Slab
- Roof Type: IRR/Cathedral
- Roof Material: Tile
- Pool: Yes
- Pool Community: Yes
HOA
- Has HOA: Yes
- Association: Magnolia Landing Master Association
- HOA Fee: $768/quarterly
Land Information
- Land Use: Residential
- Land Use Subtype: Single Family Residential
Lot Information
- Parcel ID: 0443241200000.0140
- Lot Size: 9206 sqft
Property Information
- Property Type: Single Family Residence
- Year Built: 2015
Tax Information
- Annual Tax: $6,495
Utilities
- Water & Sewer: Public
- Heating: Central, Electric
- Cooling: Central Air
Location
- County: Lee
Listing Details
Investment Summary
- Monthly Cash Flow
- -$817
- Cap Rate
- 3.9%
- Cash-on-Cash Return
- -9.8%
- Debt Coverage Ratio
- 0.63
- Internal Rate of Return (5 years)
- -5.5%
Cash Flow
Net Operating Income (NOI) minus mortgage payments.
Calculation:
NOI - Mortgage Payments
Cap Rate (Market Value)
Capitalization Rate is a rate of return that compares the yearly Net Operating Income (NOI) to the market value.
Calculation:
NOI / Market Value
Cash-on-Cash Return (CoC)
Annual Cash Flow / Cash Invested
Calculation:
Annual cash flow divided by initial cash invested.
Debt Coverage Ratio (DCR)
Net Operating Income (NOI) divided by total debt payments.
Calculation:
NOI / Total Debt Payments
Internal Rate of Return (IRR)
A metric for assessing profitability over time. IRR is the discount rate at which the net present value (NPV) of all future cash flows (positive and negative) from an investment equals zero — including both periodic cash flow (such as rent) and a projected sale at the end of the holding period. It represents the expected annualized return, accounting for income, expenses, and the recovery of capital through a future sale.
Purchase Details
Purchase PriceThe price paid for the property. Purchase price:
| $434,900 |
|---|---|
Amount FinancedThe amount of the purchase financed through a loan. Amount financed:
| -$347,920 |
Down paymentThe initial payment made towards the purchase. Down payment:
| $86,980 |
Closing CostsFees and expenses associated with purchasing a property, typically ranging from 2% to 5% of the home’s purchase price, paid at the end of a home purchase to cover services like lending, title transfer, and taxes. Closing costs:
| $13,047 |
Rehab CostsCosts incurred to repair or improve the property, including: roof, flooring, exterior siding, kitchen, exterior paint, bathrooms, etc. Rehab costs:
| $0 |
Initial Cash InvestedThe total initial cash invested in the property. Calculation:Down payment + Buying costs + Rehab costs Initial cash invested:
| $100,027 |
Square Feet (SQFT)The total square footage of the property. Square feet:
| 1,805 |
Cost Per Square FootCost per square foot of the property. Calculation:Purchase Price / Square Feet Cost per square foot:
| $241 |
Monthly Rent Per Square FootMonthly rent divided by the number of square feet. This ratio helps investors compare rental income efficiency across properties, markets, and unit sizes Calculation:Monthly Rent / Square Feet Monthly rent per square foot:
| $1.77 |
Financing Details
Loan AmountThe total sum of money borrowed from a lender to finance a property purchase. Calculation:Purchase Price - Down Payment
Loan amount:
| $347,920 |
|---|---|
Loan to Value Ratio (LTV)Loan amount divided by the market value of the property. Calculation:Loan Amount / Market Value
Loan to value ratio:
| 80.0% |
Loan TypeThe type of loan (e.g., fixed, adjustable).
Loan type:
| Amortizing |
TermThe loan repayment period in years.
Term:
| 30 years |
Interest RateThe percentage a lender charges on the borrowed amount of a loan, determining the cost of borrowing money.
Interest rate:
| 6.625% |
Principal & Interest (PI)The principal is the portion of the loan payment that reduces the loan balance. The interest is the lender's charge for borrowing money. Calculation:(P * r * (1 + r) ** n) / ((1 + r) ** n - 1) Where:
P = Loan amount (principal)
Principal & interest:
| $2,228 |
Property TaxesAnnual taxes levied by local governments on real estate properties. These taxes fund public services like schools, roads, and emergency services.
Property tax:
| $541 |
InsuranceThe costs for insurance coverage to protect against financial losses due to risks like fire, natural disasters, theft, liability, or tenant-related damages. Calculation:Assumes 7% of gross rental income, unless insurance rates are specified.
Insurance:
| $224 |
Private Mortgage Insurance (PMI)A fee that borrowers pay when they take out a conventional loan with a loan-to-value (LTV) ratio above 80%.
Private mortgage insurance (PMI):
| $0 |
Monthly PaymentThe fixed amount a borrower pays each month to repay a loan. It typically includes principal and interest (P&I) and may also cover property taxes, insurance, HOA fees, and PMI if escrowed. Monthly payment:
| $2,993 |
Operating Income
| % Rent | Monthly | Yearly | |
|---|---|---|---|
Gross RentThe total rental income received from tenants before deducting any expenses. Includes base rent, late fees, pet fees, parking fees, and other recurring charges.
Gross rent:
| $3,200 | $38,400 | |
Vacancy LossExpected loss of rent due to vacancies.
Vacancy loss:
(6%)
| 6% | -$192 | -$2,304 |
Operating IncomeGross rental income minus vacancy loss. Calculation:Gross rent - Vacancy loss
Operating income:
| $3,008 | $36,096 |
Operating Expenses
| % Rent | Monthly | Yearly | |
|---|---|---|---|
Property TaxesAnnual taxes levied by local governments on real estate properties. These taxes fund public services like schools, roads, and emergency services. | 17% | -$541 | -$6,496 |
InsuranceThe costs for insurance coverage to protect against financial losses due to risks like fire, natural disasters, theft, liability, or tenant-related damages. Calculation:Assumes 7% of gross rental income, unless insurance rates are specified. | 7% | -$224 | -$2,688 |
Property ManagementThe costs associated with hiring a property manager to handle the day-to-day operations of a rental property. Includes management fees, leasing fes, eviction fees, etc. Calculation:Assumes 8% of gross rental income. | 8% | -$256 | -$3,072 |
Repairs & MaintenanceOngoing costs for routine upkeep and minor fixes needed to keep a property in good working condition. Calculation:Assumes 5% of gross rental income. Varies by property age and condition. | 5% | -$160 | -$1,920 |
Capital ExpensesLarge, infrequent costs for major improvements or replacements, like a new roof, HVAC system, or appliances. Calculation:Assumes 5% of gross rental income. Varies by property age. | 5% | -$160 | -$1,920 |
HOA FeesRegular dues paid to a Homeowners Association for community maintenance, amenities, and management. Similar fees include: Condo Association Fees, Co-op Maintenance Fees, etc. | 8% | -$256 | -$3,072 |
Operating ExpensesRecurring costs required to maintain and manage a rental property, including property taxes, insurance, maintenance, repairs, utilities (if paid by the owner), property management fees, and other day-to-day expenses. Calculation:Insurance + Property Taxes + Property Management + Repairs & Maintenance + Capital Expenditures + HOA Fees | 50% | -$1,597 | -$19,168 |
Cash Flow
| Monthly | Yearly | |
|---|---|---|
Net Operating Income (NOI)The income generated from a property after deducting all operating expenses but before deducting mortgage payments, taxes, and capital expenditures. Calculation:Gross Operating Income - Operating Expenses
Net operating income:
| $1,411 | $16,932 |
Mortgage PaymentThe fixed amount a borrower pays each month to repay a loan. It typically includes principal and interest (P&I) and may also cover property taxes, insurance, HOA fees, and PMI if escrowed. | -$2,228 | -$26,736 |
Cash FlowNet Operating Income (NOI) minus mortgage payments. Calculation:NOI - Mortgage Payments | $817 | $9,804 |