Lee County Investment Properties for Sale
Browse homes for sale and investment properties in Lee County. Refine your search by price, property type, or more.
Best cash flowing properties in Lee County
Active
$150,000
2
bds
|
2
ba
|
1,170
sqft
|
built
1968
1116 Broad St N, Lehigh Acres, FL 33936
$257
Cash flow
8.9%
Cash-on-Cash Return
8.2%
Cap rate
1.1%
Rent to Value Ratio
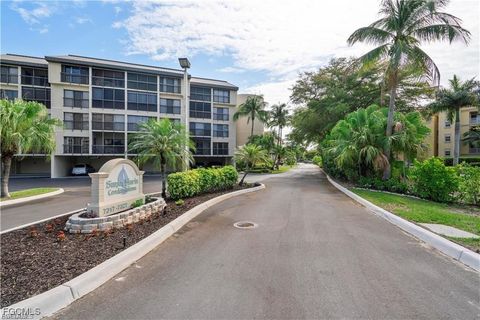
Active
$149,900
1
bds
|
1
ba
|
1,147
sqft
|
built
2009
1763 Concordia Lake Cir, Cape Coral, FL 33909
$50
Cash flow
1.7%
Cash-on-Cash Return
6.5%
Cap rate
1.0%
Rent to Value Ratio
7,000 out of 8,878 properties for sale in Lee County
Limited Results Shown
Create a free account, or log in to reveal all property listings and enjoy the complete experience.
Active
$330,000
3
bds
|
2
ba
|
2,023
sqft
|
built
1998
1403 SE 8th Pl, Cape Coral, FL 33990
$-96
Cash flow
-1.5%
Cash-on-Cash Return
5.8%
Cap rate
0.8%
Rent to Value Ratio
Active
$295,000
2
bds
|
2
ba
|
1,152
sqft
|
built
1980
1211 SE 35th St, Cape Coral, FL 33904
$-619
Cash flow
-10.9%
Cash-on-Cash Return
3.6%
Cap rate
0.6%
Rent to Value Ratio
Active
$675,000
5
bds
|
4
ba
|
3,659
sqft
|
built
2012
11120 Sparkleberry Dr, Fort Myers, FL 33913
$-2,042
Cash flow
-15.8%
Cash-on-Cash Return
2.5%
Cap rate
0.6%
Rent to Value Ratio
Active
$429,000
2
bds
|
2
ba
|
1,632
sqft
|
built
2020
11676 Solano Dr, Fort Myers, FL 33966
$-1,212
Cash flow
-14.7%
Cash-on-Cash Return
2.8%
Cap rate
0.6%
Rent to Value Ratio
Active
$500,000
2
bds
|
2
ba
|
2,169
sqft
|
built
1997
19319 Silver Oak Dr, Estero, FL 33967
$-1,434
Cash flow
-15.0%
Cash-on-Cash Return
2.7%
Cap rate
0.7%
Rent to Value Ratio
Active
$1,575,000
4
bds
|
3
ba
|
2,469
sqft
|
built
1983
3528 SE 17th Pl, Cape Coral, FL 33904
$-4,215
Cash flow
-14.0%
Cash-on-Cash Return
2.9%
Cap rate
0.5%
Rent to Value Ratio
Active
$285,000
3
bds
|
2
ba
|
1,763
sqft
|
built
1993
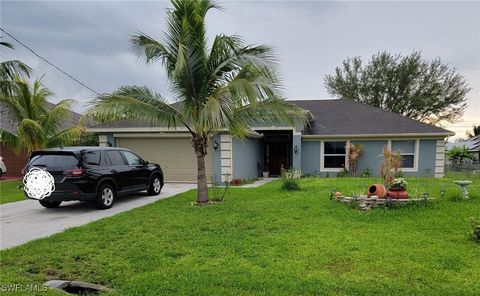
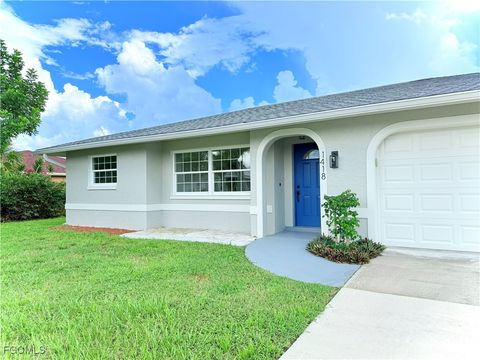
2680 Via Presidio, North Fort Myers, FL 33917
$-248
Cash flow
-4.5%
Cash-on-Cash Return
5.1%
Cap rate
0.9%
Rent to Value Ratio
Active
$126,000
1
bds
|
1
ba
|
512
sqft
|
built
1981
8101 Country Rd, Fort Myers, FL 33919
$-174
Cash flow
-7.2%
Cash-on-Cash Return
4.5%
Cap rate
1.1%
Rent to Value Ratio
Active
$324,900
3
bds
|
2
ba
|
1,998
sqft
|
built
2017
3351 Banyon Hollow Loop, North Fort Myers, FL 33903
$-807
Cash flow
-13.0%
Cash-on-Cash Return
3.2%
Cap rate
0.8%
Rent to Value Ratio
Active
$520,000
3
bds
|
3
ba
|
2,350
sqft
|
built
2007
11945 Country Day Cir, Fort Myers, FL 33913
$-1,043
Cash flow
-10.5%
Cash-on-Cash Return
3.7%
Cap rate
0.6%
Rent to Value Ratio
Active
$659,000
3
bds
|
2
ba
|
1,829
sqft
|
built
2023
9 NW 8th Ter, Cape Coral, FL 33993
$-1,345
Cash flow
-10.6%
Cash-on-Cash Return
3.7%
Cap rate
0.6%
Rent to Value Ratio
Active
$650,000
4
bds
|
3
ba
|
2,337
sqft
|
built
1978
1104 SE 16th Ter, Cape Coral, FL 33990
$-1,854
Cash flow
-14.9%
Cash-on-Cash Return
2.7%
Cap rate
0.5%
Rent to Value Ratio
Active
$189,900
2
bds
|
2
ba
|
1,260
sqft
|
built
1979
5572 Malt Dr, Fort Myers, FL 33907
$-355
Cash flow
-9.8%
Cash-on-Cash Return
3.9%
Cap rate
0.7%
Rent to Value Ratio
Active
$389,900
4
bds
|
8
ba
|
0
sqft
|
built
2005
2405 Mansfield Ave S, Lehigh Acres, FL 33973
$-1,172
Cash flow
-15.7%
Cash-on-Cash Return
2.5%
Cap rate
0.4%
Rent to Value Ratio
Active
$320,500
4
bds
|
2
ba
|
1,757
sqft
|
built
2006
423 Windermere Dr, Lehigh Acres, FL 33972
$-514
Cash flow
-8.4%
Cash-on-Cash Return
4.2%
Cap rate
0.6%
Rent to Value Ratio
Active
$895,000
3
bds
|
3
ba
|
3,087
sqft
|
built
1954
3209 W Riverside Dr, Fort Myers, FL 33901
$-611
Cash flow
-3.6%
Cash-on-Cash Return
5.3%
Cap rate
0.7%
Rent to Value Ratio
Active
$434,900
4
bds
|
2
ba
|
1,810
sqft
|
built
2004
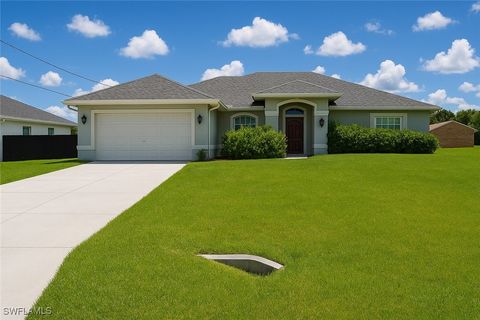
535 Durion Dr, Lehigh Acres, FL 33974
$-640
Cash flow
-7.7%
Cash-on-Cash Return
4.4%
Cap rate
0.6%
Rent to Value Ratio
Active
$189,000
2
bds
|
2
ba
|
896
sqft
|
built
1979
5832 Vancouver Cir, Fort Myers, FL 33907
$47
Cash flow
1.3%
Cash-on-Cash Return
6.4%
Cap rate
0.9%
Rent to Value Ratio
Active
$249,900
2
bds
|
2
ba
|
1,210
sqft
|
built
1999
14550 Daffodil Dr, Fort Myers, FL 33919
$-262
Cash flow
-5.5%
Cash-on-Cash Return
4.9%
Cap rate
0.7%
Rent to Value Ratio
Active
$299,900
3
bds
|
2
ba
|
1,350
sqft
|
built
1963
2207 Woodland Blvd, Fort Myers, FL 33907
$-450
Cash flow
-7.8%
Cash-on-Cash Return
4.3%
Cap rate
0.7%
Rent to Value Ratio
Active
$275,000
3
bds
|
2
ba
|
1,166
sqft
|
built
1964
314 SE 47th Ter, Cape Coral, FL 33904
$-363
Cash flow
-6.9%
Cash-on-Cash Return
4.6%
Cap rate
0.7%
Rent to Value Ratio
Active
$335,000
3
bds
|
2
ba
|
1,578
sqft
|
built
2013
11074 Lancewood St, Fort Myers, FL 33913
$-739
Cash flow
-11.5%
Cash-on-Cash Return
3.5%
Cap rate
0.8%
Rent to Value Ratio
Active
$469,900
6
bds
|
4
ba
|
0
sqft
|
built
2004
4438 28th St SW, Lehigh Acres, FL 33973
$-1,662
Cash flow
-18.5%
Cash-on-Cash Return
1.9%
Cap rate
0.3%
Rent to Value Ratio
Active
$350,000
3
bds
|
2
ba
|
1,258
sqft
|
built
2003
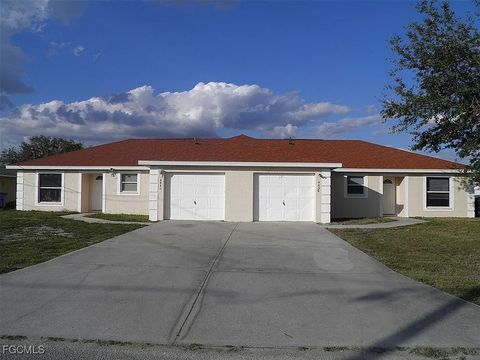
329 NE 27th St, Cape Coral, FL 33909
$-707
Cash flow
-10.5%
Cash-on-Cash Return
3.7%
Cap rate
0.6%
Rent to Value Ratio
Active
$525,000
3
bds
|
2
ba
|
2,142
sqft
|
built
1993
9548 Mariners Cove Ln, Fort Myers, FL 33919
$-584
Cash flow
-5.8%
Cash-on-Cash Return
4.8%
Cap rate
0.7%
Rent to Value Ratio
Active
$377,000
3
bds
|
2
ba
|
1,563
sqft
|
built
2020
2907 Donald Ave S, Lehigh Acres, FL 33976
$-439
Cash flow
-6.1%
Cash-on-Cash Return
4.7%
Cap rate
0.7%
Rent to Value Ratio
Active
$331,900
3
bds
|
2
ba
|
1,640
sqft
|
built
1979
1418 SE 26th St, Cape Coral, FL 33904
$-973
Cash flow
-15.3%
Cash-on-Cash Return
2.6%
Cap rate
0.5%
Rent to Value Ratio

Active
$389,900
3
bds
|
2
ba
|
1,655
sqft
|
built
2023
1925 NW 15th Ter, Cape Coral, FL 33993
$-858
Cash flow
-11.5%
Cash-on-Cash Return
3.5%
Cap rate
0.6%
Rent to Value Ratio
Active
$358,000
3
bds
|
2
ba
|
1,852
sqft
|
built
2022
1909 Richland Ave, Lehigh Acres, FL 33972
$-391
Cash flow
-5.7%
Cash-on-Cash Return
4.8%
Cap rate
0.7%
Rent to Value Ratio
Active
$369,900
3
bds
|
2
ba
|
1,695
sqft
|
built
2004
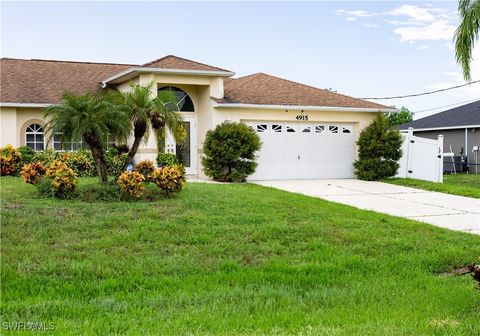
4915 Bywood St, Lehigh Acres, FL 33971
$-484
Cash flow
-6.8%
Cash-on-Cash Return
4.6%
Cap rate
0.6%
Rent to Value Ratio
Active
$479,900
4
bds
|
3
ba
|
2,032
sqft
|
built
2011
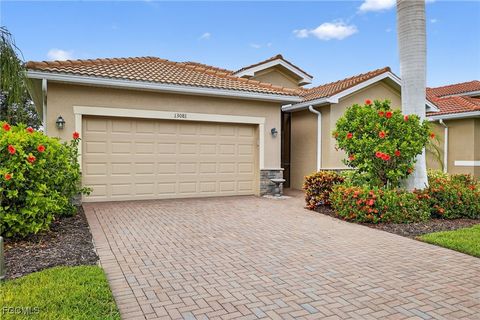
13081 Silver Thorn Loop, North Fort Myers, FL 33903
$-1,211
Cash flow
-13.2%
Cash-on-Cash Return
3.1%
Cap rate
0.6%
Rent to Value Ratio
Active
$349,900
2
bds
|
2
ba
|
1,220
sqft
|
built
1984
9288 Oak Bridge Ct, Fort Myers, FL 33967
$-205
Cash flow
-3.1%
Cash-on-Cash Return
5.4%
Cap rate
0.7%
Rent to Value Ratio
Active
$254,999
3
bds
|
2
ba
|
1,279
sqft
|
built
1991
13171 Whitehaven Ln, Fort Myers, FL 33966
$-432
Cash flow
-8.8%
Cash-on-Cash Return
4.1%
Cap rate
0.7%
Rent to Value Ratio
Active
$274,900
3
bds
|
2
ba
|
1,337
sqft
|
built
2005
5450 Park Rd, Fort Myers, FL 33908
$28
Cash flow
0.5%
Cash-on-Cash Return
6.3%
Cap rate
0.8%
Rent to Value Ratio
Active
$449,900
4
bds
|
3
ba
|
2,878
sqft
|
built
2004
12761 Ivory Stone Loop, Fort Myers, FL 33913
$-474
Cash flow
-5.5%
Cash-on-Cash Return
4.9%
Cap rate
0.8%
Rent to Value Ratio
Active
$598,999
3
bds
|
2
ba
|
2,073
sqft
|
built
1987
2807 Country Club Blvd, Cape Coral, FL 33904
$-1,004
Cash flow
-8.7%
Cash-on-Cash Return
4.1%
Cap rate
0.7%
Rent to Value Ratio
Active
$405,000
2
bds
|
3
ba
|
1,097
sqft
|
built
1984
7307 Estero Blvd, Fort Myers Beach, FL 33931
$-839
Cash flow
-10.8%
Cash-on-Cash Return
3.7%
Cap rate
0.6%
Rent to Value Ratio
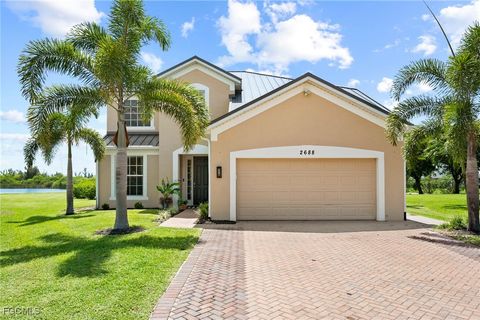
Active
$570,000
4
bds
|
3
ba
|
2,790
sqft
|
built
2006
2688 Bellingham Ct, Cape Coral, FL 33991
$-1,316
Cash flow
-12.0%
Cash-on-Cash Return
3.4%
Cap rate
0.6%
Rent to Value Ratio