Palm Beach County Investment Properties for Sale
Browse homes for sale and investment properties in Palm Beach County. Refine your search by price, property type, or more.
Best cash flowing properties in Palm Beach County
Active
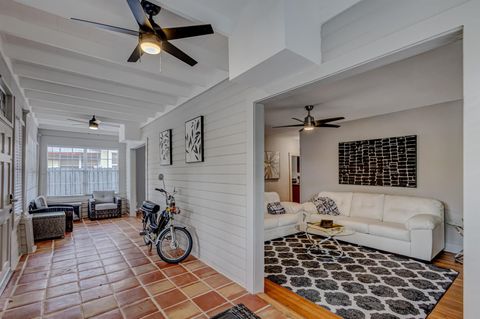
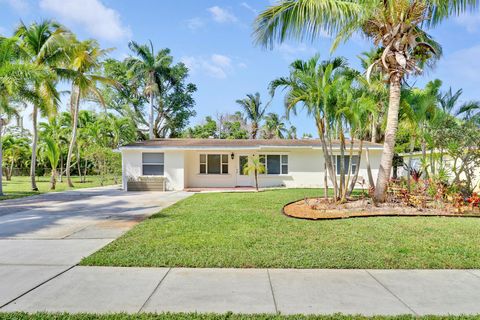
$995,000
5
bds
|
5
ba
|
2,561
sqft
|
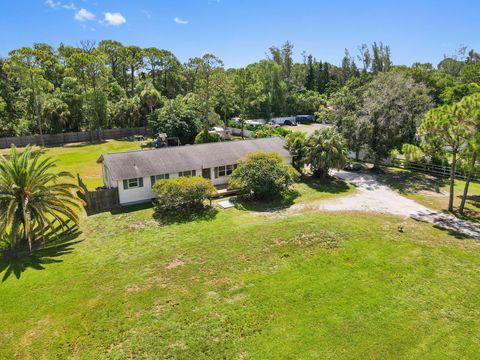
built
1921
421 51st St, West Palm Beach, FL 33407
$707
Cash flow
3.7%
Cash-on-Cash Return
7.0%
Cap rate
1.0%
Rent to Value Ratio
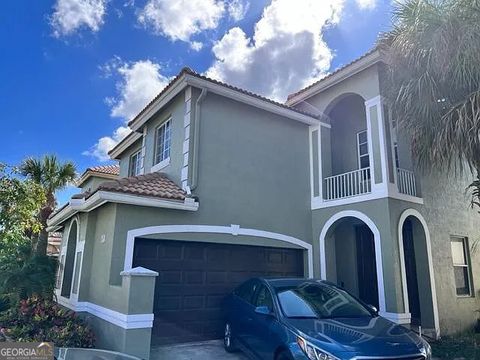
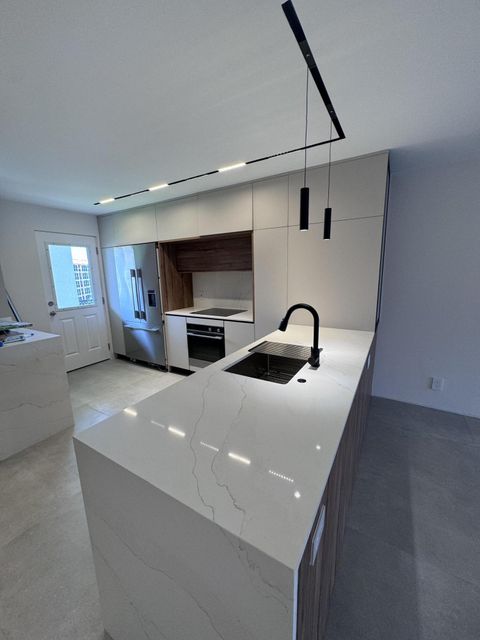
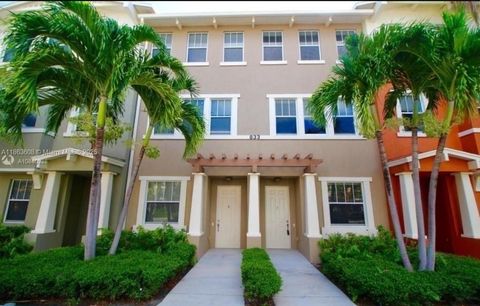
Active
$290,000
3
bds
|
2.5
ba
|
2,561
sqft
|
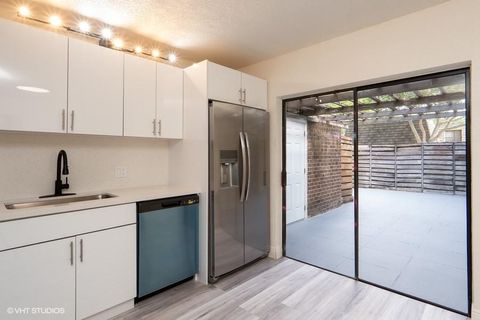
built
2001
4078 Coontie Ct, Lake Worth, FL 33462
$299
Cash flow
5.4%
Cash-on-Cash Return
7.4%
Cap rate
1.2%
Rent to Value Ratio
5,002 out of 8,263 properties for sale in Palm Beach County
Limited Results Shown
Create a free account, or log in to reveal all property listings and enjoy the complete experience.
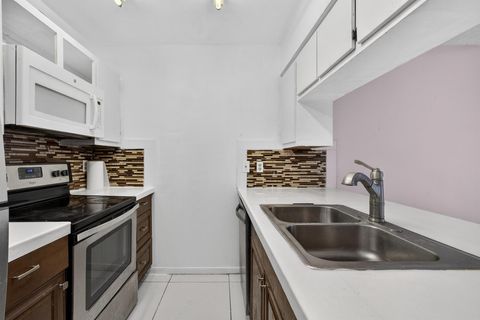
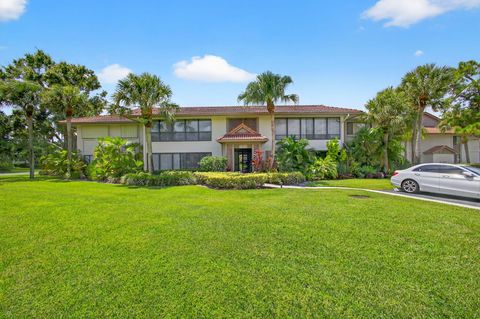
Active
$224,000
2
bds
|
2
ba
|
1,284
sqft
|
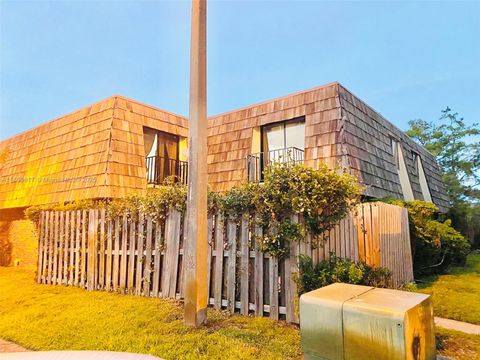
built
1983
2089 E Bond Dr, West Palm Beach, FL 33415
$-274
Cash flow
-6.4%
Cash-on-Cash Return
4.7%
Cap rate
1.0%
Rent to Value Ratio
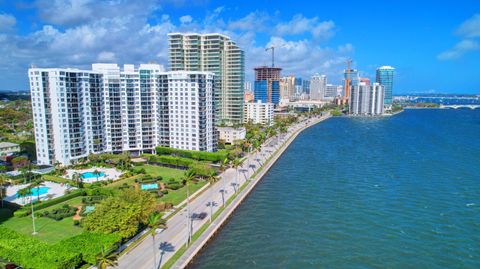
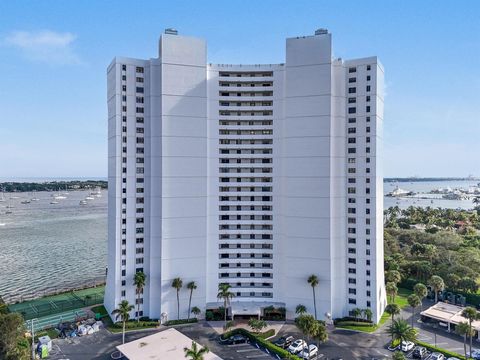
Active
$799,000
2
bds
|
2
ba
|
1,350
sqft
|
built
1973
1701 S Flagler Dr, West Palm Beach, FL 33401
$-2,895
Cash flow
-18.9%
Cash-on-Cash Return
1.8%
Cap rate
0.7%
Rent to Value Ratio
Active
$525,000
3
bds
|
2
ba
|
1,623
sqft
|
built
1954
2601 Conroy Dr, Lake Park, FL 33403
$-560
Cash flow
-5.6%
Cash-on-Cash Return
4.9%
Cap rate
0.7%
Rent to Value Ratio
Active
$649,000
2
bds
|
2
ba
|
958
sqft
|
built
1967
2871 N Ocean Blvd, Boca Raton, FL 33431
$-2,470
Cash flow
-19.9%
Cash-on-Cash Return
1.6%
Cap rate
0.5%
Rent to Value Ratio
Active
$1,200,000
2
bds
|
2
ba
|
1,210
sqft
|
built
1952
210 Seville Rd, West Palm Beach, FL 33405
$-3,646
Cash flow
-15.9%
Cash-on-Cash Return
2.5%
Cap rate
0.3%
Rent to Value Ratio
Active
$359,000
2
bds
|
2
ba
|
1,268
sqft
|
built
1985
1100 Duncan Cir, Palm Beach Gardens, FL 33418
$-849
Cash flow
-12.3%
Cash-on-Cash Return
3.3%
Cap rate
0.9%
Rent to Value Ratio
Active
$1,240,000
3
bds
|
3
ba
|
1,893
sqft
|
built
1985
176 Helios Dr, Jupiter, FL 33477
$-3,392
Cash flow
-14.3%
Cash-on-Cash Return
2.9%
Cap rate
0.6%
Rent to Value Ratio
Active
$839,000
4
bds
|
3
ba
|
2,618
sqft
|
built
1979
6180 Celadon Cir, West Palm Beach, FL 33418
$-2,125
Cash flow
-13.2%
Cash-on-Cash Return
3.1%
Cap rate
0.7%
Rent to Value Ratio
Active
$389,000
4
bds
|
3
ba
|
1,826
sqft
|
built
2003
2310 Shoma Ln, Royal Palm Beach, FL 33414
$-967
Cash flow
-13.0%
Cash-on-Cash Return
3.2%
Cap rate
0.7%
Rent to Value Ratio
Active
$1,720,000
4
bds
|
3
ba
|
2,206
sqft
|
built
1951
228 Santa Lucia Dr, West Palm Beach, FL 33405
$-4,376
Cash flow
-13.3%
Cash-on-Cash Return
3.1%
Cap rate
0.4%
Rent to Value Ratio
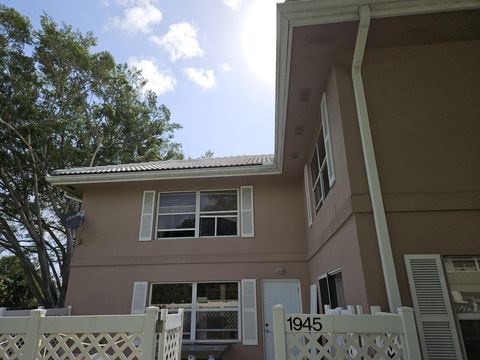
Active
$335,000
2
bds
|
3
ba
|
1,350
sqft
|
built
1989
1945 Stratford Way, West Palm Beach, FL 33409
$-964
Cash flow
-15.0%
Cash-on-Cash Return
2.7%
Cap rate
0.7%
Rent to Value Ratio
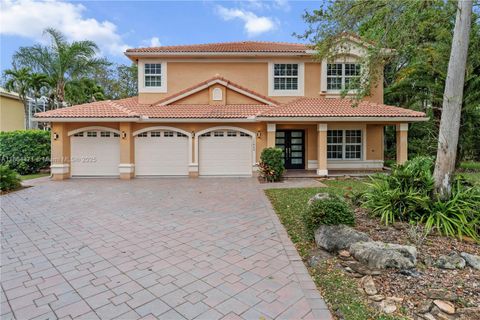
Active
$1,299,000
5
bds
|
3
ba
|
3,495
sqft
|
built
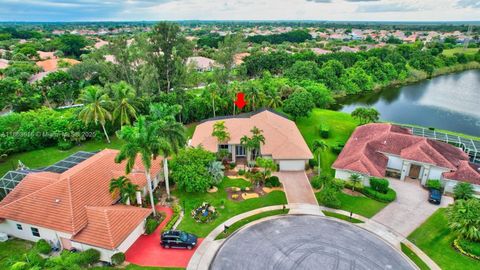
1996
15643 Cypress Park Dr, Wellington, FL 33414
$-2,579
Cash flow
-10.4%
Cash-on-Cash Return
3.8%
Cap rate
0.6%
Rent to Value Ratio
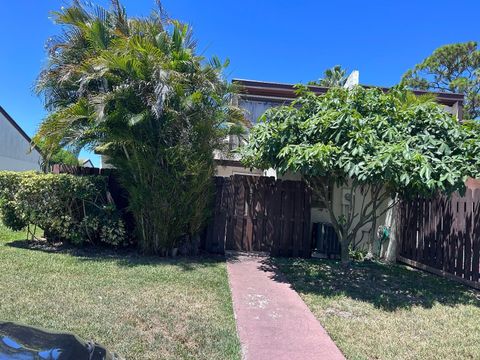
Active
$279,900
2
bds
|
2
ba
|
1,073
sqft
|
built
1981
1871 Abbey Rd, West Palm Beach, FL 33415
$-467
Cash flow
-8.7%
Cash-on-Cash Return
4.1%
Cap rate
0.8%
Rent to Value Ratio
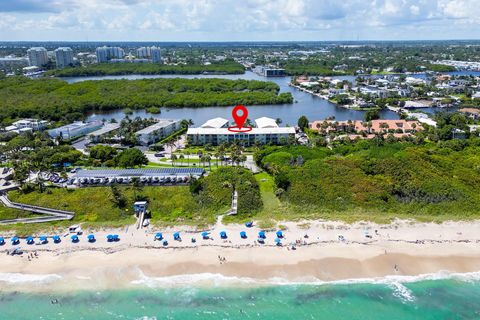
Active
$597,000
2
bds
|
2
ba
|
975
sqft
|
built
1968
6530 N Ocean Blvd, Ocean Ridge, FL 33435
$-1,338
Cash flow
-11.7%
Cash-on-Cash Return
3.5%
Cap rate
0.7%
Rent to Value Ratio
Active
$2,750,000
5
bds
|
4
ba
|
3,596
sqft
|
built
1994
5371 Cougars Prowl, Wellington, FL 33449
$-8,267
Cash flow
-15.7%
Cash-on-Cash Return
2.5%
Cap rate
0.4%
Rent to Value Ratio
Active
$529,900
3
bds
|
2
ba
|
1,456
sqft
|
built
1971
1204 Wynnewood Dr, West Palm Beach, FL 33417
$-940
Cash flow
-9.3%
Cash-on-Cash Return
4.0%
Cap rate
0.5%
Rent to Value Ratio
Active
$346,900
2
bds
|
3
ba
|
1,448
sqft
|
built
2006
1740 San Benito Way, West Palm Beach, FL 33401
$-668
Cash flow
-10.0%
Cash-on-Cash Return
3.8%
Cap rate
0.9%
Rent to Value Ratio
Active
$295,000
2
bds
|
2
ba
|
1,042
sqft
|
built
1975
3050 Presidential Way, West Palm Beach, FL 33401
$-969
Cash flow
-17.1%
Cash-on-Cash Return
2.2%
Cap rate
0.7%
Rent to Value Ratio
Active
$1,300,000
3
bds
|
3
ba
|
2,866
sqft
|
built
1997
13006 Arrowwood Dr, West Palm Beach, FL 33418
$-2,733
Cash flow
-11.0%
Cash-on-Cash Return
3.6%
Cap rate
0.5%
Rent to Value Ratio
Active
$490,000
3
bds
|
2
ba
|
1,250
sqft
|
built
1971
1362 Berkshire Dr, West Palm Beach, FL 33406
$-520
Cash flow
-5.5%
Cash-on-Cash Return
4.9%
Cap rate
0.6%
Rent to Value Ratio
Active
$579,900
3
bds
|
2
ba
|
1,988
sqft
|
built
1997
2665 Kittbuck Way, West Palm Beach, FL 33411
$-1,380
Cash flow
-12.4%
Cash-on-Cash Return
3.3%
Cap rate
0.6%
Rent to Value Ratio
Active
$1,425,000
4
bds
|
4
ba
|
3,350
sqft
|
built
2003
10445 Terra Lago Dr, West Palm Beach, FL 33412
$-5,232
Cash flow
-19.2%
Cash-on-Cash Return
1.7%
Cap rate
0.4%
Rent to Value Ratio
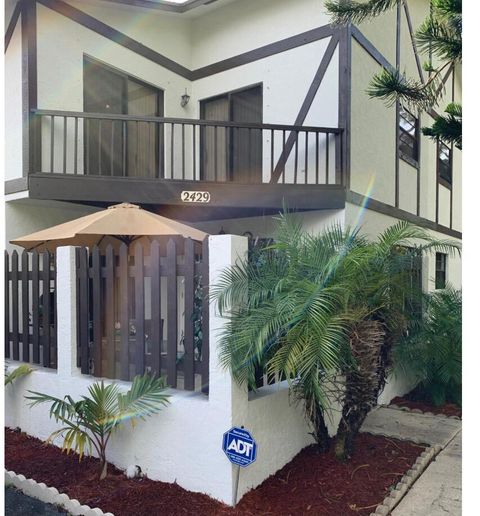
Active
$270,000
2
bds
|
3
ba
|
1,192
sqft
|
built
1986
2429 Lena Ln, West Palm Beach, FL 33415
$-423
Cash flow
-8.2%
Cash-on-Cash Return
4.3%
Cap rate
0.8%
Rent to Value Ratio
Active
$699,900
5
bds
|
3
ba
|
2,888
sqft
|
built
2004
2626 Sawyer Ter, Wellington, FL 33414
$-1,706
Cash flow
-12.7%
Cash-on-Cash Return
3.2%
Cap rate
0.6%
Rent to Value Ratio
Active
$2,125,500
3
bds
|
4
ba
|
3,162
sqft
|
built
2020
13689 Artisan Cir, Palm Beach Gardens, FL 33418
$-6,161
Cash flow
-15.1%
Cash-on-Cash Return
2.7%
Cap rate
0.5%
Rent to Value Ratio
Active
$489,000
2
bds
|
2
ba
|
1,148
sqft
|
built
2003
616 Clearwater Park Rd, West Palm Beach, FL 33401
$-1,898
Cash flow
-20.3%
Cash-on-Cash Return
1.5%
Cap rate
0.6%
Rent to Value Ratio
Active
$310,000
3
bds
|
3
ba
|
1,326
sqft
|
built
2006
833 Millbrae Ct, West Palm Beach, FL 33401
$-918
Cash flow
-15.5%
Cash-on-Cash Return
2.6%
Cap rate
0.9%
Rent to Value Ratio
Active
$1,799,999
5
bds
|
5
ba
|
4,708
sqft
|
built
2006
647 Edgebrook Ln, West Palm Beach, FL 33411
$-5,311
Cash flow
-15.4%
Cash-on-Cash Return
2.6%
Cap rate
0.5%
Rent to Value Ratio
Active
$430,000
2
bds
|
2
ba
|
1,235
sqft
|
built
1974
5200 N Flagler Dr, West Palm Beach, FL 33407
$-1,756
Cash flow
-21.3%
Cash-on-Cash Return
1.2%
Cap rate
0.7%
Rent to Value Ratio
Active
$799,000
3
bds
|
2
ba
|
1,934
sqft
|
built
1982
13692 Crosspointe Dr, West Palm Beach, FL 33418
$-2,434
Cash flow
-15.9%
Cash-on-Cash Return
2.5%
Cap rate
0.5%
Rent to Value Ratio

Active
$279,000
3
bds
|
2
ba
|
1,120
sqft
|
built
1981
4648 Summit Blvd, West Palm Beach, FL 33415
$-570
Cash flow
-10.7%
Cash-on-Cash Return
3.7%
Cap rate
0.8%
Rent to Value Ratio
Active
$1,025,000
3
bds
|
3
ba
|
2,752
sqft
|
built
1992
17969 Fairoaks Way, Boca Raton, FL 33498
$-743
Cash flow
-3.8%
Cash-on-Cash Return
5.3%
Cap rate
0.8%
Rent to Value Ratio
Active
$515,000
3
bds
|
2
ba
|
1,056
sqft
|
built
1984
4872 126th Dr N, West Palm Beach, FL 33411
$-859
Cash flow
-8.7%
Cash-on-Cash Return
4.1%
Cap rate
0.6%
Rent to Value Ratio
Active
$357,500
3
bds
|
3
ba
|
1,488
sqft
|
built
1980
1424 14th Ter, Palm Beach Gardens, FL 33418
$0
Cash flow
n/a
Cash-on-Cash Return
n/a
Cap rate
n/a
Rent to Value Ratio
Active
$350,000
3
bds
|
3
ba
|
1,694
sqft
|
built
1980
1705 Forest Lakes Cir, West Palm Beach, FL 33406
$-647
Cash flow
-9.6%
Cash-on-Cash Return
3.9%
Cap rate
0.8%
Rent to Value Ratio
Active
$599,990
4
bds
|
2
ba
|
1,764
sqft
|
built
1987
10687 Katmandu Ct, Boynton Beach, FL 33437
$-1,038
Cash flow
-9.0%
Cash-on-Cash Return
4.1%
Cap rate
0.6%
Rent to Value Ratio
Active
$700,000
3
bds
|
3
ba
|
2,564
sqft
|
built
1995
6450 Brava Way, Boca Raton, FL 33433
$-1,373
Cash flow
-10.2%
Cash-on-Cash Return
3.8%
Cap rate
0.7%
Rent to Value Ratio
Active
$255,000
2
bds
|
2
ba
|
1,106
sqft
|
built
1984
1103 Green Pine Blvd, West Palm Beach, FL 33409
$-860
Cash flow
-17.6%
Cash-on-Cash Return
2.1%
Cap rate
0.8%
Rent to Value Ratio