Miami Dade County Investment Properties for Sale
Browse homes for sale and investment properties in Miami Dade County. Refine your search by price, property type, or more.
Best cash flowing properties in Miami Dade County

Active
$135,000
1
bds
|
1
ba
|
840
sqft
|
built
1972
15600 NW 7th Ave, Miami, FL 33169
$-116
Cash flow
-4.5%
Cash-on-Cash Return
5.1%
Cap rate
1.2%
Rent to Value Ratio
Active
$250,000
2
bds
|
1
ba
|
998
sqft
|
built
1973
1890 W 56th St, Hialeah, FL 33012
$-361
Cash flow
-7.5%
Cash-on-Cash Return
4.4%
Cap rate
0.9%
Rent to Value Ratio
9,870 out of 11,316 properties for sale in Miami Dade County
Limited Results Shown
Create a free account, or log in to reveal all property listings and enjoy the complete experience.

Active
$2,395,000
3
bds
|
4
ba
|
2,018
sqft
|
built
2018
488 NE 18th St, Miami, FL 33132
$-9,699
Cash flow
-21.1%
Cash-on-Cash Return
1.3%
Cap rate
0.4%
Rent to Value Ratio
Active
$610,000
4
bds
|
3
ba
|
1,379
sqft
|
built
1957
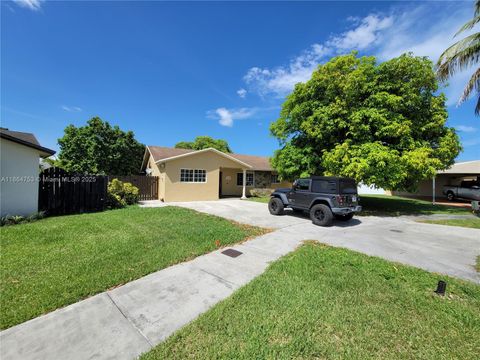
17940 NW 13th Ct, Miami Gardens, FL 33169
$-1,421
Cash flow
-12.2%
Cash-on-Cash Return
3.4%
Cap rate
0.5%
Rent to Value Ratio

Active
$529,999
4
bds
|
4
ba
|
1,710
sqft
|
built
2014
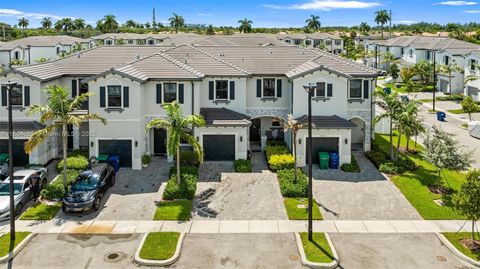
17473 SW 153rd Path, Miami, FL 33187
$-1,285
Cash flow
-12.6%
Cash-on-Cash Return
3.2%
Cap rate
0.6%
Rent to Value Ratio

Active
$265,000
2
bds
|
2
ba
|
1,123
sqft
|
built
1988
8660 SW 212th St, Cutler Bay, FL 33189
$-402
Cash flow
-7.9%
Cash-on-Cash Return
4.3%
Cap rate
0.9%
Rent to Value Ratio

Active
$249,999
2
bds
|
2
ba
|
936
sqft
|
built
1981
10825 SW 112th Ave, Miami, FL 33176
$-673
Cash flow
-14.0%
Cash-on-Cash Return
2.9%
Cap rate
0.8%
Rent to Value Ratio

Active
$820,000
4
bds
|
3
ba
|
2,080
sqft
|
built
1950
771 Swan Ave, Miami Springs, FL 33166
$-2,030
Cash flow
-12.9%
Cash-on-Cash Return
3.2%
Cap rate
0.5%
Rent to Value Ratio

Active
$899,900
4
bds
|
4
ba
|
2,663
sqft
|
built
2002
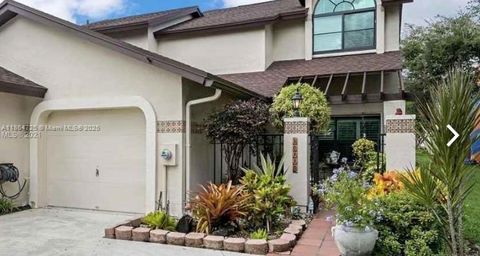
14241 SW 129th Ct, Miami, FL 33186
$-2,493
Cash flow
-14.5%
Cash-on-Cash Return
2.8%
Cap rate
0.5%
Rent to Value Ratio

Active
$725,000
4
bds
|
2
ba
|
1,956
sqft
|
built
1947
561 NW 53rd St, Miami, FL 33127
$-1,438
Cash flow
-10.3%
Cash-on-Cash Return
3.8%
Cap rate
0.5%
Rent to Value Ratio

Active
$539,000
3
bds
|
2
ba
|
1,314
sqft
|
built
1956
2250 NW 95th St, Miami, FL 33147
$-1,488
Cash flow
-14.4%
Cash-on-Cash Return
2.8%
Cap rate
0.5%
Rent to Value Ratio

Active
$214,999
1
bds
|
2
ba
|
855
sqft
|
built
1972
2150 Sans Souci Blvd, North Miami, FL 33181
$-580
Cash flow
-14.1%
Cash-on-Cash Return
2.9%
Cap rate
0.9%
Rent to Value Ratio

Active
$459,000
3
bds
|
2
ba
|
664
sqft
|
built
1940
741 NW 77th Ter, Miami, FL 33150
$-1,102
Cash flow
-12.5%
Cash-on-Cash Return
3.3%
Cap rate
0.5%
Rent to Value Ratio

Active
$589,000
2
bds
|
2
ba
|
1,718
sqft
|
built
1980
20305 NE 10th Ct, Miami, FL 33179
$-1,389
Cash flow
-12.3%
Cash-on-Cash Return
3.3%
Cap rate
0.6%
Rent to Value Ratio
Active
$2,600,000
4
bds
|
3
ba
|
2,415
sqft
|
built
1949
5211 Granada Blvd, Coral Gables, FL 33146
$-9,080
Cash flow
-18.2%
Cash-on-Cash Return
2.0%
Cap rate
0.3%
Rent to Value Ratio
Active
$1,250,000
2
bds
|
3
ba
|
1,936
sqft
|
built
1983
20191 E Country Club Dr, Aventura, FL 33180
$-4,280
Cash flow
-17.9%
Cash-on-Cash Return
2.0%
Cap rate
0.5%
Rent to Value Ratio

Active
$745,000
4
bds
|
2
ba
|
1,542
sqft
|
built
1976
9614 SW 134th Ct, Miami, FL 33186
$-1,276
Cash flow
-8.9%
Cash-on-Cash Return
4.1%
Cap rate
0.7%
Rent to Value Ratio
Active
$575,000
2
bds
|
2
ba
|
1,362
sqft
|
built
1968
5750 Collins Ave, Miami Beach, FL 33140
$-1,831
Cash flow
-16.6%
Cash-on-Cash Return
2.3%
Cap rate
0.6%
Rent to Value Ratio
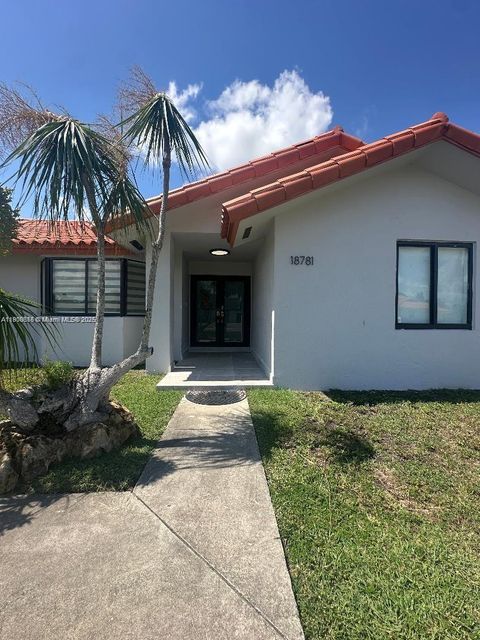
Active
$780,000
4
bds
|
2
ba
|
2,086
sqft
|
built
1993
18781 SW 294th Ter, Homestead, FL 33030
$-1,614
Cash flow
-10.8%
Cash-on-Cash Return
3.7%
Cap rate
0.6%
Rent to Value Ratio

Active
$775,000
2
bds
|
3
ba
|
1,368
sqft
|
built
2008
1060 Brickell Ave, Miami, FL 33131
$-3,016
Cash flow
-20.3%
Cash-on-Cash Return
1.5%
Cap rate
0.6%
Rent to Value Ratio
Active
$819,000
2
bds
|
2
ba
|
1,904
sqft
|
built
1979
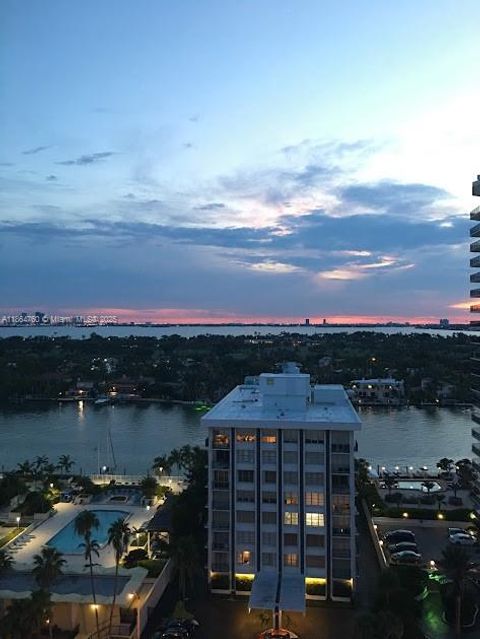
19707 Turnberry Way, Aventura, FL 33180
$-2,342
Cash flow
-14.9%
Cash-on-Cash Return
2.7%
Cap rate
0.9%
Rent to Value Ratio
Active
$389,000
2
bds
|
2
ba
|
1,048
sqft
|
built
2016
7865 NW 104th Ave, Doral, FL 33178
$-1,518
Cash flow
-20.4%
Cash-on-Cash Return
1.5%
Cap rate
0.7%
Rent to Value Ratio

Active
$255,000
2
bds
|
2
ba
|
1,081
sqft
|
built
1971
3475 N Country Club Dr, Miami, FL 33180
$-614
Cash flow
-12.6%
Cash-on-Cash Return
3.3%
Cap rate
1.1%
Rent to Value Ratio

Active
$725,000
2
bds
|
2
ba
|
1,661
sqft
|
built
1975
1901 Brickell Ave, Miami, FL 33129
$-2,296
Cash flow
-16.5%
Cash-on-Cash Return
2.3%
Cap rate
0.7%
Rent to Value Ratio
Active
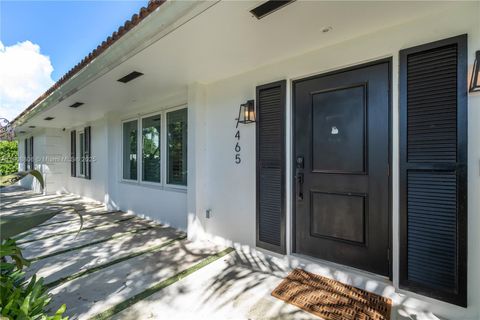
$1,260,000
3
bds
|
3
ba
|
1,970
sqft
|
built
1971
7465 SW 163rd St, Palmetto Bay, FL 33157
$-2,685
Cash flow
-11.1%
Cash-on-Cash Return
3.6%
Cap rate
0.6%
Rent to Value Ratio
Active
$8,900,000
3
bds
|
4
ba
|
3,884
sqft
|
built
2011
9705 Collins Ave, Bal Harbour, FL 33154
$-66,411
Cash flow
-38.9%
Cash-on-Cash Return
-2.8%
Cap rate
0.1%
Rent to Value Ratio

Active
$1,980,000
3
bds
|
2
ba
|
0
sqft
|
built
1960
2010 NE 196th Ter, North Miami Beach, FL 33179
$-9,240
Cash flow
-24.3%
Cash-on-Cash Return
0.5%
Cap rate
0.2%
Rent to Value Ratio

Active
$530,000
3
bds
|
2
ba
|
1,328
sqft
|
built
1983
20000 SW 114th Ave, Miami, FL 33189
$-683
Cash flow
-6.7%
Cash-on-Cash Return
4.6%
Cap rate
0.7%
Rent to Value Ratio

Active
$679,000
3
bds
|
3
ba
|
2,014
sqft
|
built
1987
9933 NW 49th Ter, Doral, FL 33178
$-1,889
Cash flow
-14.5%
Cash-on-Cash Return
2.8%
Cap rate
0.6%
Rent to Value Ratio

Active
$537,000
3
bds
|
2
ba
|
1,710
sqft
|
built
2004
3086 SW 153rd Path, Miami, FL 33185
$-1,448
Cash flow
-14.1%
Cash-on-Cash Return
2.9%
Cap rate
0.6%
Rent to Value Ratio

Active
$1,095,000
3
bds
|
2
ba
|
1,884
sqft
|
built
1949
950 NE 113th St, Biscayne Park, FL 33161
$-5,386
Cash flow
-25.7%
Cash-on-Cash Return
0.2%
Cap rate
0.2%
Rent to Value Ratio
Active
$989,000
3
bds
|
3
ba
|
1,950
sqft
|
built
1966
10350 W Bay Harbor Dr, Bay Harbor Islands, FL 33154
$-2,167
Cash flow
-11.4%
Cash-on-Cash Return
3.5%
Cap rate
0.6%
Rent to Value Ratio
Active
$265,000
3
bds
|
2
ba
|
1,040
sqft
|
built
1980
8015 SW 107th Ave, Miami, FL 33173
$-543
Cash flow
-10.7%
Cash-on-Cash Return
3.7%
Cap rate
0.9%
Rent to Value Ratio
Active
$525,000
3
bds
|
2
ba
|
900
sqft
|
built
1946
1390 NE 150th St, Miami, FL 33161
$-736
Cash flow
-7.3%
Cash-on-Cash Return
4.5%
Cap rate
0.7%
Rent to Value Ratio
Active
$699,000
5
bds
|
2
ba
|
2,173
sqft
|
built
1987
11341 SW 163rd St, Miami, FL 33157
$-1,929
Cash flow
-14.4%
Cash-on-Cash Return
2.8%
Cap rate
0.5%
Rent to Value Ratio
Active
$550,000
1
bds
|
2
ba
|
930
sqft
|
built
1968
5601 Collins Ave, Miami Beach, FL 33140
$-2,067
Cash flow
-19.6%
Cash-on-Cash Return
1.6%
Cap rate
0.7%
Rent to Value Ratio
Active
$499,990
3
bds
|
3
ba
|
1,344
sqft
|
built
2022
20380 NW 5th Ct, Miami Gardens, FL 33169
$-1,298
Cash flow
-13.5%
Cash-on-Cash Return
3.0%
Cap rate
0.6%
Rent to Value Ratio
Active
$665,000
3
bds
|
2
ba
|
1,498
sqft
|
built
1948
6377 SW 15th St, West Miami, FL 33144
$-1,017
Cash flow
-8.0%
Cash-on-Cash Return
4.3%
Cap rate
0.5%
Rent to Value Ratio
Active
$625,000
3
bds
|
3
ba
|
1,819
sqft
|
built
1989
10110 SW 137th Ct, Miami, FL 33186
$-1,341
Cash flow
-11.2%
Cash-on-Cash Return
3.6%
Cap rate
0.5%
Rent to Value Ratio
Active
$1,090,000
bds
|
1
ba
|
526
sqft
|
built
2005
4401 Collins Ave, Miami Beach, FL 33140
$-4,725
Cash flow
-22.6%
Cash-on-Cash Return
0.9%
Cap rate
0.4%
Rent to Value Ratio