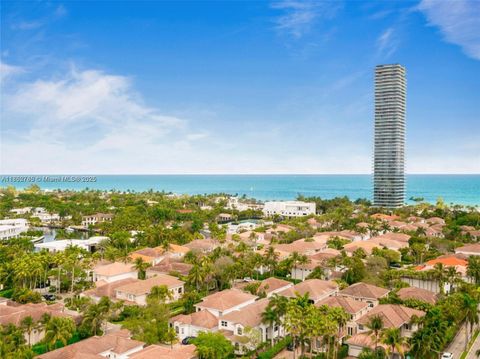
Miami Dade County Investment Properties for Sale
Browse homes for sale and investment properties in Miami Dade County. Refine your search by price, property type, or more.
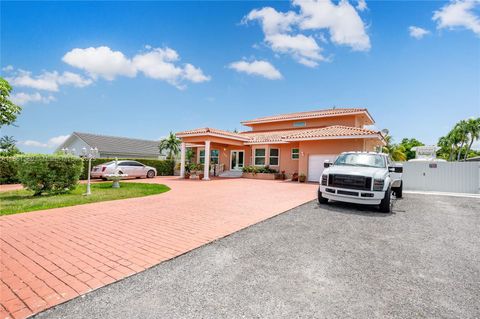
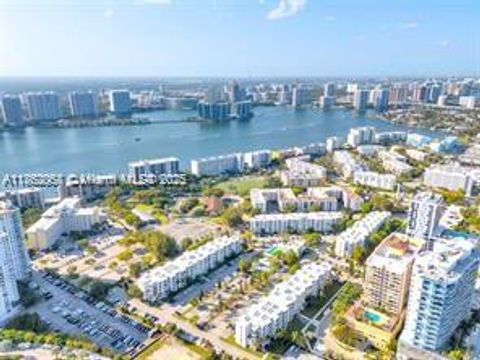
Best cash flowing properties in Miami Dade County

Active
$655,000
4
bds
|
3
ba
|
1,894
sqft
|
built
2006
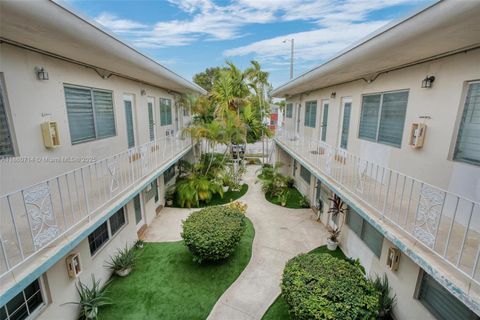
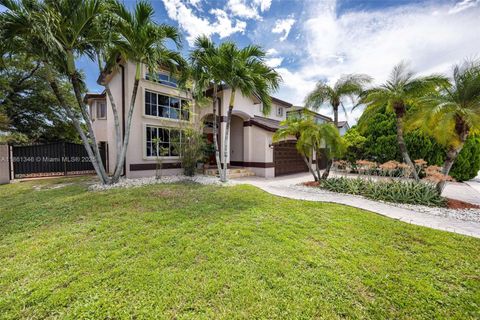
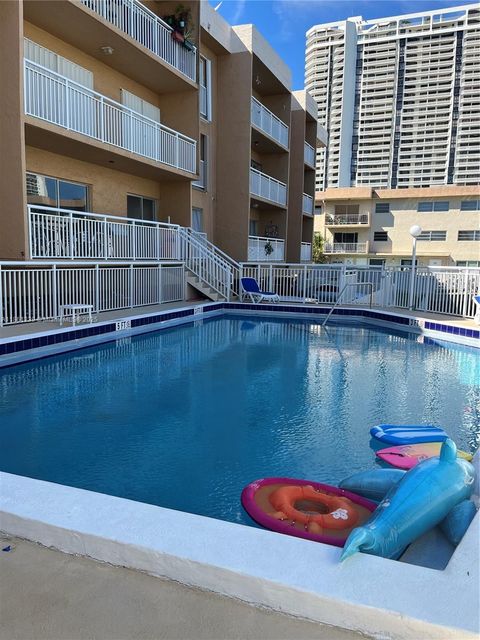
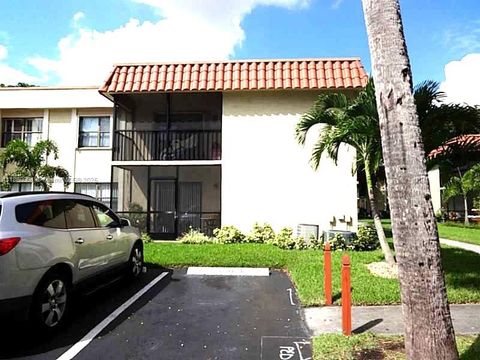
7869 NW 110 Ave, Doral, FL 33178
$0
Cash flow
n/a
Cash-on-Cash Return
n/a
Cap rate
n/a
Rent to Value Ratio
Active
$190,000
2
bds
|
2
ba
|
1,025
sqft
|
built
1963
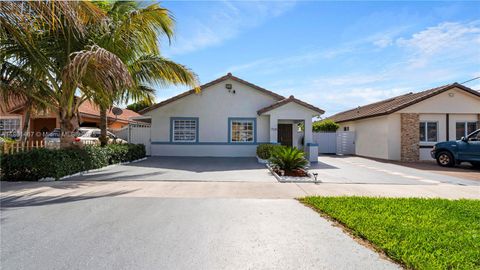
2072 NE 169th St, North Miami Beach, FL 33162
$-31
Cash flow
-0.9%
Cash-on-Cash Return
5.9%
Cap rate
1.2%
Rent to Value Ratio
10,000 out of 13,447 properties for sale in Miami Dade County
Limited Results Shown
Create a free account, or log in to reveal all property listings and enjoy the complete experience.
Active
$715,000
1
bds
|
2
ba
|
826
sqft
|
built
2004
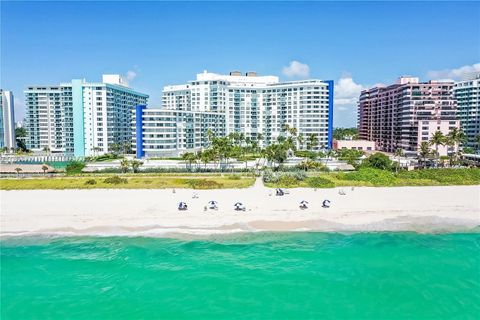
110 Washington Ave, Miami Beach, FL 33139
$-2,815
Cash flow
-20.5%
Cash-on-Cash Return
1.4%
Cap rate
0.5%
Rent to Value Ratio
Active
$459,000
3
bds
|
2
ba
|
1,236
sqft
|
built
2020
7905 NW 104th Ave, Doral, FL 33178
$-1,615
Cash flow
-18.4%
Cash-on-Cash Return
1.9%
Cap rate
0.6%
Rent to Value Ratio
Active
$405,000
2
bds
|
2
ba
|
1,000
sqft
|
built
1972
110 Salamanca Ave, Coral Gables, FL 33134
$-1,300
Cash flow
-16.7%
Cash-on-Cash Return
2.3%
Cap rate
0.7%
Rent to Value Ratio
Active
$415,000
1
bds
|
2
ba
|
1,000
sqft
|
built
1971
19390 Collins Ave, Sunny Isles Beach, FL 33160
$-961
Cash flow
-12.1%
Cash-on-Cash Return
3.4%
Cap rate
0.8%
Rent to Value Ratio

Active
$630,000
4
bds
|
2
ba
|
1,668
sqft
|
built
2001
13017 SW 143rd Ter, Miami, FL 33186
$-1,800
Cash flow
-14.9%
Cash-on-Cash Return
2.7%
Cap rate
0.6%
Rent to Value Ratio
Active
$1,150,000
3
bds
|
3
ba
|
2,068
sqft
|
built
2022
8211 NW 43rd Ter, Doral, FL 33166
$-2,123
Cash flow
-9.6%
Cash-on-Cash Return
3.9%
Cap rate
0.7%
Rent to Value Ratio

Active
$1,299,000
4
bds
|
2
ba
|
2,057
sqft
|
built
1975
12505 SW 99th Ave, Miami, FL 33176
$-3,636
Cash flow
-14.6%
Cash-on-Cash Return
2.8%
Cap rate
0.4%
Rent to Value Ratio
Active
$530,000
3
bds
|
1
ba
|
1,268
sqft
|
built
1940
9156 NW 5th Ave, Miami, FL 33150
$-1,350
Cash flow
-13.3%
Cash-on-Cash Return
3.1%
Cap rate
0.6%
Rent to Value Ratio

Active
$549,000
3
bds
|
3
ba
|
1,680
sqft
|
built
1972
7909 SW 105th Ave, Miami, FL 33173
$-1,040
Cash flow
-9.9%
Cash-on-Cash Return
3.9%
Cap rate
0.6%
Rent to Value Ratio

Active
$699,000
2
bds
|
2
ba
|
1,061
sqft
|
built
1960
1500 Bay Rd, Miami Beach, FL 33139
$-2,393
Cash flow
-17.9%
Cash-on-Cash Return
2.0%
Cap rate
0.6%
Rent to Value Ratio
Active
$1,455,000
4
bds
|
5
ba
|
2,718
sqft
|
built
1992
13926 SW 14th St, Miami, FL 33184
$-3,888
Cash flow
-13.9%
Cash-on-Cash Return
2.9%
Cap rate
0.4%
Rent to Value Ratio
Active
$257,777
1
bds
|
1
ba
|
536
sqft
|
built
1973
200 177th Dr, Sunny Isles Beach, FL 33160
$-712
Cash flow
-14.4%
Cash-on-Cash Return
2.8%
Cap rate
0.8%
Rent to Value Ratio
Active
$7,595,000
6
bds
|
6
ba
|
6,530
sqft
|
built
2020
6175 SW 128th St, Pinecrest, FL 33156
$-40,624
Cash flow
-27.9%
Cash-on-Cash Return
-0.3%
Cap rate
0.1%
Rent to Value Ratio

Active
$257,777
1
bds
|
2
ba
|
620
sqft
|
built
1973
200 177th Dr, Sunny Isles Beach, FL 33160
$-864
Cash flow
-17.5%
Cash-on-Cash Return
2.1%
Cap rate
0.7%
Rent to Value Ratio

Active
$875,000
4
bds
|
2
ba
|
0
sqft
|
built
1944
7 Montilla Ave, Coral Gables, FL 33134
$-2,265
Cash flow
-13.5%
Cash-on-Cash Return
3.0%
Cap rate
0.5%
Rent to Value Ratio
Active
$689,000
2
bds
|
2
ba
|
1,030
sqft
|
built
1966
5161 Collins Ave, Miami Beach, FL 33140
$-758
Cash flow
-5.7%
Cash-on-Cash Return
4.8%
Cap rate
0.7%
Rent to Value Ratio
Active
$750,000
4
bds
|
3
ba
|
2,606
sqft
|
built
2003
14878 SW 41st Ter, Miami, FL 33185
$-1,177
Cash flow
-8.2%
Cash-on-Cash Return
4.3%
Cap rate
0.6%
Rent to Value Ratio

Active
$257,777
1
bds
|
2
ba
|
620
sqft
|
built
1973
17560 Atlantic Blvd, Sunny Isles Beach, FL 33160
$-719
Cash flow
-14.6%
Cash-on-Cash Return
2.8%
Cap rate
0.8%
Rent to Value Ratio
Active
$599,000
3
bds
|
2
ba
|
1,400
sqft
|
built
1990
7578 W 30th Ln, Hialeah, FL 33018
$-1,021
Cash flow
-8.9%
Cash-on-Cash Return
4.1%
Cap rate
0.5%
Rent to Value Ratio

Active
$535,000
3
bds
|
1
ba
|
0
sqft
|
built
1970
3354 NW 181st St, Miami Gardens, FL 33056
$-1,260
Cash flow
-12.3%
Cash-on-Cash Return
3.3%
Cap rate
0.6%
Rent to Value Ratio

Active
$257,777
1
bds
|
1
ba
|
536
sqft
|
built
1973
200 177th Dr, Sunny Isles Beach, FL 33160
$-719
Cash flow
-14.6%
Cash-on-Cash Return
2.8%
Cap rate
0.8%
Rent to Value Ratio
Active
$520,000
2
bds
|
0
ba
|
1,448
sqft
|
built
1948
7530 NE 3rd Ave, Miami, FL 33138
$-1,319
Cash flow
-13.2%
Cash-on-Cash Return
3.1%
Cap rate
0.5%
Rent to Value Ratio
Active
$5,390,000
5
bds
|
6
ba
|
5,212
sqft
|
built
1971
144 N Prospect Dr, Coral Gables, FL 33133
$-25,337
Cash flow
-24.5%
Cash-on-Cash Return
0.5%
Cap rate
0.2%
Rent to Value Ratio
Active
$10,750,000
4
bds
|
6
ba
|
4,992
sqft
|
built
2014
19575 Collins Ave, Sunny Isles Beach, FL 33160
$-68,735
Cash flow
-33.4%
Cash-on-Cash Return
-1.5%
Cap rate
0.1%
Rent to Value Ratio
Active
$559,000
2
bds
|
2
ba
|
1,097
sqft
|
built
1964
5005 Collins Ave, Miami Beach, FL 33140
$-2,472
Cash flow
-23.1%
Cash-on-Cash Return
0.8%
Cap rate
0.7%
Rent to Value Ratio
Active
$590,000
3
bds
|
1
ba
|
1,672
sqft
|
built
1954
17201 NW 37th Ave, Miami Gardens, FL 33056
$-1,574
Cash flow
-13.9%
Cash-on-Cash Return
2.9%
Cap rate
0.5%
Rent to Value Ratio
Active
$288,500
2
bds
|
2
ba
|
861
sqft
|
built
1973
17051 NE 35th Ave, North Miami Beach, FL 33160
$-595
Cash flow
-10.8%
Cash-on-Cash Return
3.7%
Cap rate
0.9%
Rent to Value Ratio

Active
$559,000
3
bds
|
1
ba
|
1,403
sqft
|
built
1955
4485 E 8th Ave, Hialeah, FL 33013
$-809
Cash flow
-7.6%
Cash-on-Cash Return
4.4%
Cap rate
0.6%
Rent to Value Ratio
Active
$399,990
1
bds
|
1
ba
|
692
sqft
|
built
2008
950 Brickell Bay Dr, Miami, FL 33131
$-1,264
Cash flow
-16.5%
Cash-on-Cash Return
2.4%
Cap rate
0.8%
Rent to Value Ratio
Active
$444,877
2
bds
|
2
ba
|
1,316
sqft
|
built
2001
2861 NE 185th St, Aventura, FL 33180
$-533
Cash flow
-6.3%
Cash-on-Cash Return
4.7%
Cap rate
0.7%
Rent to Value Ratio
Active
$525,000
1
bds
|
2
ba
|
802
sqft
|
built
2007
3451 NE 1st Ave, Miami, FL 33137
$-1,971
Cash flow
-19.6%
Cash-on-Cash Return
1.6%
Cap rate
0.7%
Rent to Value Ratio

Active
$780,000
1
bds
|
2
ba
|
997
sqft
|
built
2016
88 SW 7th St, Miami, FL 33130
$-2,798
Cash flow
-18.7%
Cash-on-Cash Return
1.8%
Cap rate
0.7%
Rent to Value Ratio
Active
$308,000
3
bds
|
2
ba
|
993
sqft
|
built
1983
9704 Hammocks Blvd, Miami, FL 33196
$-511
Cash flow
-8.7%
Cash-on-Cash Return
4.2%
Cap rate
0.8%
Rent to Value Ratio

Active
$549,900
3
bds
|
2
ba
|
1,155
sqft
|
built
1948
82 NE 117th St, Miami, FL 33161
$-704
Cash flow
-6.7%
Cash-on-Cash Return
4.6%
Cap rate
0.6%
Rent to Value Ratio
Active
$449,000
2
bds
|
3
ba
|
1,170
sqft
|
built
1973
6900 Bay Dr, Miami Beach, FL 33141
$-1,994
Cash flow
-23.2%
Cash-on-Cash Return
0.8%
Cap rate
0.6%
Rent to Value Ratio

Active
$755,000
5
bds
|
3
ba
|
1,776
sqft
|
built
1960
2530 NW 111th St, Miami, FL 33167
$-2,072
Cash flow
-14.3%
Cash-on-Cash Return
2.9%
Cap rate
0.4%
Rent to Value Ratio
Active
$759,900
5
bds
|
3
ba
|
2,136
sqft
|
built
2019
20600 SW 316th St, Homestead, FL 33030
$-1,702
Cash flow
-11.7%
Cash-on-Cash Return
3.5%
Cap rate
0.5%
Rent to Value Ratio

Active
$2,680,000
3
bds
|
4
ba
|
2,729
sqft
|
built
1952
11377 W Biscayne Canal Rd, Miami, FL 33161
$-10,233
Cash flow
-19.9%
Cash-on-Cash Return
1.6%
Cap rate
0.3%
Rent to Value Ratio