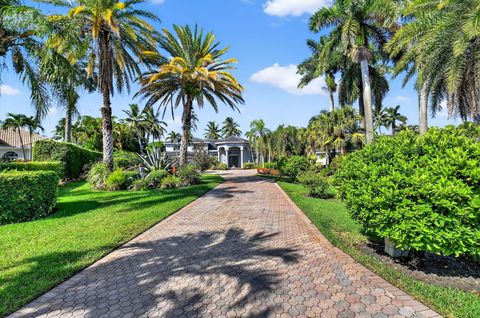
Palm Beach County Investment Properties for Sale
Browse homes for sale and investment properties in Palm Beach County. Refine your search by price, property type, or more.
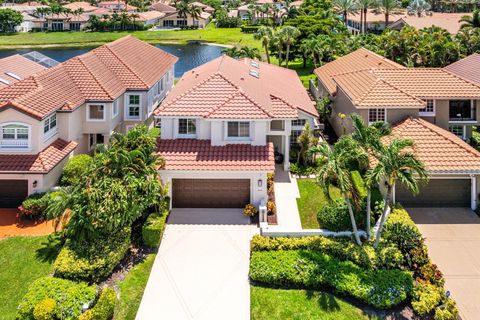
Best cash flowing properties in Palm Beach County
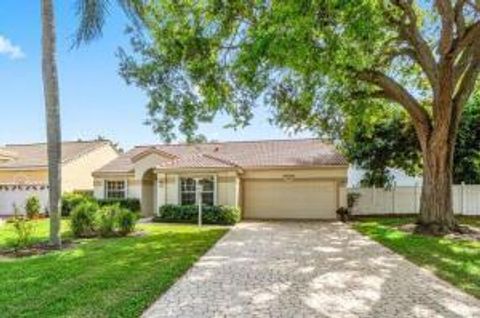
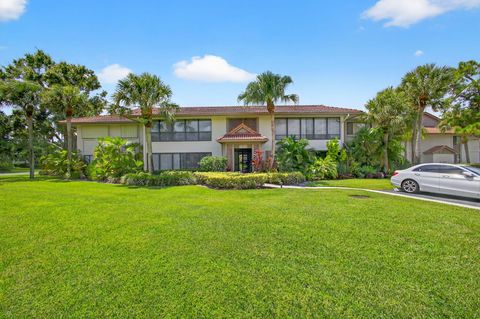
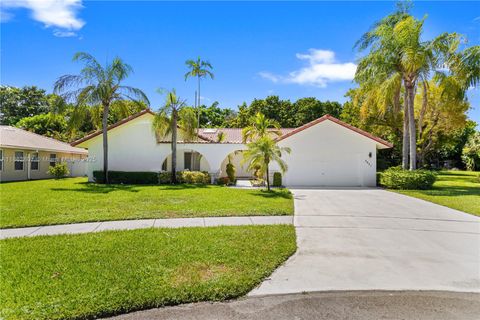
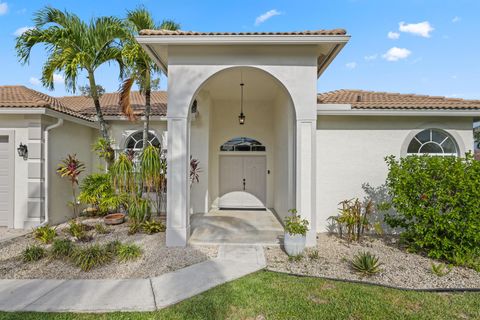
Active
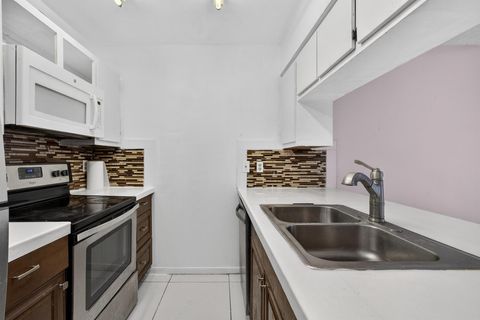
$224,000
2
bds
|
2
ba
|
1,284
sqft
|
built
1983
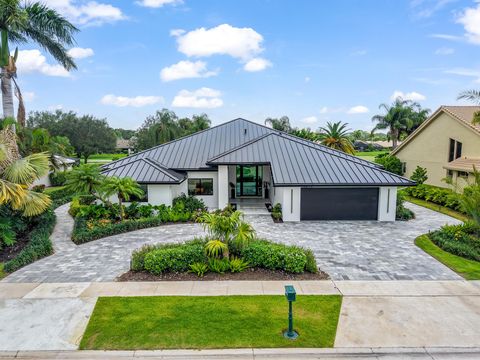
2089 E Bond Dr, West Palm Beach, FL 33415
$-274
Cash flow
-6.4%
Cash-on-Cash Return
4.7%
Cap rate
1.0%
Rent to Value Ratio
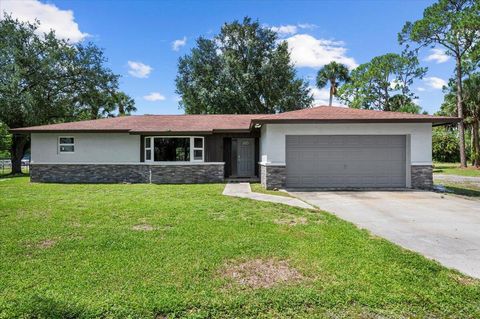
Active
$289,900
2
bds
|
2
ba
|
1,176
sqft
|
built
1980
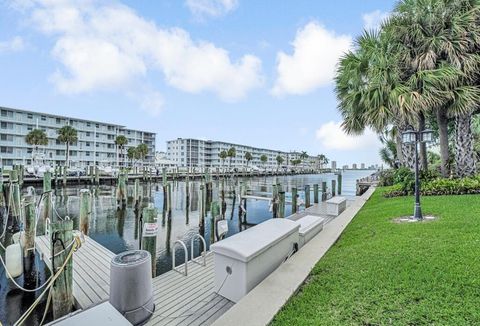
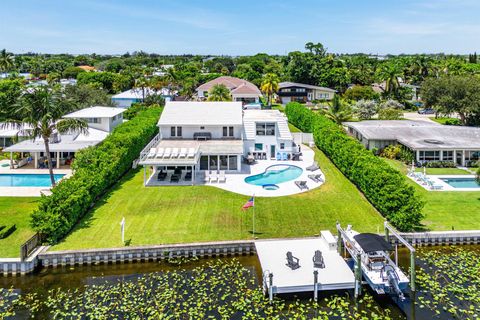
135 Shore Ct, North Palm Beach, FL 33408
$-444
Cash flow
-8.0%
Cash-on-Cash Return
4.3%
Cap rate
0.9%
Rent to Value Ratio
5,720 out of 6,938 properties for sale in Palm Beach County
Limited Results Shown
Create a free account, or log in to reveal all property listings and enjoy the complete experience.
Active
$765,000
bds
|
0
ba
|
1,800
sqft
|
built
1982
4647 Marguerita St, West Palm Beach, FL 33417
$-2,473
Cash flow
-16.9%
Cash-on-Cash Return
2.3%
Cap rate
0.3%
Rent to Value Ratio
Active
$699,000
5
bds
|
3
ba
|
1,456
sqft
|
built
1961
1120 S Federal Hwy, Lake Worth, FL 33460
$-2,572
Cash flow
-19.2%
Cash-on-Cash Return
1.7%
Cap rate
0.3%
Rent to Value Ratio
Active
$660,000
3
bds
|
2
ba
|
1,581
sqft
|
built
1990
1091 Roble Way, Palm Beach Gardens, FL 33410
$-1,497
Cash flow
-11.8%
Cash-on-Cash Return
3.4%
Cap rate
0.6%
Rent to Value Ratio
Active
$799,000
2
bds
|
2
ba
|
1,350
sqft
|
built
1973
1701 S Flagler Dr, West Palm Beach, FL 33401
$-2,895
Cash flow
-18.9%
Cash-on-Cash Return
1.8%
Cap rate
0.7%
Rent to Value Ratio
Active
$525,000
3
bds
|
2
ba
|
1,623
sqft
|
built
1954
2601 Conroy Dr, Lake Park, FL 33403
$-560
Cash flow
-5.6%
Cash-on-Cash Return
4.9%
Cap rate
0.7%
Rent to Value Ratio
Active
$1,225,000
5
bds
|
3
ba
|
2,806
sqft
|
built
1988
10738 Santa Rosa Dr, Boca Raton, FL 33498
$-2,413
Cash flow
-10.3%
Cash-on-Cash Return
3.8%
Cap rate
0.6%
Rent to Value Ratio
Active
$649,000
2
bds
|
2
ba
|
958
sqft
|
built
1967
2871 N Ocean Blvd, Boca Raton, FL 33431
$-2,470
Cash flow
-19.9%
Cash-on-Cash Return
1.6%
Cap rate
0.5%
Rent to Value Ratio
Active
$335,000
3
bds
|
2
ba
|
1,316
sqft
|
built
2005
2727 Anzio Ct, Palm Beach Gardens, FL 33410
$-846
Cash flow
-13.2%
Cash-on-Cash Return
3.1%
Cap rate
0.8%
Rent to Value Ratio
Active
$1,200,000
2
bds
|
2
ba
|
1,210
sqft
|
built
1952
210 Seville Rd, West Palm Beach, FL 33405
$-3,646
Cash flow
-15.9%
Cash-on-Cash Return
2.5%
Cap rate
0.3%
Rent to Value Ratio
Active
$1,240,000
3
bds
|
3
ba
|
1,893
sqft
|
built
1985
176 Helios Dr, Jupiter, FL 33477
$-3,392
Cash flow
-14.3%
Cash-on-Cash Return
2.9%
Cap rate
0.6%
Rent to Value Ratio
Active
$359,000
2
bds
|
2
ba
|
1,268
sqft
|
built
1985
1100 Duncan Cir, Palm Beach Gardens, FL 33418
$-849
Cash flow
-12.3%
Cash-on-Cash Return
3.3%
Cap rate
0.9%
Rent to Value Ratio
Active
$3,925,000
3
bds
|
5
ba
|
4,266
sqft
|
built
1999
7625 Fenwick Pl, Boca Raton, FL 33496
$-17,193
Cash flow
-22.9%
Cash-on-Cash Return
0.9%
Cap rate
0.2%
Rent to Value Ratio
Active
$839,000
4
bds
|
3
ba
|
2,618
sqft
|
built
1979
6180 Celadon Cir, West Palm Beach, FL 33418
$-2,125
Cash flow
-13.2%
Cash-on-Cash Return
3.1%
Cap rate
0.7%
Rent to Value Ratio
Active
$389,000
4
bds
|
3
ba
|
1,826
sqft
|
built
2003
2310 Shoma Ln, Royal Palm Beach, FL 33414
$-967
Cash flow
-13.0%
Cash-on-Cash Return
3.2%
Cap rate
0.7%
Rent to Value Ratio
Active
$3,475,000
4
bds
|
6
ba
|
2,937
sqft
|
built
1988
10290 Silver Lake Dr, Boca Raton, FL 33428
$-15,095
Cash flow
-22.7%
Cash-on-Cash Return
0.9%
Cap rate
0.1%
Rent to Value Ratio
Active
$1,720,000
4
bds
|
3
ba
|
2,206
sqft
|
built
1951
228 Santa Lucia Dr, West Palm Beach, FL 33405
$-4,376
Cash flow
-13.3%
Cash-on-Cash Return
3.1%
Cap rate
0.4%
Rent to Value Ratio
Active
$315,000
2
bds
|
2
ba
|
995
sqft
|
built
1978
159 NW 70th St, Boca Raton, FL 33487
$-1,076
Cash flow
-17.8%
Cash-on-Cash Return
2.0%
Cap rate
0.7%
Rent to Value Ratio
Active
$525,000
2
bds
|
2
ba
|
1,095
sqft
|
built
1979
17 Royal Palm Way, Boca Raton, FL 33432
$-2,045
Cash flow
-20.3%
Cash-on-Cash Return
1.5%
Cap rate
0.5%
Rent to Value Ratio
Active
$620,000
3
bds
|
3
ba
|
2,584
sqft
|
built
1983
2451 SW 23rd Cranbrook Dr, Boynton Beach, FL 33436
$-1,241
Cash flow
-10.4%
Cash-on-Cash Return
3.7%
Cap rate
0.6%
Rent to Value Ratio
Active
$679,000
3
bds
|
2
ba
|
1,798
sqft
|
built
1978
11128 42nd Rd N, Royal Palm Beach, FL 33411
$-2,137
Cash flow
-16.4%
Cash-on-Cash Return
2.4%
Cap rate
0.5%
Rent to Value Ratio
Active
$799,990
2
bds
|
2
ba
|
1,170
sqft
|
built
1983
400 Ocean Trail Way, Jupiter, FL 33477
$-2,243
Cash flow
-14.6%
Cash-on-Cash Return
2.8%
Cap rate
0.8%
Rent to Value Ratio
Active
$415,000
3
bds
|
2
ba
|
1,279
sqft
|
built
1980
9056 Green Meadows Way, Palm Beach Gardens, FL 33418
$-717
Cash flow
-9.0%
Cash-on-Cash Return
4.1%
Cap rate
0.6%
Rent to Value Ratio
Active
$1,399,000
3
bds
|
3
ba
|
2,152
sqft
|
built
1990
6334 NW 24th St, Boca Raton, FL 33434
$-1,786
Cash flow
-6.7%
Cash-on-Cash Return
4.6%
Cap rate
0.7%
Rent to Value Ratio
Active
$565,999
4
bds
|
2
ba
|
1,363
sqft
|
built
2002
31 SW 11th Ave, Delray Beach, FL 33444
$-1,583
Cash flow
-14.6%
Cash-on-Cash Return
2.8%
Cap rate
0.5%
Rent to Value Ratio
Active
$1,400,000
3
bds
|
2
ba
|
2,057
sqft
|
built
1961
5516 Colbright Rd, Lake Worth, FL 33467
$-4,540
Cash flow
-16.9%
Cash-on-Cash Return
2.3%
Cap rate
0.4%
Rent to Value Ratio
Active
$555,000
3
bds
|
2
ba
|
1,728
sqft
|
built
1997
8273 Via Di Veneto, Boca Raton, FL 33496
$-1,049
Cash flow
-9.9%
Cash-on-Cash Return
3.9%
Cap rate
0.7%
Rent to Value Ratio
Active
$1,950,000
6
bds
|
5
ba
|
4,052
sqft
|
built
2000
15463 Tall Oak Ave, Delray Beach, FL 33446
$-5,916
Cash flow
-15.8%
Cash-on-Cash Return
2.5%
Cap rate
0.4%
Rent to Value Ratio
Active
$1,299,000
5
bds
|
3
ba
|
3,495
sqft
|
built
1996
15643 Cypress Park Dr, Wellington, FL 33414
$-2,579
Cash flow
-10.4%
Cash-on-Cash Return
3.8%
Cap rate
0.6%
Rent to Value Ratio
Active
$399,000
3
bds
|
2
ba
|
1,116
sqft
|
built
1999
14010 Veronica Ct, Wellington, FL 33414
$-779
Cash flow
-10.2%
Cash-on-Cash Return
3.8%
Cap rate
0.6%
Rent to Value Ratio
Active
$1,050,000
5
bds
|
4
ba
|
3,818
sqft
|
built
2005
9891 Via Bernini, Lake Worth, FL 33467
$-2,709
Cash flow
-13.5%
Cash-on-Cash Return
3.1%
Cap rate
0.5%
Rent to Value Ratio
Active
$279,900
2
bds
|
2
ba
|
1,073
sqft
|
built
1981
1871 Abbey Rd, West Palm Beach, FL 33415
$-467
Cash flow
-8.7%
Cash-on-Cash Return
4.1%
Cap rate
0.8%
Rent to Value Ratio
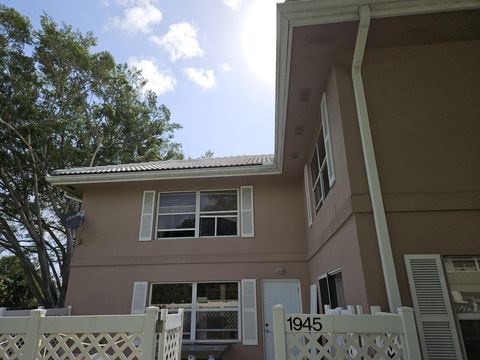
Active
$335,000
2
bds
|
3
ba
|
1,350
sqft
|
built
1989
1945 Stratford Way, West Palm Beach, FL 33409
$-964
Cash flow
-15.0%
Cash-on-Cash Return
2.7%
Cap rate
0.7%
Rent to Value Ratio
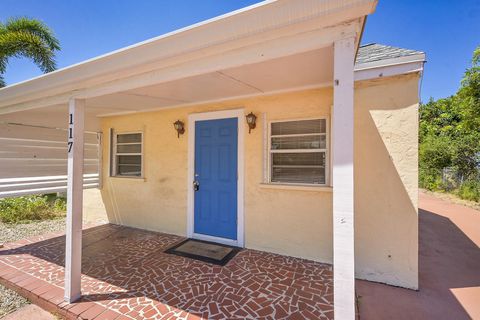
Active
$479,000
2
bds
|
1
ba
|
616
sqft
|
built
1945
117 Mayfield Rd, Lantana, FL 33462
$-1,398
Cash flow
-15.2%
Cash-on-Cash Return
2.6%
Cap rate
0.5%
Rent to Value Ratio
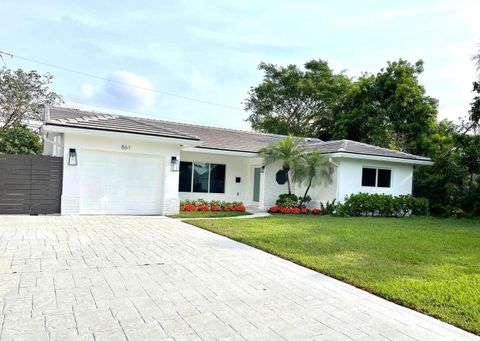
Active
$820,000
3
bds
|
2
ba
|
1,779
sqft
|
built
1967
861 NW 7th St, Boca Raton, FL 33486
$-2,028
Cash flow
-12.9%
Cash-on-Cash Return
3.2%
Cap rate
0.5%
Rent to Value Ratio
Active
$685,000
4
bds
|
3
ba
|
2,484
sqft
|
built
2003
6408 Rock Creek Dr, Lake Worth, FL 33467
$-1,161
Cash flow
-8.8%
Cash-on-Cash Return
4.1%
Cap rate
0.7%
Rent to Value Ratio
Active
$2,850,000
5
bds
|
5
ba
|
4,482
sqft
|
built
1963
7150 W Lake Dr, Lake Clarke Shores, FL 33406
$-8,680
Cash flow
-15.9%
Cash-on-Cash Return
2.5%
Cap rate
0.4%
Rent to Value Ratio
Active
$529,900
3
bds
|
2
ba
|
1,456
sqft
|
built
1971
1204 Wynnewood Dr, West Palm Beach, FL 33417
$-940
Cash flow
-9.3%
Cash-on-Cash Return
4.0%
Cap rate
0.5%
Rent to Value Ratio
Active
$597,000
2
bds
|
2
ba
|
975
sqft
|
built
1968
6530 N Ocean Blvd, Ocean Ridge, FL 33435
$-1,338
Cash flow
-11.7%
Cash-on-Cash Return
3.5%
Cap rate
0.7%
Rent to Value Ratio