United States Investment Properties for Sale
Browse homes for sale and investment properties in United States. Refine your search by price, property type, or more.
Best cash flowing properties in United States
Active
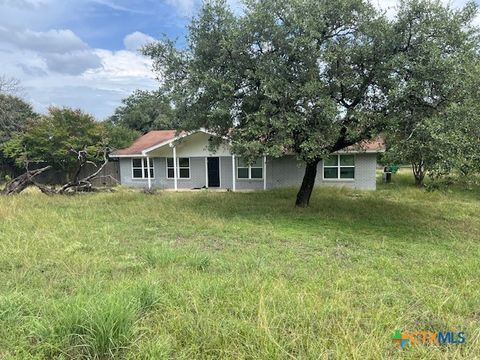
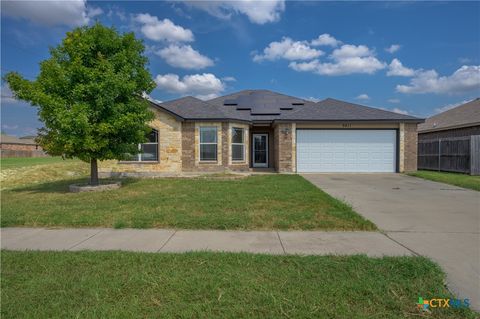
$189,900
3
bds
|
2
ba
|
1,782
sqft
|
built
1977
491 Cactus Cir, Killeen, TX 76542
$149
Cash flow
4.1%
Cash-on-Cash Return
6.6%
Cap rate
1.1%
Rent to Value Ratio
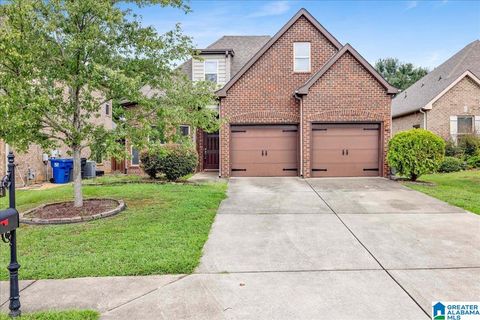
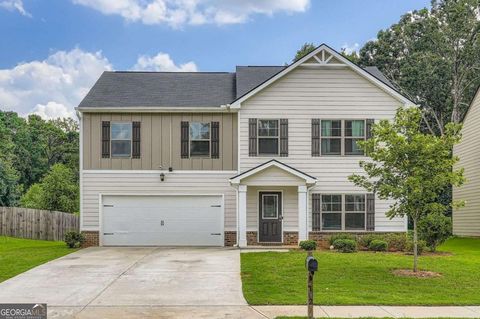
Active
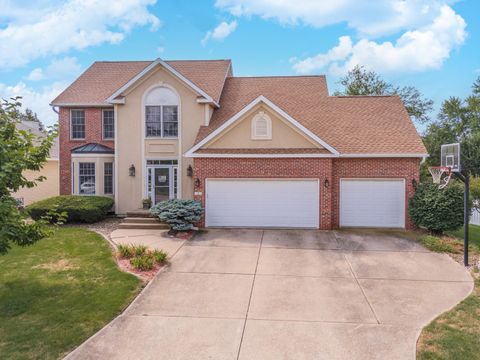
$330,000
4
bds
|
3
ba
|
2,155
sqft
|
built
2010
374 Glen Cross Way, Trussville, AL 35173
$144
Cash flow
2.3%
Cash-on-Cash Return
6.2%
Cap rate
0.8%
Rent to Value Ratio
10,000 out of 310,643 properties for sale in United States
Limited Results Shown
Create a free account, or log in to reveal all property listings and enjoy the complete experience.
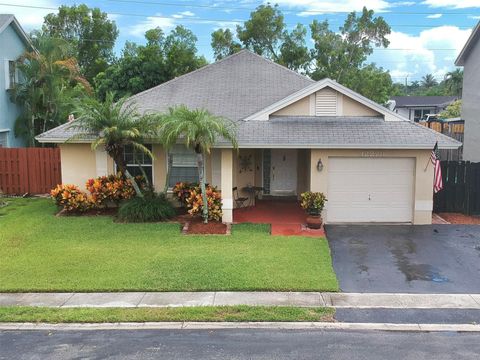
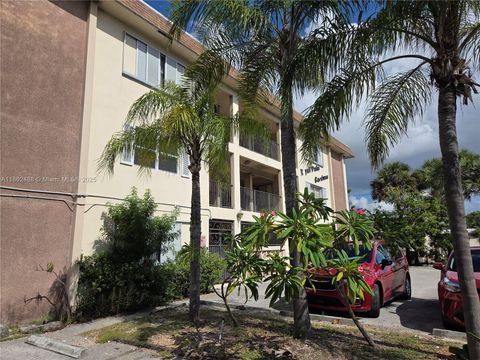
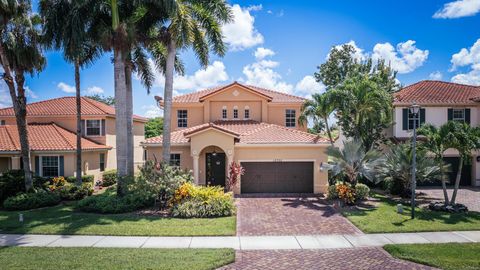
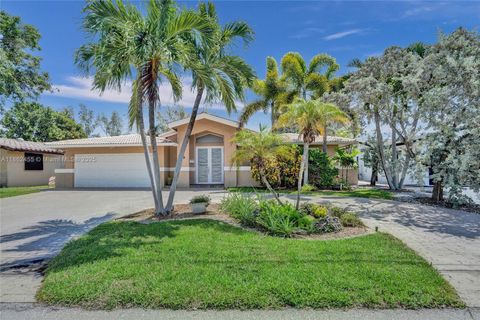
Active
$485,000
3
bds
|
2
ba
|
1,382
sqft
|
built
1988
12278 NW 30th Mnr, Sunrise, FL 33323
$-406
Cash flow
-4.4%
Cash-on-Cash Return
5.1%
Cap rate
0.7%
Rent to Value Ratio
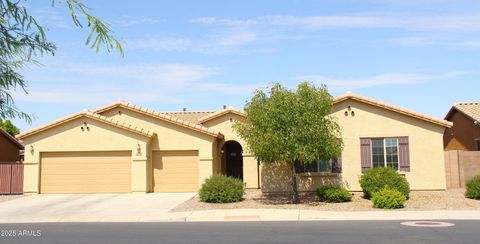
Active
$529,000
4
bds
|
3
ba
|
2,462
sqft
|
built
2015
5704 S 57th Dr, Laveen, AZ 85339
$-1,286
Cash flow
-12.7%
Cash-on-Cash Return
2.8%
Cap rate
0.5%
Rent to Value Ratio
Active
$175,000
1
bds
|
1
ba
|
655
sqft
|
built
1970
348 S Federal Hwy, Dania Beach, FL 33004
$-269
Cash flow
-8.0%
Cash-on-Cash Return
4.3%
Cap rate
0.9%
Rent to Value Ratio
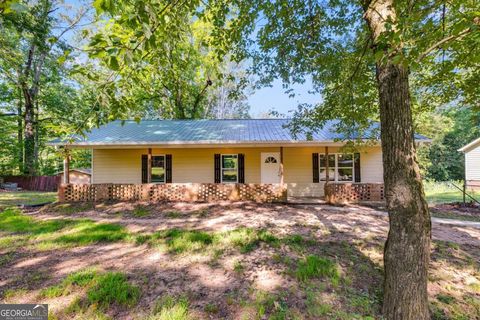
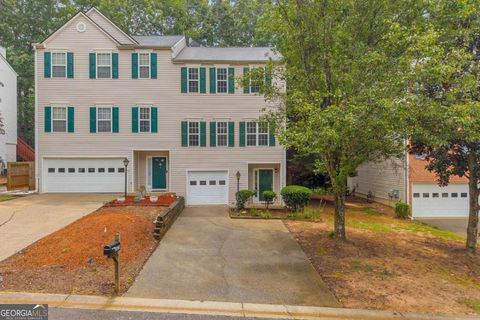
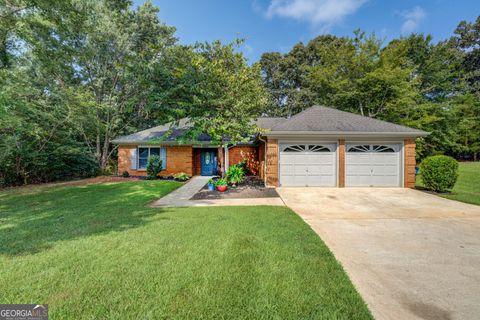
Active
$299,900
4
bds
|
2
ba
|
2,400
sqft
|
built
2017
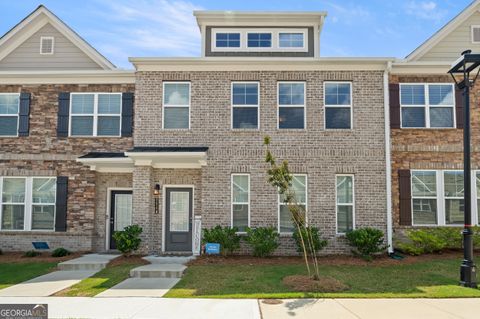
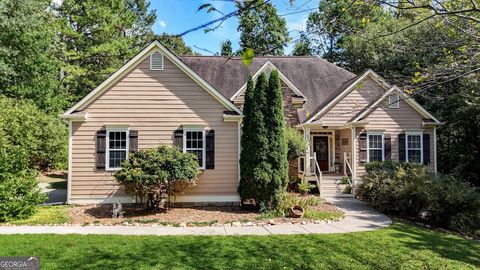
256 Astin Creek Rd, Villa Rica, GA 30180
$-600
Cash flow
-10.4%
Cash-on-Cash Return
3.7%
Cap rate
0.5%
Rent to Value Ratio
Active
$310,000
4
bds
|
2.5
ba
|
0
sqft
|
built
2021
1027 Summer Cypress Dr, Villa Rica, GA 30180
$-409
Cash flow
-6.9%
Cash-on-Cash Return
4.6%
Cap rate
0.7%
Rent to Value Ratio
Active
$429,000
4
bds
|
4
ba
|
1,680
sqft
|
built
2020
13353 SW 250th Ter, Homestead, FL 33032
$-747
Cash flow
-9.1%
Cash-on-Cash Return
4.1%
Cap rate
0.7%
Rent to Value Ratio
Active
$423,500
3
bds
|
4
ba
|
0
sqft
|
built
2005
3307 Regatta Grv, Alpharetta, GA 30004
$-996
Cash flow
-12.3%
Cash-on-Cash Return
3.3%
Cap rate
0.6%
Rent to Value Ratio
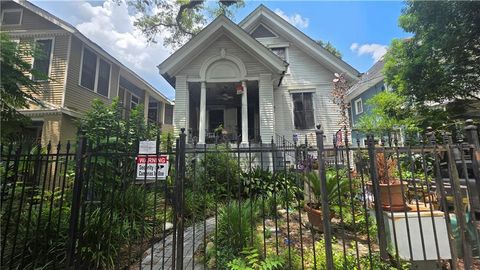
Active
$400,000
6
bds
|
3
ba
|
2,279
sqft
|
built
1903
1532 S Carrollton Ave, New Orleans, LA 70118
$-651
Cash flow
-8.5%
Cash-on-Cash Return
3.7%
Cap rate
0.4%
Rent to Value Ratio
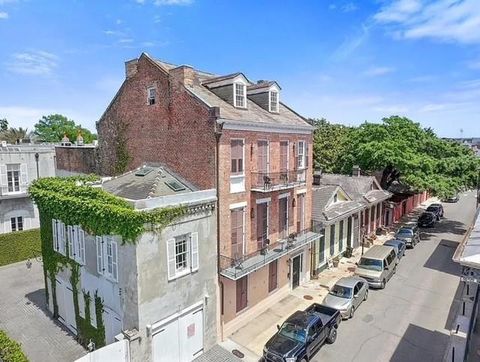
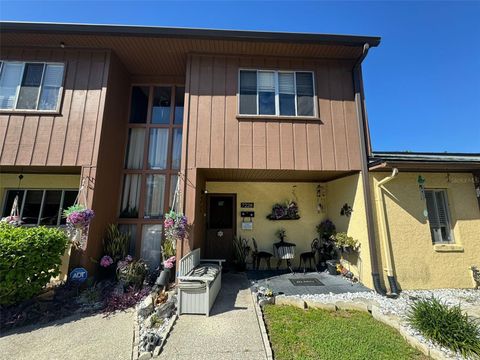
Active
$298,000
1
bds
|
1
ba
|
507
sqft
|
built
1872
727 Barracks St, New Orleans, LA 70116
$-444
Cash flow
-7.8%
Cash-on-Cash Return
3.9%
Cap rate
0.5%
Rent to Value Ratio

Active
$294,000
3
bds
|
2
ba
|
2,768
sqft
|
built
1952
844 Westfall Ave, Kalamazoo, MI 49006
$-511
Cash flow
-9.1%
Cash-on-Cash Return
4.1%
Cap rate
0.7%
Rent to Value Ratio
Active
$88,000
2
bds
|
2
ba
|
922
sqft
|
built
1970
806 W Michigan Ave, Jackson, MI 49202
$-59
Cash flow
-3.5%
Cash-on-Cash Return
5.3%
Cap rate
1.4%
Rent to Value Ratio
Active
$495,000
3
bds
|
2.5
ba
|
1,966
sqft
|
built
2022
2956 Chene Pl, Duluth, GA 30097
$-1,198
Cash flow
-12.6%
Cash-on-Cash Return
3.2%
Cap rate
0.5%
Rent to Value Ratio
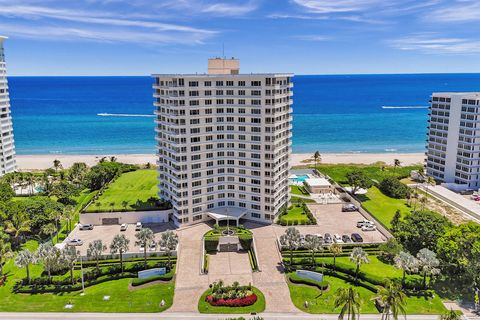
Active
$1,800,000
2
bds
|
2
ba
|
1,567
sqft
|
built
1970
600 S Ocean Blvd, Boca Raton, FL 33432
$-7,156
Cash flow
-20.7%
Cash-on-Cash Return
1.4%
Cap rate
0.4%
Rent to Value Ratio
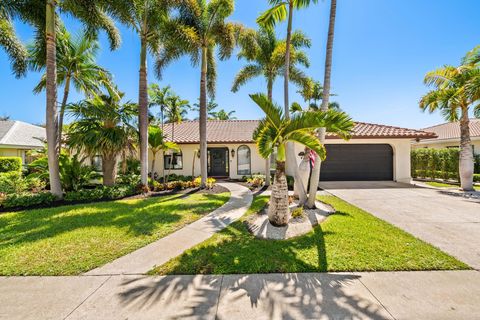
Active
$1,364,000
4
bds
|
2
ba
|
2,278
sqft
|
built
1974
1580 SW 7th Ter, Boca Raton, FL 33486
$-3,754
Cash flow
-14.4%
Cash-on-Cash Return
2.8%
Cap rate
0.4%
Rent to Value Ratio
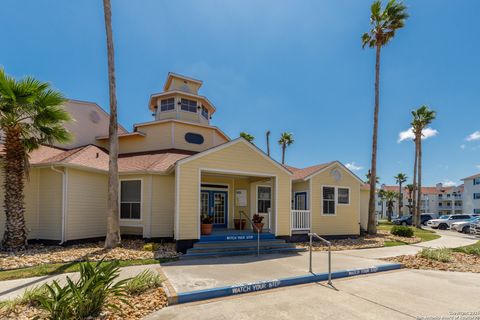
Active
$249,000
1
bds
|
1
ba
|
565
sqft
|
built
1989
14721 Whitecap Blvd, Corpus Christi, TX 78418
$-913
Cash flow
-19.1%
Cash-on-Cash Return
1.3%
Cap rate
0.6%
Rent to Value Ratio
Active
$749,000
5
bds
|
4
ba
|
3,031
sqft
|
built
2008
10722 Willow Oak Ct, Wellington, FL 33414
$-2,127
Cash flow
-14.8%
Cash-on-Cash Return
2.7%
Cap rate
0.6%
Rent to Value Ratio

Active
$559,000
5
bds
|
2
ba
|
1,200
sqft
|
built
1990
143 Robinwood Dr, Shirley, NY 11967
$-991
Cash flow
-9.2%
Cash-on-Cash Return
3.9%
Cap rate
0.6%
Rent to Value Ratio
Active
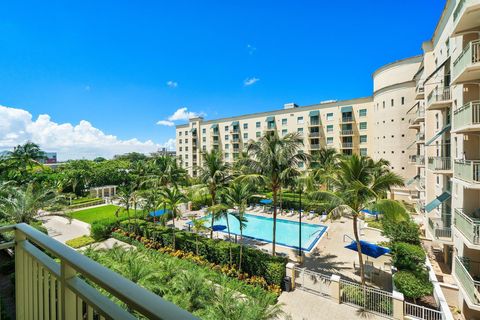
$225,000
1
bds
|
1
ba
|
1,200
sqft
|
built
1970
5700 NW 2nd Ave, Boca Raton, FL 33487
$-622
Cash flow
-14.4%
Cash-on-Cash Return
2.8%
Cap rate
1.0%
Rent to Value Ratio
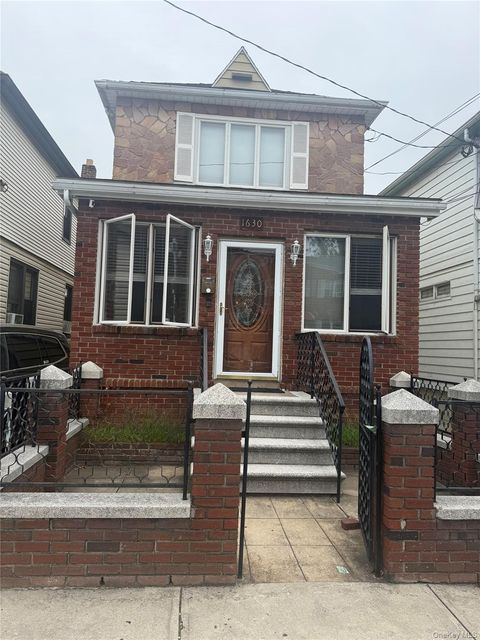
Active
$799,000
3
bds
|
3
ba
|
1,400
sqft
|
built
1925
1630 Radcliff Ave, Bronx, NY 10462
$-2,274
Cash flow
-14.8%
Cash-on-Cash Return
2.7%
Cap rate
0.4%
Rent to Value Ratio
Active
$265,000
2
bds
|
2.5
ba
|
1,472
sqft
|
built
2000
2475 Stonegate Dr NW, Acworth, GA 30101
$-307
Cash flow
-6.0%
Cash-on-Cash Return
4.8%
Cap rate
0.7%
Rent to Value Ratio
Active
$1,450,000
4
bds
|
2
ba
|
2,036
sqft
|
built
1968
948 SE 10th Ct, Pompano Beach, FL 33060
$-4,241
Cash flow
-15.3%
Cash-on-Cash Return
2.6%
Cap rate
0.4%
Rent to Value Ratio
Active
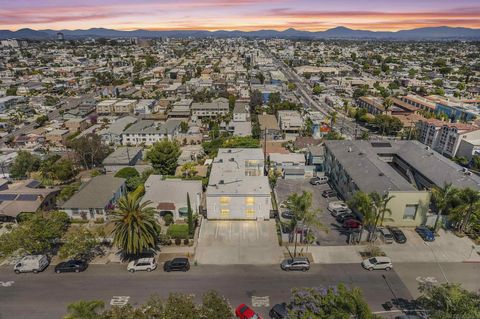
$4,550,000
2
bds
|
2
ba
|
0
sqft
|
built
1972
3925 Georgia St, San Diego, CA 92103
$-20,316
Cash flow
-23.3%
Cash-on-Cash Return
0.7%
Cap rate
0.1%
Rent to Value Ratio
Active
$325,000
4
bds
|
1
ba
|
968
sqft
|
built
1957
3136 N Seacrest Blvd, Boynton Beach, FL 33435
$-374
Cash flow
-6.0%
Cash-on-Cash Return
4.8%
Cap rate
0.7%
Rent to Value Ratio
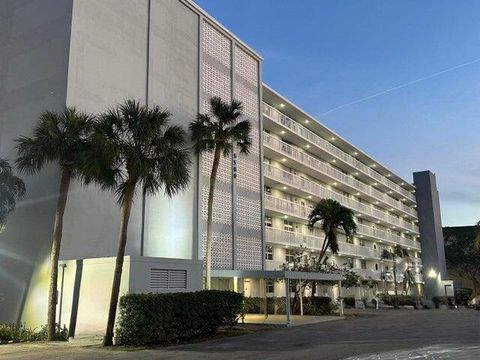
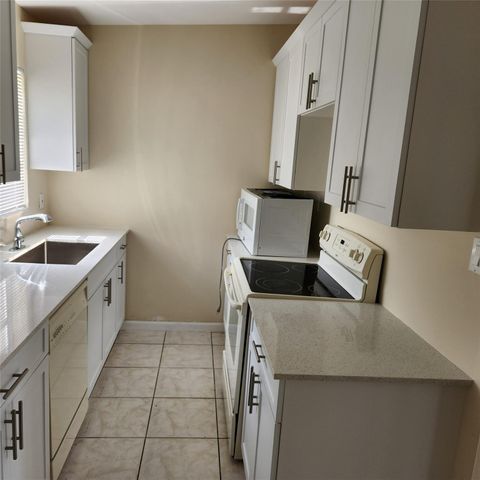
Active
$435,000
2
bds
|
2
ba
|
1,130
sqft
|
built
2006
610 Clematis St, West Palm Beach, FL 33401
$-1,942
Cash flow
-23.3%
Cash-on-Cash Return
0.8%
Cap rate
0.7%
Rent to Value Ratio
Active
$279,900
4
bds
|
2
ba
|
1,910
sqft
|
built
2015
5411 Eagles Nest Dr, Killeen, TX 76549
$-500
Cash flow
-9.3%
Cash-on-Cash Return
3.5%
Cap rate
0.6%
Rent to Value Ratio
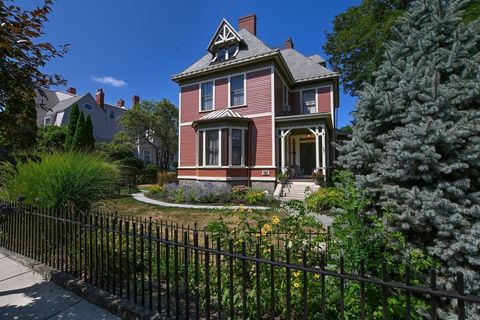
Active
$819,900
4
bds
|
5
ba
|
3,419
sqft
|
built
1875
97 Madison St, New Bedford, MA 02740
$-2,355
Cash flow
-15.0%
Cash-on-Cash Return
2.2%
Cap rate
0.4%
Rent to Value Ratio
Active
$415,000
4
bds
|
4
ba
|
3,611
sqft
|
built
1995
1 Scofield Ct, Bloomington, IL 61704
$-846
Cash flow
-10.6%
Cash-on-Cash Return
3.2%
Cap rate
0.7%
Rent to Value Ratio
Active
$285,000
3
bds
|
2
ba
|
1,659
sqft
|
built
1987
1023 Plantation Ct SE, Conyers, GA 30094
$-440
Cash flow
-8.1%
Cash-on-Cash Return
4.3%
Cap rate
0.7%
Rent to Value Ratio
Active
$679,700
5
bds
|
3
ba
|
3,277
sqft
|
built
2002
157 Preserve Pkwy, Ball Ground, GA 30107
$-1,763
Cash flow
-13.5%
Cash-on-Cash Return
3.0%
Cap rate
0.4%
Rent to Value Ratio
Active
$198,800
1
bds
|
1
ba
|
900
sqft
|
built
1970
2650 S Course Dr, Pompano Beach, FL 33069
$-560
Cash flow
-14.7%
Cash-on-Cash Return
2.8%
Cap rate
0.8%
Rent to Value Ratio
Active
$349,000
5
bds
|
2
ba
|
2,074
sqft
|
built
1987
6412 Stoney Creek Ct, Austell, GA 30168
$-709
Cash flow
-10.6%
Cash-on-Cash Return
3.7%
Cap rate
0.6%
Rent to Value Ratio

Active
$175,000
2
bds
|
1
ba
|
609
sqft
|
built
1978
5162 NE 6th Ave, Oakland Park, FL 33334
$-394
Cash flow
-11.7%
Cash-on-Cash Return
3.4%
Cap rate
1.0%
Rent to Value Ratio
Active
$395,900
3
bds
|
2
ba
|
2,027
sqft
|
built
2006
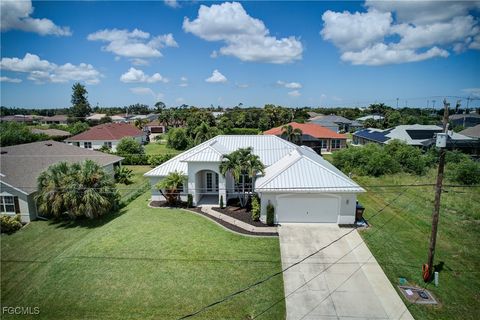
402 SW 25th Pl, Cape Coral, FL 33991
$-537
Cash flow
-7.1%
Cash-on-Cash Return
4.5%
Cap rate
0.6%
Rent to Value Ratio
Active
$320,000
3
bds
|
2
ba
|
1,441
sqft
|
built
1988
3728 SE 1st Ave, Cape Coral, FL 33904
$-558
Cash flow
-9.1%
Cash-on-Cash Return
4.1%
Cap rate
0.7%
Rent to Value Ratio
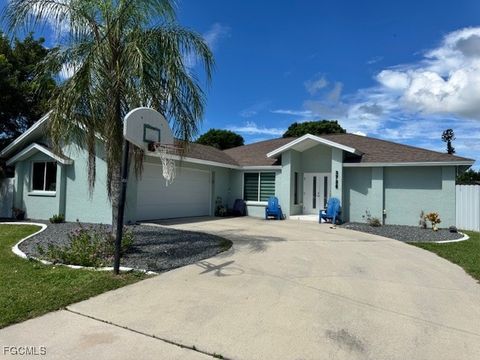
Active
$145,000
3
bds
|
3
ba
|
1,932
sqft
|
built
1976
7228 Cypress Cove Rd, Jacksonville, FL 32244
$-116
Cash flow
-4.2%
Cash-on-Cash Return
5.2%
Cap rate
1.2%
Rent to Value Ratio
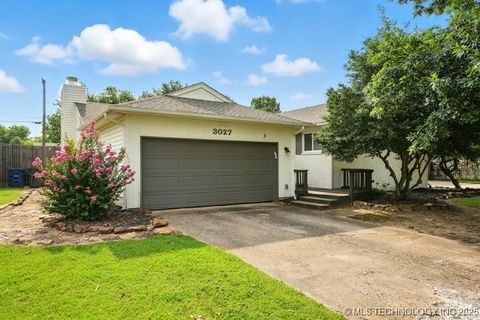
Active
$315,000
3
bds
|
2
ba
|
1,783
sqft
|
built
1956
3027 S Joplin Ave, Tulsa, OK 74114
$-471
Cash flow
-7.8%
Cash-on-Cash Return
3.9%
Cap rate
0.6%
Rent to Value Ratio
Active
$225,000
3
bds
|
2
ba
|
1,610
sqft
|
built
1982
13801 E 33rd Pl, Tulsa, OK 74134
$-285
Cash flow
-6.6%
Cash-on-Cash Return
4.2%
Cap rate
0.6%
Rent to Value Ratio
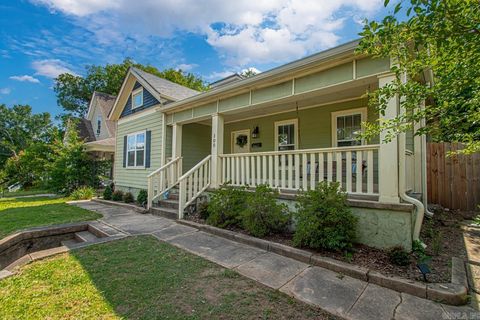
Active
$299,000
3
bds
|
3
ba
|
1,952
sqft
|
built
1920
100 Rice St, Little Rock, AR 72205
$-407
Cash flow
-7.1%
Cash-on-Cash Return
4.0%
Cap rate
0.6%
Rent to Value Ratio