$999,999
Investment Summary
- Monthly Cash Flow
- -$387
- Cap Rate
- 5.7%
- Cash-on-Cash Return
- -2.0%
- Debt Coverage Ratio
- 0.92
- Internal Rate of Return (5 years)
- 2.0%
Cash Flow
Net Operating Income (NOI) minus mortgage payments.
Calculation:
NOI - Mortgage Payments
Cap Rate (Market Value)
Capitalization Rate is a rate of return that compares the yearly Net Operating Income (NOI) to the market value.
Calculation:
NOI / Market Value
Cash-on-Cash Return (CoC)
Annual Cash Flow / Cash Invested
Calculation:
Annual cash flow divided by initial cash invested.
Debt Coverage Ratio (DCR)
Net Operating Income (NOI) divided by total debt payments.
Calculation:
NOI / Total Debt Payments
Internal Rate of Return (IRR)
A metric for assessing profitability over time. IRR is the discount rate at which the net present value (NPV) of all future cash flows (positive and negative) from an investment equals zero — including both periodic cash flow (such as rent) and a projected sale at the end of the holding period. It represents the expected annualized return, accounting for income, expenses, and the recovery of capital through a future sale.
Property Description
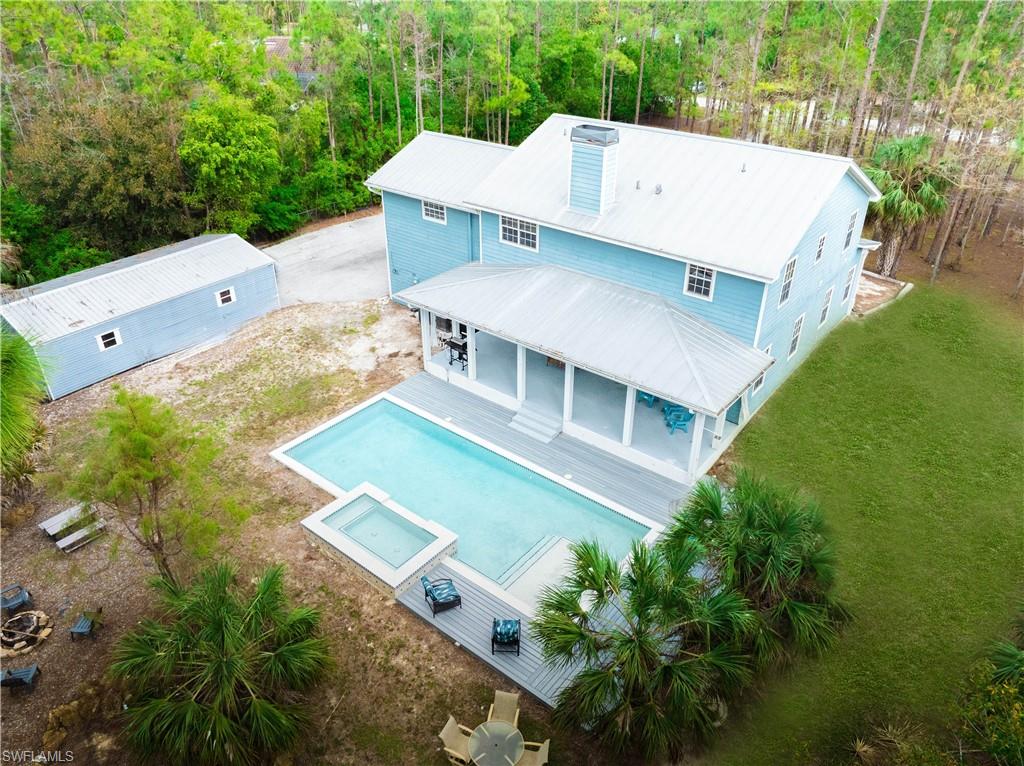
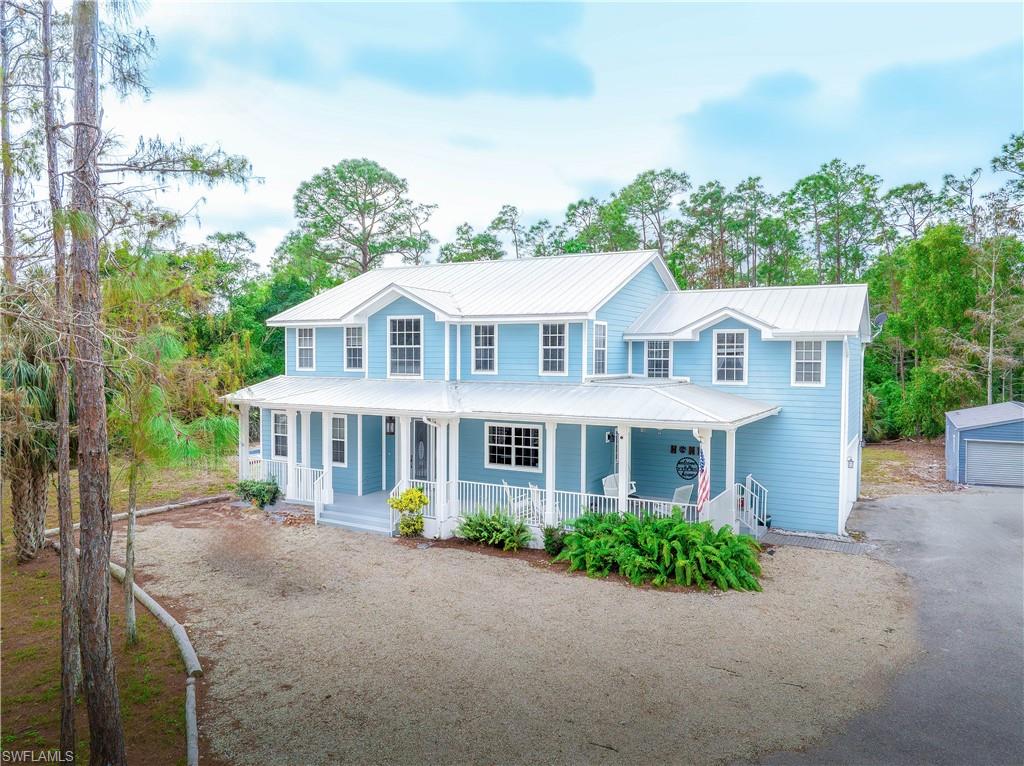
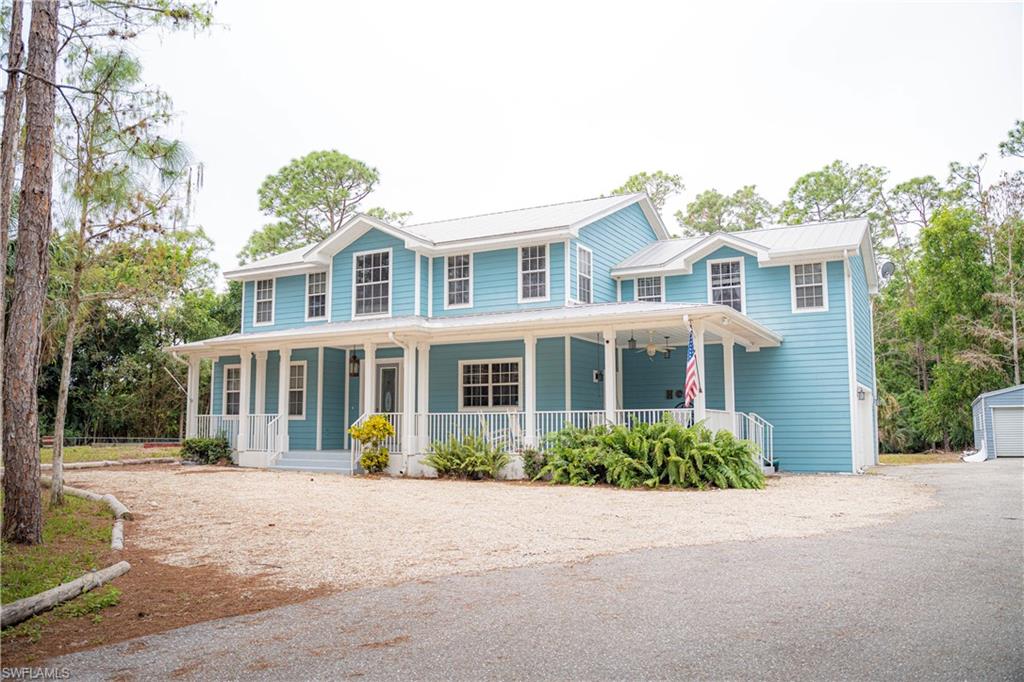
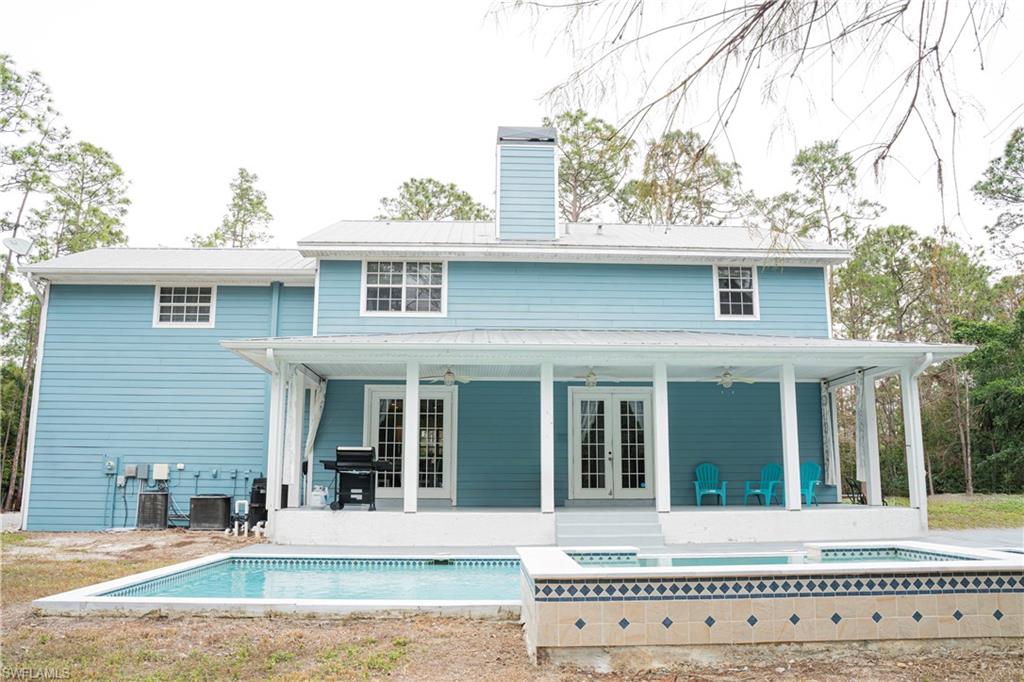
GREAT OPPORTUNITY with an assumable VA loan 2.875 interest rate so do not wait! Estate Pool home nestled among towering pines on 1.25 Acres, Dual Owner’s Suites and Stunning Upgrades! Step into the perfect blend of modern elegance and country charm with this sprawling estate home! This stunning 3,536 sq. ft. custom-built estate is more than just a house—it’s a lifestyle. Brand new 40x16 lap pool, 11x6 giant spa with swim lane to sun deck. Bocce ball court and horse shoes with a customized chicken coop and goat play pen. This home boasts 4 bedrooms and a spacious recreation room/den, 3.5 baths, and a 2-car attached garage, this pool home is a gem is designed for those who crave space, charm, and contemporary upgrades. Fully fenced land with a gated entrance, this stunning property offers privacy, space, and endless possibilities. Decorative shiplap wall coverings add timeless appeal, while large porches invite you to sit back and enjoy the beauty of country living. Inside, every space is oversized and thoughtfully designed. The home boasts four bedrooms, including two owner’s suites, ideal for multi-generational living or hosting long-term guests. The primary owner’s suite is a true retreat, featuring a modern farm-style luxury bath with a jetted soaking tub for ultimate relaxation. With three full baths and a half bath, convenience is at your fingertips. The loft area provides the perfect space for entertaining or guest overflow, while the large family dining area is designed for gathering and making memories. A cozy wood burning fireplace adds warmth and charm, making this home as inviting as it is spacious. The gourmet kitchen boasts a farmhouse sink, double oven, and stainless steel appliances. The outdoor space is equally impressive, featuring a sparkling 2023 built pool, a private oasis for relaxing and entertaining. There’s also plenty of room for horses, goats, and other animals, making this a dream property for those who love the country lifestyle with the beaches and entertaining amenities less than five minutes from this hidden gem. A massive 20' x 36' detached 720sq.ft. workshop/mancave is fully equipped with electricity and offers the ultimate space for tools, toys, with two overhead garage doors. With a perfect balance of modern amenities, farmhouse character, and wide-open spaces, this estate is truly one of a kind.With no HOA or restrictions, there's ample space to park your boat, RV, or other recreational vehicles. Best of all, this home sits in flood zone X, meaning no flood insurance is required. Ideally located just minutes from Bonita Springs Beach, top-rated private and public schools, award-winning restaurants, shopping, golf courses, theaters, and RSW Airport, this one-of-a-kind estate offers the perfect blend of privacy, convenience, and modern living. Don’t miss your chance to make this incredible home yours!
Build Your Team
Quickly find investor-friendly professionals who can help you succeed in real estate investing at any stage of the investing journey.


Agents
Match with investor-friendly agents who can help you find, analyze, and close your next deal


Lenders
Get the best funding…find investor-friendly lenders who specialize in your deal strategy


Property Managers
Transition to passive investing. Find a trusted property management partnership that lasts.


Tax Pros & Accountants
Taxes and financial reporting made easy—find experts to create tax savings strategies, file taxes, and more
Location
Property Details
Parking
- Description: Attached, Driveway, Garage, GolfCartGarage, Guest, Paved, RVAccessParking, GarageDoorOpener
- Details: Garage Door Opener, Paved, Guest, Attached
- Garage Spaces: 2
- Spaces Total: 2
Bedroom Information
- # of Bedrooms: 4
Bathroom Information
- # of Baths (Full): 3
- # of Baths (Partial): 1
- # of Baths (Total): 4.0
Interior Features
- # of Stories: 2
- Fireplace: Yes
Exterior Features
- Exterior Walls Materials: Siding (Alum/Vinyl)
- Roof Type: IRR/Cathedral
- Roof Material: Metal
- Pool: Yes
Land Information
- Land Use: Residential
- Land Use Subtype: Single Family Residential
Lot Information
- Parcel ID: 154725B300200.5130
- Lot Size: 54450 sqft
Property Information
- Property Type: Single Family Residence
- Style: Multi-Story Home, Single Family
- Year Built: 2002
Tax Information
- Annual Tax: $1,136
Utilities
- Water & Sewer: Private, Well
- Heating: Exhaust Fan, Central, Electric
- Cooling: Ceiling Fan(s), Exhaust Fan
Location
- County: Lee
Listing Details
Investment Summary
- Monthly Cash Flow
- -$387
- Cap Rate
- 5.7%
- Cash-on-Cash Return
- -2.0%
- Debt Coverage Ratio
- 0.92
- Internal Rate of Return (5 years)
- 2.0%
Cash Flow
Net Operating Income (NOI) minus mortgage payments.
Calculation:
NOI - Mortgage Payments
Cap Rate (Market Value)
Capitalization Rate is a rate of return that compares the yearly Net Operating Income (NOI) to the market value.
Calculation:
NOI / Market Value
Cash-on-Cash Return (CoC)
Annual Cash Flow / Cash Invested
Calculation:
Annual cash flow divided by initial cash invested.
Debt Coverage Ratio (DCR)
Net Operating Income (NOI) divided by total debt payments.
Calculation:
NOI / Total Debt Payments
Internal Rate of Return (IRR)
A metric for assessing profitability over time. IRR is the discount rate at which the net present value (NPV) of all future cash flows (positive and negative) from an investment equals zero — including both periodic cash flow (such as rent) and a projected sale at the end of the holding period. It represents the expected annualized return, accounting for income, expenses, and the recovery of capital through a future sale.
Purchase Details
Purchase PriceThe price paid for the property. Purchase price:
| $999,999 |
|---|---|
Amount FinancedThe amount of the purchase financed through a loan. Amount financed:
| -$799,999 |
Down paymentThe initial payment made towards the purchase. Down payment:
| $200,000 |
Closing CostsFees and expenses associated with purchasing a property, typically ranging from 2% to 5% of the home’s purchase price, paid at the end of a home purchase to cover services like lending, title transfer, and taxes. Closing costs:
| $30,000 |
Rehab CostsCosts incurred to repair or improve the property, including: roof, flooring, exterior siding, kitchen, exterior paint, bathrooms, etc. Rehab costs:
| $0 |
Initial Cash InvestedThe total initial cash invested in the property. Calculation:Down payment + Buying costs + Rehab costs Initial cash invested:
| $230,000 |
Square Feet (SQFT)The total square footage of the property. Square feet:
| 3,536 |
Cost Per Square FootCost per square foot of the property. Calculation:Purchase Price / Square Feet Cost per square foot:
| $283 |
Monthly Rent Per Square FootMonthly rent divided by the number of square feet. This ratio helps investors compare rental income efficiency across properties, markets, and unit sizes Calculation:Monthly Rent / Square Feet Monthly rent per square foot:
| $1.98 |
Financing Details
Loan AmountThe total sum of money borrowed from a lender to finance a property purchase. Calculation:Purchase Price - Down Payment
Loan amount:
| $799,999 |
|---|---|
Loan to Value Ratio (LTV)Loan amount divided by the market value of the property. Calculation:Loan Amount / Market Value
Loan to value ratio:
| 80.0% |
Loan TypeThe type of loan (e.g., fixed, adjustable).
Loan type:
| Amortizing |
TermThe loan repayment period in years.
Term:
| 30 years |
Interest RateThe percentage a lender charges on the borrowed amount of a loan, determining the cost of borrowing money.
Interest rate:
| 6.625% |
Principal & Interest (PI)The principal is the portion of the loan payment that reduces the loan balance. The interest is the lender's charge for borrowing money. Calculation:(P * r * (1 + r) ** n) / ((1 + r) ** n - 1) Where:
P = Loan amount (principal)
Principal & interest:
| $5,122 |
Property TaxesAnnual taxes levied by local governments on real estate properties. These taxes fund public services like schools, roads, and emergency services.
Property tax:
| $95 |
InsuranceThe costs for insurance coverage to protect against financial losses due to risks like fire, natural disasters, theft, liability, or tenant-related damages. Calculation:Assumes 7% of gross rental income, unless insurance rates are specified.
Insurance:
| $490 |
Private Mortgage Insurance (PMI)A fee that borrowers pay when they take out a conventional loan with a loan-to-value (LTV) ratio above 80%.
Private mortgage insurance (PMI):
| $0 |
Monthly PaymentThe fixed amount a borrower pays each month to repay a loan. It typically includes principal and interest (P&I) and may also cover property taxes, insurance, HOA fees, and PMI if escrowed. Monthly payment:
| $5,707 |
Operating Income
| % Rent | Monthly | Yearly | |
|---|---|---|---|
Gross RentThe total rental income received from tenants before deducting any expenses. Includes base rent, late fees, pet fees, parking fees, and other recurring charges.
Gross rent:
| $7,000 | $84,000 | |
Vacancy LossExpected loss of rent due to vacancies.
Vacancy loss:
(6%)
| 6% | -$420 | -$5,040 |
Operating IncomeGross rental income minus vacancy loss. Calculation:Gross rent - Vacancy loss
Operating income:
| $6,580 | $78,960 |
Operating Expenses
| % Rent | Monthly | Yearly | |
|---|---|---|---|
Property TaxesAnnual taxes levied by local governments on real estate properties. These taxes fund public services like schools, roads, and emergency services. | 1% | -$95 | -$1,136 |
InsuranceThe costs for insurance coverage to protect against financial losses due to risks like fire, natural disasters, theft, liability, or tenant-related damages. Calculation:Assumes 7% of gross rental income, unless insurance rates are specified. | 7% | -$490 | -$5,880 |
Property ManagementThe costs associated with hiring a property manager to handle the day-to-day operations of a rental property. Includes management fees, leasing fes, eviction fees, etc. Calculation:Assumes 8% of gross rental income. | 8% | -$560 | -$6,720 |
Repairs & MaintenanceOngoing costs for routine upkeep and minor fixes needed to keep a property in good working condition. Calculation:Assumes 5% of gross rental income. Varies by property age and condition. | 5% | -$350 | -$4,200 |
Capital ExpensesLarge, infrequent costs for major improvements or replacements, like a new roof, HVAC system, or appliances. Calculation:Assumes 5% of gross rental income. Varies by property age. | 5% | -$350 | -$4,200 |
HOA FeesRegular dues paid to a Homeowners Association for community maintenance, amenities, and management. Similar fees include: Condo Association Fees, Co-op Maintenance Fees, etc. | n/a | n/a | n/a |
Operating ExpensesRecurring costs required to maintain and manage a rental property, including property taxes, insurance, maintenance, repairs, utilities (if paid by the owner), property management fees, and other day-to-day expenses. Calculation:Insurance + Property Taxes + Property Management + Repairs & Maintenance + Capital Expenditures + HOA Fees | 26% | -$1,845 | -$22,136 |
Cash Flow
| Monthly | Yearly | |
|---|---|---|
Net Operating Income (NOI)The income generated from a property after deducting all operating expenses but before deducting mortgage payments, taxes, and capital expenditures. Calculation:Gross Operating Income - Operating Expenses
Net operating income:
| $4,735 | $56,820 |
Mortgage PaymentThe fixed amount a borrower pays each month to repay a loan. It typically includes principal and interest (P&I) and may also cover property taxes, insurance, HOA fees, and PMI if escrowed. | -$5,122 | -$61,464 |
Cash FlowNet Operating Income (NOI) minus mortgage payments. Calculation:NOI - Mortgage Payments | -$387 | -$4,644 |