$575,000
Investment Summary
- Monthly Cash Flow
- -$1,075
- Cap Rate
- 3.9%
- Cash-on-Cash Return
- -9.8%
- Debt Coverage Ratio
- 0.63
- Internal Rate of Return (5 years)
- -5.5%
Cash Flow
Net Operating Income (NOI) minus mortgage payments.
Calculation:
NOI - Mortgage Payments
Cap Rate (Market Value)
Capitalization Rate is a rate of return that compares the yearly Net Operating Income (NOI) to the market value.
Calculation:
NOI / Market Value
Cash-on-Cash Return (CoC)
Annual Cash Flow / Cash Invested
Calculation:
Annual cash flow divided by initial cash invested.
Debt Coverage Ratio (DCR)
Net Operating Income (NOI) divided by total debt payments.
Calculation:
NOI / Total Debt Payments
Internal Rate of Return (IRR)
A metric for assessing profitability over time. IRR is the discount rate at which the net present value (NPV) of all future cash flows (positive and negative) from an investment equals zero — including both periodic cash flow (such as rent) and a projected sale at the end of the holding period. It represents the expected annualized return, accounting for income, expenses, and the recovery of capital through a future sale.
Property Description
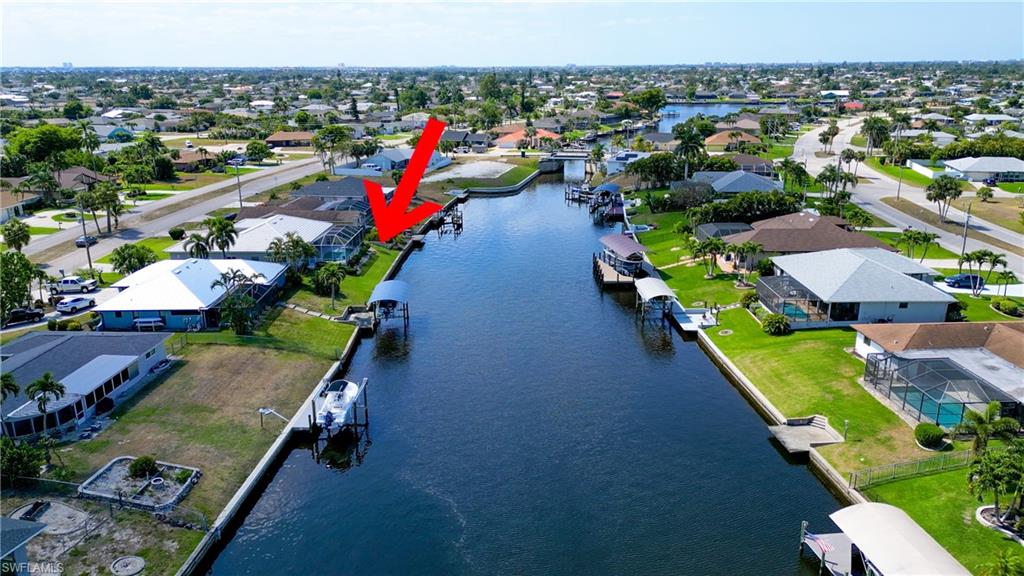
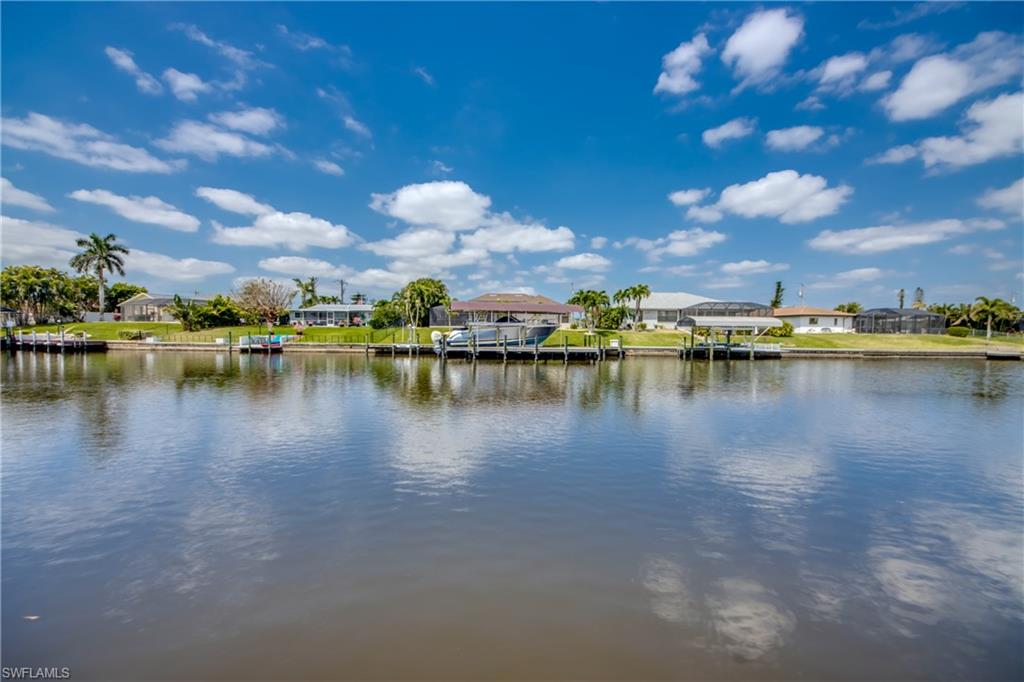
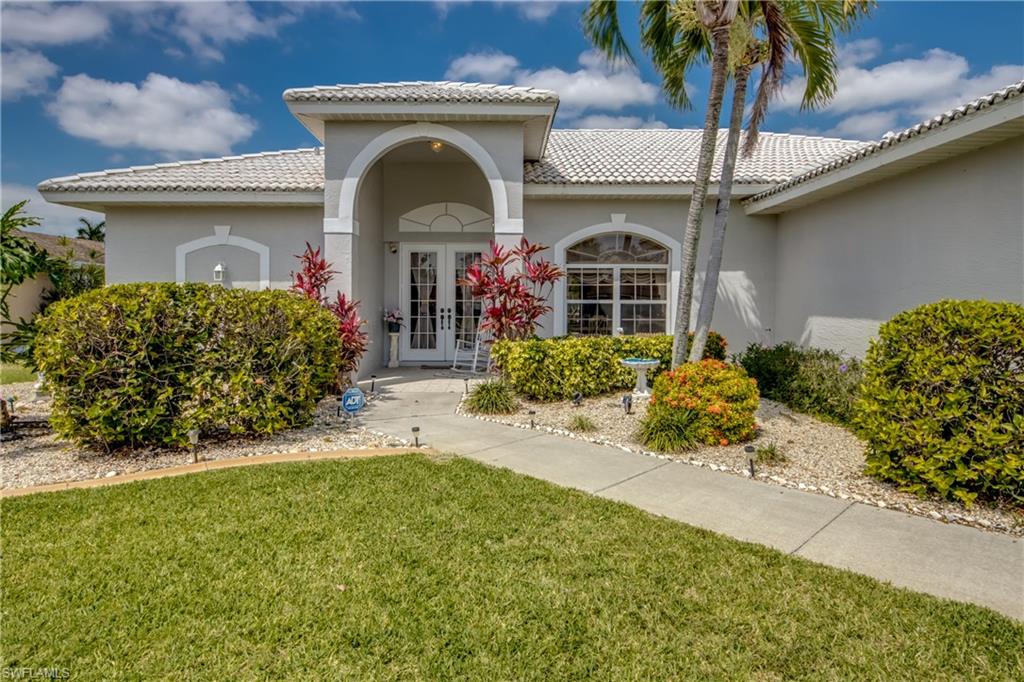
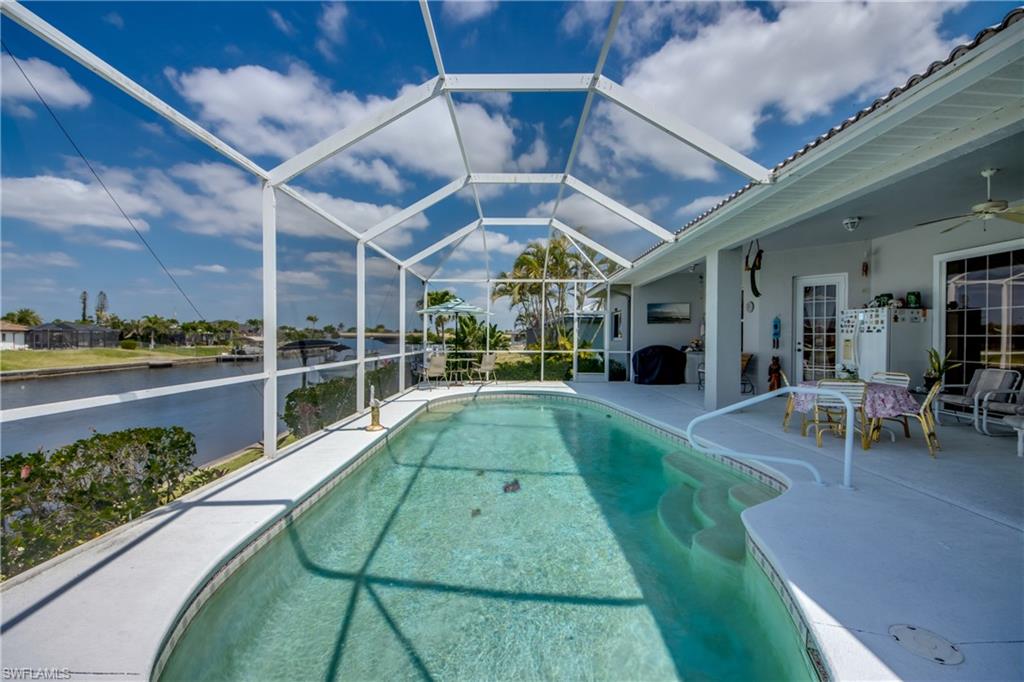
Built to Last, Ready to Love—This Waterfront Gem Has It All! From the moment you arrive, it’s clear this home was built to stand the test of time—literally. Crafted by TRACEY BUILDERS, this quality-constructed, concrete block beauty has weathered every storm with strength and grace. Elevated at a secure 11.2 feet and never once affected by flooding, you can rest easy here—no flood insurance required and pure peace of mind included. Inside, you’ll find soaring volume ceilings, a wide-open great room floorplan, and 8’ pocketing sliders that blur the lines between indoor and outdoor living—perfect for hosting poolside gatherings or enjoying a quiet evening by the water. Overlooking the shimmering pool and the wide Gulf-access Rubicon Canal, your view is as relaxing as your lifestyle. Enjoy three spacious bedrooms, two full bathrooms and a two car garage. Super appealing floorplan. The oversized primary suite is a true retreat with space for a home office, nursery, or exercise area, plus pocketing sliders to the lanai for midnight dips in the pool. Dual vanities, a walk-in closet, and a generous bath round out the master suite. On the other side of the home, your guests will enjoy privacy and spacious accommodations. The kitchen is the central hub of this home. It features ample cabinetry, a pantry, breakfast bar and breakfast nook, plus an adjacent formal dining space for entertaining or another use of your choice. Practical perks include an indoor laundry room with storage and sink, a 473 sq ft garage with attic storage (pull down staircase and plywood flooring), hurricane shutters, security system, 2025 water heater, sprinkler system, and convenient manablock plumbing. The screened pool area has a mansard pool cage and offers both sunshine and shade, and while the pool may want a resurface down the road, it’s cosmetic—not critical. Great spaces under cover in the shade and on the sundeck. Selling furnished if you’d like—just bring your swimsuit and your boat. Best of all, you can launch your boat right from your backyard and enjoy miles and miles of gulf access canals, local beaches and islands—perfect for fishing, exploring, or simply drifting the day away. And when it’s time to venture out, you’re just minutes from grocery stores, restaurants, and everyday conveniences. PET friendly, Rent friendly and NO HOA. Southwest Florida is a playground for shelling, swimming, pickleball, golf, and boating. With 400 miles of canals you’ll enjoy world-class boating, freshwater and saltwater fishing. Looking for sand and surf? You’re a short drive from the white-sand beaches of Fort Myers, the charm of Sanibel and Captiva Islands, and the easy travel access of RSW International Airport. Whether it’s a beach day, a weekend getaway, or visitors flying in to join the fun, this location makes it all effortless. Grab your fishing poles, boat and your flip-flops—it’s all here waiting for you!
Build Your Team
Quickly find investor-friendly professionals who can help you succeed in real estate investing at any stage of the investing journey.


Agents
Match with investor-friendly agents who can help you find, analyze, and close your next deal


Lenders
Get the best funding…find investor-friendly lenders who specialize in your deal strategy


Property Managers
Transition to passive investing. Find a trusted property management partnership that lasts.


Tax Pros & Accountants
Taxes and financial reporting made easy—find experts to create tax savings strategies, file taxes, and more
Location
Property Details
Parking
- Description: Garage
- Details: Garage Door Opener, Paved, Attached
- Garage Spaces: 2
- Spaces Total: 2
Bedroom Information
- # of Bedrooms: 3
Bathroom Information
- # of Baths (Full): 2
- # of Baths (Total): 2.0
Interior Features
- # of Stories: 1
Exterior Features
- Exterior Walls Materials: Stucco
- Roof Type: Hip
- Roof Material: Tile
- Pool: Yes
Land Information
- Land Use: Residential
- Land Use Subtype: Single Family Residential
Lot Information
- Parcel ID: 314424C100634.0110
- Lot Size: 10019 sqft
Property Information
- Property Type: Single Family Residence
- Style: Ranch, Single Family
- Year Built: 2004
Tax Information
- Annual Tax: $4,056
Utilities
- Heating: Central, Electric
- Cooling: Ceiling Fan(s)
Location
- County: Lee
Listing Details
Investment Summary
- Monthly Cash Flow
- -$1,075
- Cap Rate
- 3.9%
- Cash-on-Cash Return
- -9.8%
- Debt Coverage Ratio
- 0.63
- Internal Rate of Return (5 years)
- -5.5%
Cash Flow
Net Operating Income (NOI) minus mortgage payments.
Calculation:
NOI - Mortgage Payments
Cap Rate (Market Value)
Capitalization Rate is a rate of return that compares the yearly Net Operating Income (NOI) to the market value.
Calculation:
NOI / Market Value
Cash-on-Cash Return (CoC)
Annual Cash Flow / Cash Invested
Calculation:
Annual cash flow divided by initial cash invested.
Debt Coverage Ratio (DCR)
Net Operating Income (NOI) divided by total debt payments.
Calculation:
NOI / Total Debt Payments
Internal Rate of Return (IRR)
A metric for assessing profitability over time. IRR is the discount rate at which the net present value (NPV) of all future cash flows (positive and negative) from an investment equals zero — including both periodic cash flow (such as rent) and a projected sale at the end of the holding period. It represents the expected annualized return, accounting for income, expenses, and the recovery of capital through a future sale.
Purchase Details
Purchase PriceThe price paid for the property. Purchase price:
| $575,000 |
|---|---|
Amount FinancedThe amount of the purchase financed through a loan. Amount financed:
| -$460,000 |
Down paymentThe initial payment made towards the purchase. Down payment:
| $115,000 |
Closing CostsFees and expenses associated with purchasing a property, typically ranging from 2% to 5% of the home’s purchase price, paid at the end of a home purchase to cover services like lending, title transfer, and taxes. Closing costs:
| $17,250 |
Rehab CostsCosts incurred to repair or improve the property, including: roof, flooring, exterior siding, kitchen, exterior paint, bathrooms, etc. Rehab costs:
| $0 |
Initial Cash InvestedThe total initial cash invested in the property. Calculation:Down payment + Buying costs + Rehab costs Initial cash invested:
| $132,250 |
Square Feet (SQFT)The total square footage of the property. Square feet:
| 1,762 |
Cost Per Square FootCost per square foot of the property. Calculation:Purchase Price / Square Feet Cost per square foot:
| $326 |
Monthly Rent Per Square FootMonthly rent divided by the number of square feet. This ratio helps investors compare rental income efficiency across properties, markets, and unit sizes Calculation:Monthly Rent / Square Feet Monthly rent per square foot:
| $1.82 |
Financing Details
Loan AmountThe total sum of money borrowed from a lender to finance a property purchase. Calculation:Purchase Price - Down Payment
Loan amount:
| $460,000 |
|---|---|
Loan to Value Ratio (LTV)Loan amount divided by the market value of the property. Calculation:Loan Amount / Market Value
Loan to value ratio:
| 80.0% |
Loan TypeThe type of loan (e.g., fixed, adjustable).
Loan type:
| Amortizing |
TermThe loan repayment period in years.
Term:
| 30 years |
Interest RateThe percentage a lender charges on the borrowed amount of a loan, determining the cost of borrowing money.
Interest rate:
| 6.625% |
Principal & Interest (PI)The principal is the portion of the loan payment that reduces the loan balance. The interest is the lender's charge for borrowing money. Calculation:(P * r * (1 + r) ** n) / ((1 + r) ** n - 1) Where:
P = Loan amount (principal)
Principal & interest:
| $2,945 |
Property TaxesAnnual taxes levied by local governments on real estate properties. These taxes fund public services like schools, roads, and emergency services.
Property tax:
| $338 |
InsuranceThe costs for insurance coverage to protect against financial losses due to risks like fire, natural disasters, theft, liability, or tenant-related damages. Calculation:Assumes 7% of gross rental income, unless insurance rates are specified.
Insurance:
| $224 |
Private Mortgage Insurance (PMI)A fee that borrowers pay when they take out a conventional loan with a loan-to-value (LTV) ratio above 80%.
Private mortgage insurance (PMI):
| $0 |
Monthly PaymentThe fixed amount a borrower pays each month to repay a loan. It typically includes principal and interest (P&I) and may also cover property taxes, insurance, HOA fees, and PMI if escrowed. Monthly payment:
| $3,507 |
Operating Income
| % Rent | Monthly | Yearly | |
|---|---|---|---|
Gross RentThe total rental income received from tenants before deducting any expenses. Includes base rent, late fees, pet fees, parking fees, and other recurring charges.
Gross rent:
| $3,200 | $38,400 | |
Vacancy LossExpected loss of rent due to vacancies.
Vacancy loss:
(6%)
| 6% | -$192 | -$2,304 |
Operating IncomeGross rental income minus vacancy loss. Calculation:Gross rent - Vacancy loss
Operating income:
| $3,008 | $36,096 |
Operating Expenses
| % Rent | Monthly | Yearly | |
|---|---|---|---|
Property TaxesAnnual taxes levied by local governments on real estate properties. These taxes fund public services like schools, roads, and emergency services. | 11% | -$338 | -$4,057 |
InsuranceThe costs for insurance coverage to protect against financial losses due to risks like fire, natural disasters, theft, liability, or tenant-related damages. Calculation:Assumes 7% of gross rental income, unless insurance rates are specified. | 7% | -$224 | -$2,688 |
Property ManagementThe costs associated with hiring a property manager to handle the day-to-day operations of a rental property. Includes management fees, leasing fes, eviction fees, etc. Calculation:Assumes 8% of gross rental income. | 8% | -$256 | -$3,072 |
Repairs & MaintenanceOngoing costs for routine upkeep and minor fixes needed to keep a property in good working condition. Calculation:Assumes 5% of gross rental income. Varies by property age and condition. | 5% | -$160 | -$1,920 |
Capital ExpensesLarge, infrequent costs for major improvements or replacements, like a new roof, HVAC system, or appliances. Calculation:Assumes 5% of gross rental income. Varies by property age. | 5% | -$160 | -$1,920 |
HOA FeesRegular dues paid to a Homeowners Association for community maintenance, amenities, and management. Similar fees include: Condo Association Fees, Co-op Maintenance Fees, etc. | n/a | n/a | n/a |
Operating ExpensesRecurring costs required to maintain and manage a rental property, including property taxes, insurance, maintenance, repairs, utilities (if paid by the owner), property management fees, and other day-to-day expenses. Calculation:Insurance + Property Taxes + Property Management + Repairs & Maintenance + Capital Expenditures + HOA Fees | 36% | -$1,138 | -$13,657 |
Cash Flow
| Monthly | Yearly | |
|---|---|---|
Net Operating Income (NOI)The income generated from a property after deducting all operating expenses but before deducting mortgage payments, taxes, and capital expenditures. Calculation:Gross Operating Income - Operating Expenses
Net operating income:
| $1,870 | $22,440 |
Mortgage PaymentThe fixed amount a borrower pays each month to repay a loan. It typically includes principal and interest (P&I) and may also cover property taxes, insurance, HOA fees, and PMI if escrowed. | -$2,945 | -$35,340 |
Cash FlowNet Operating Income (NOI) minus mortgage payments. Calculation:NOI - Mortgage Payments | -$1,075 | -$12,900 |