$924,900
Investment Summary
- Monthly Cash Flow
- -$3,346
- Cap Rate
- 1.8%
- Cash-on-Cash Return
- -18.9%
- Debt Coverage Ratio
- 0.29
- Internal Rate of Return (5 years)
- -14.2%
Cash Flow
Net Operating Income (NOI) minus mortgage payments.
Calculation:
NOI - Mortgage Payments
Cap Rate (Market Value)
Capitalization Rate is a rate of return that compares the yearly Net Operating Income (NOI) to the market value.
Calculation:
NOI / Market Value
Cash-on-Cash Return (CoC)
Annual Cash Flow / Cash Invested
Calculation:
Annual cash flow divided by initial cash invested.
Debt Coverage Ratio (DCR)
Net Operating Income (NOI) divided by total debt payments.
Calculation:
NOI / Total Debt Payments
Internal Rate of Return (IRR)
A metric for assessing profitability over time. IRR is the discount rate at which the net present value (NPV) of all future cash flows (positive and negative) from an investment equals zero — including both periodic cash flow (such as rent) and a projected sale at the end of the holding period. It represents the expected annualized return, accounting for income, expenses, and the recovery of capital through a future sale.
Property Description
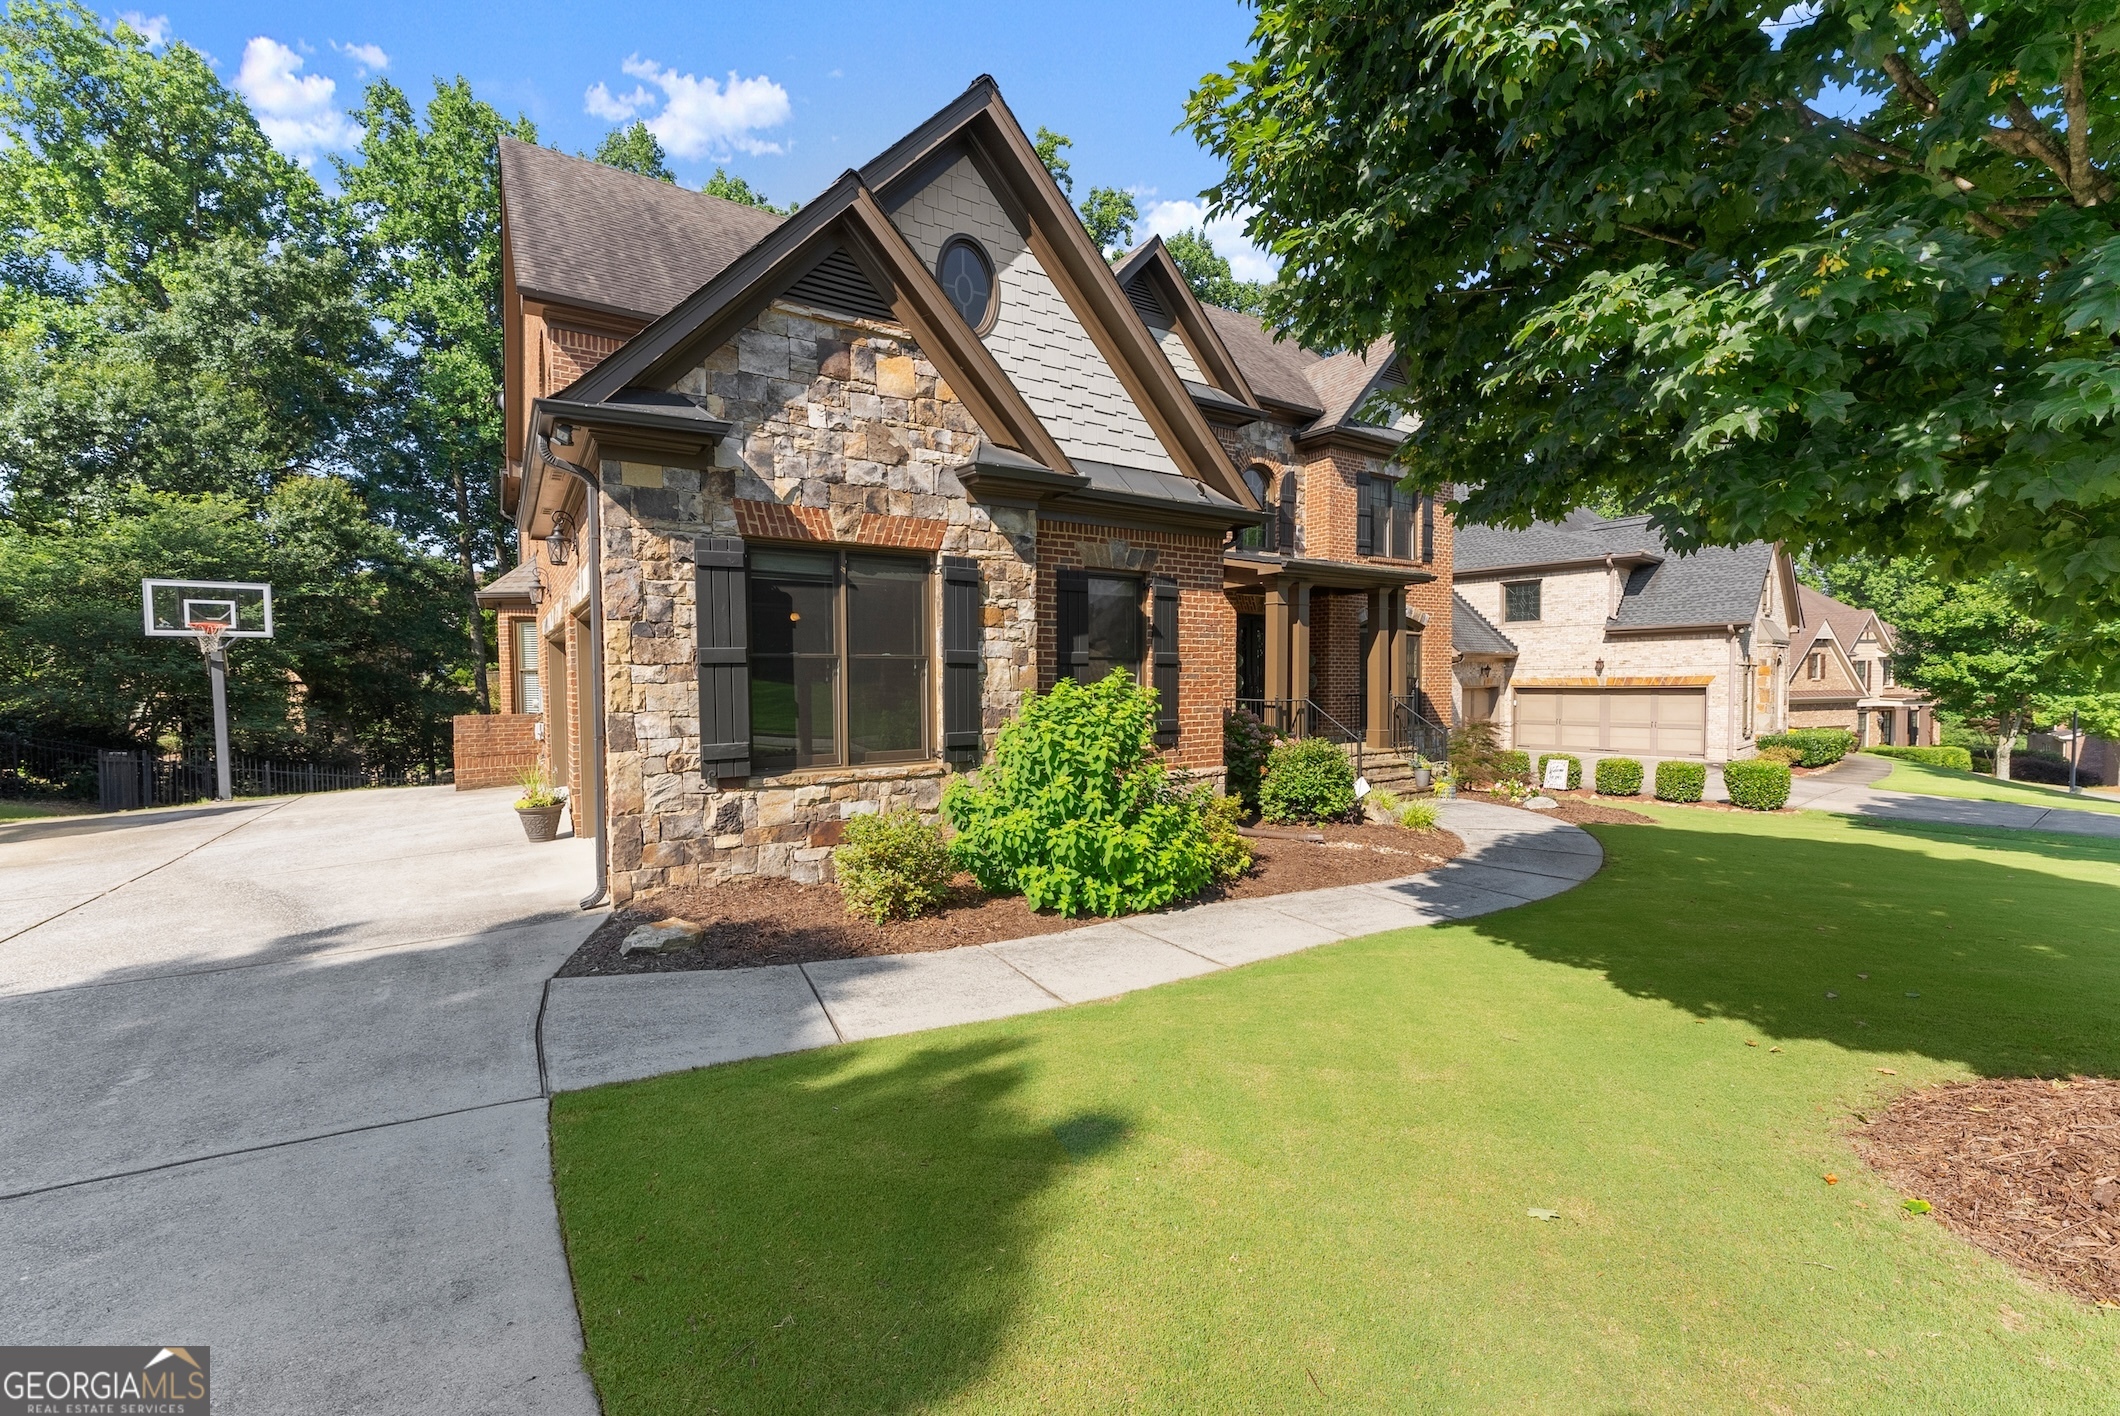
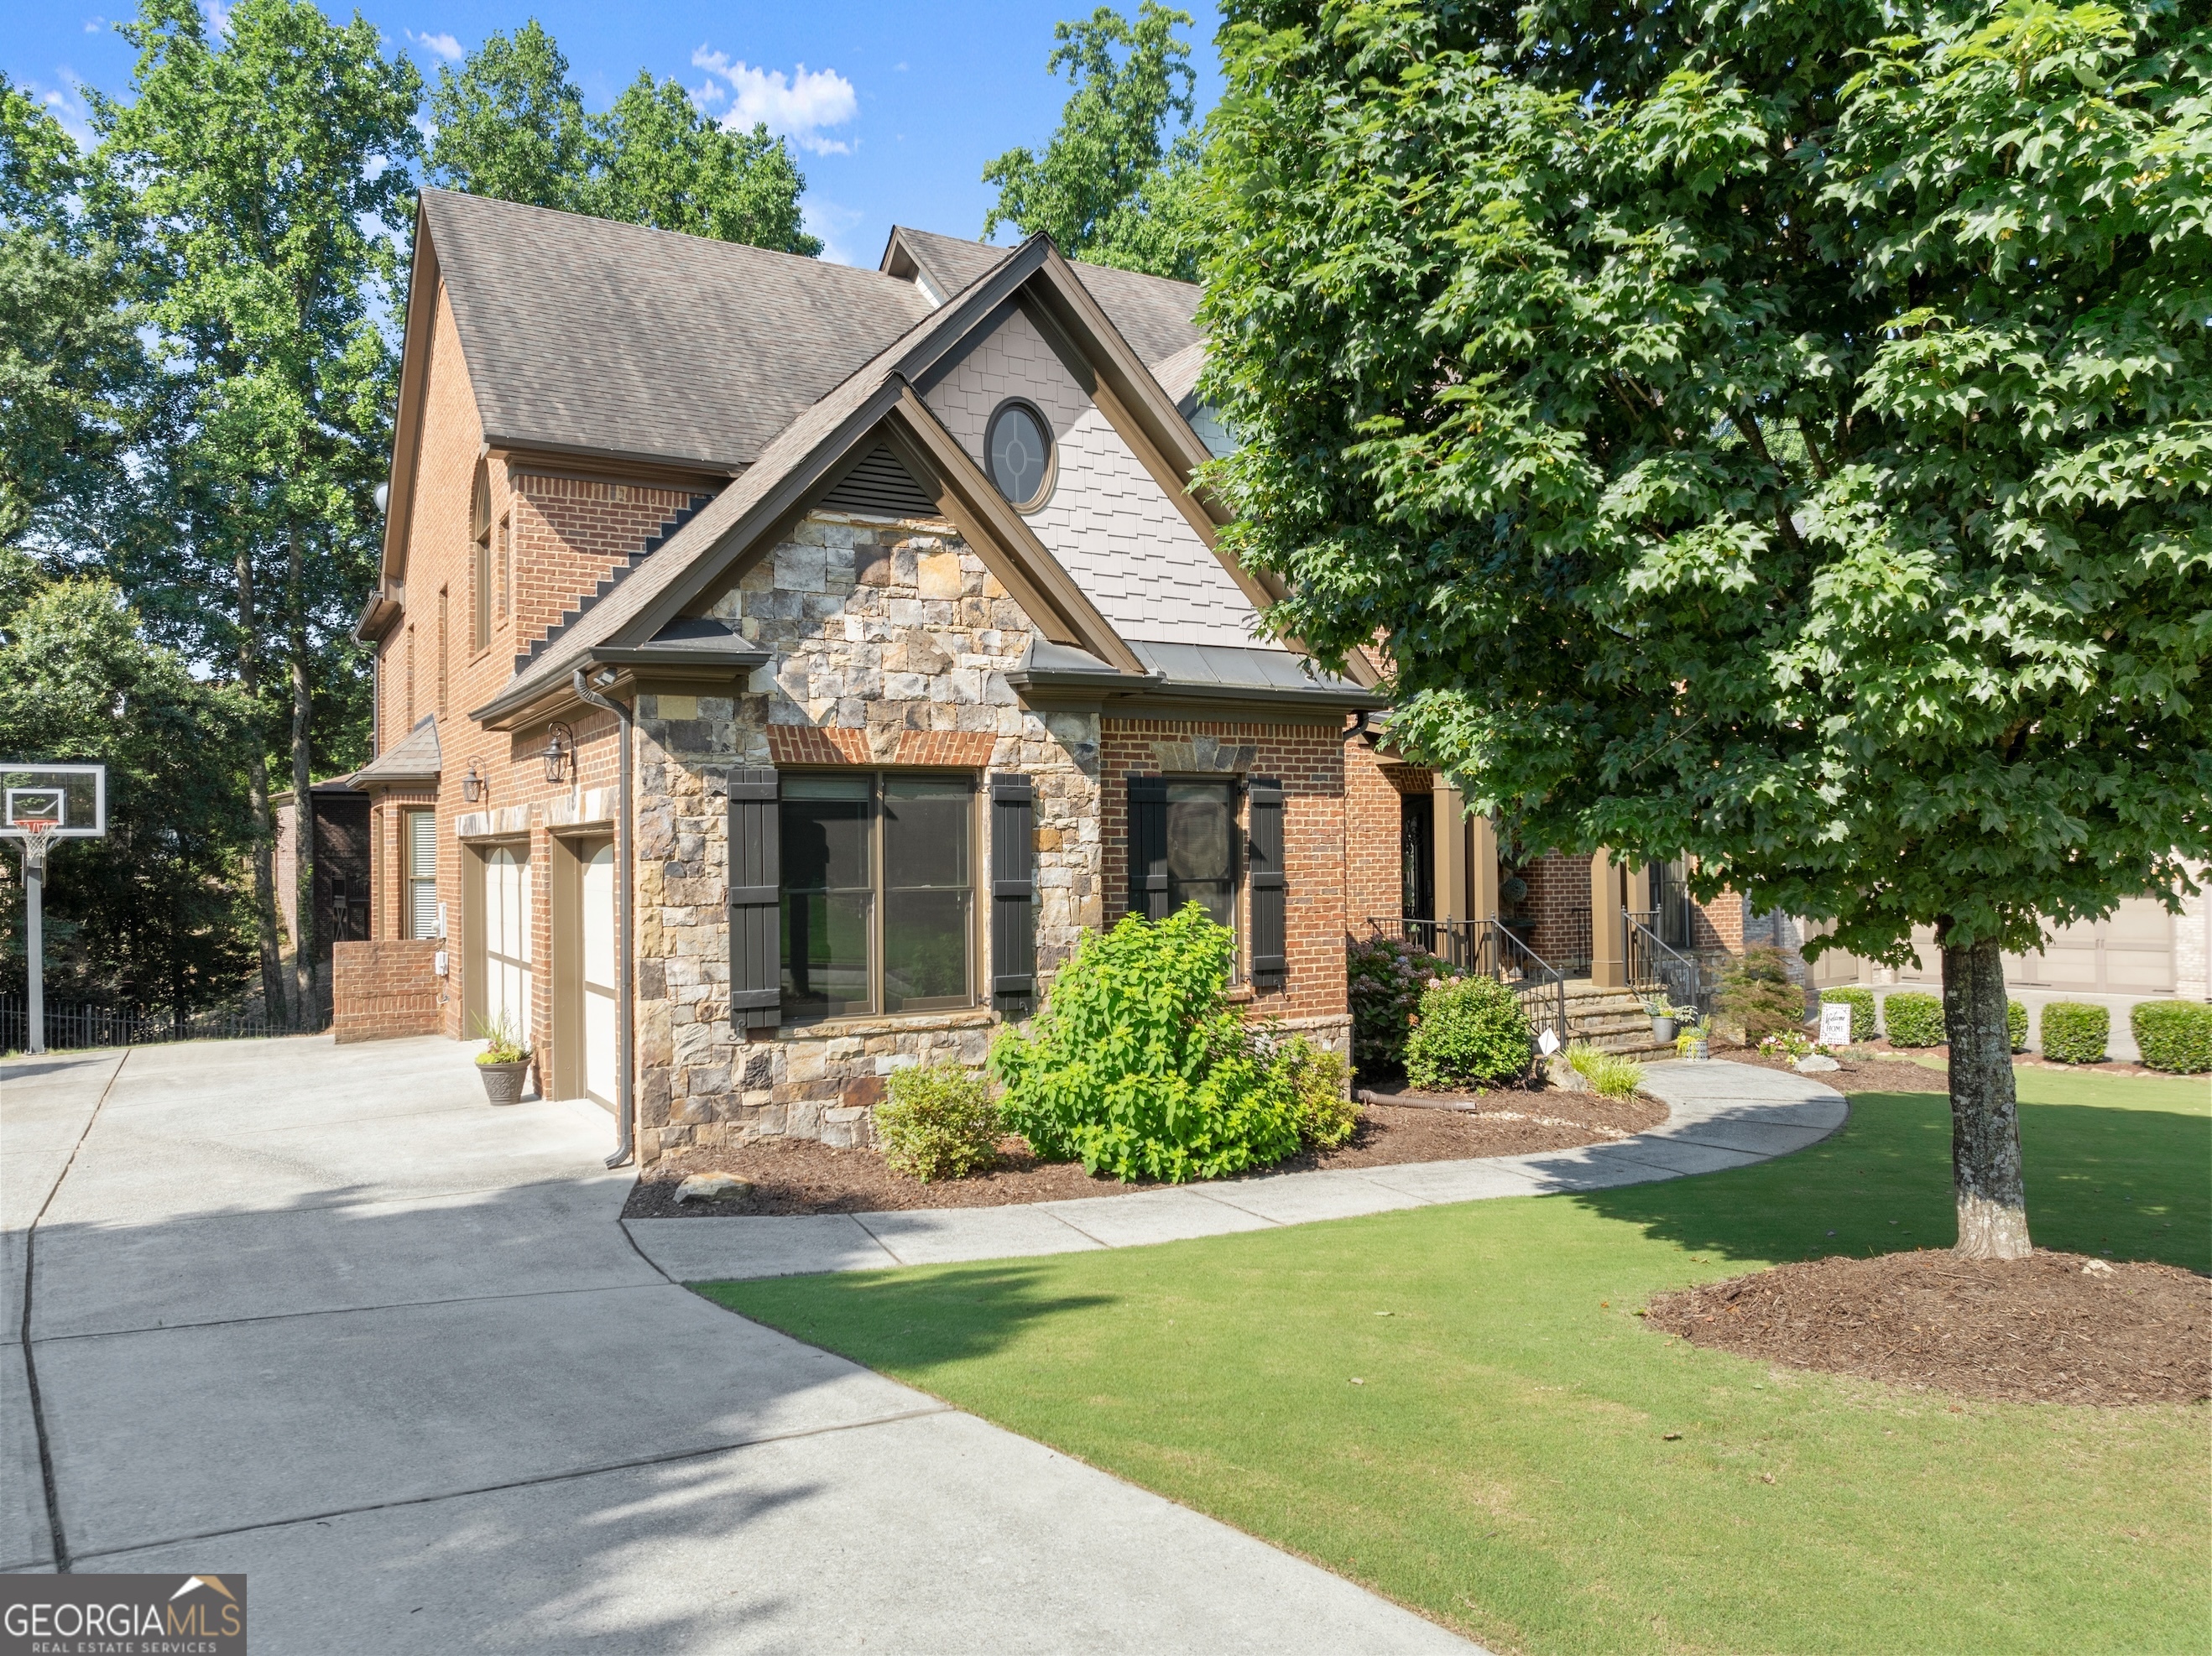
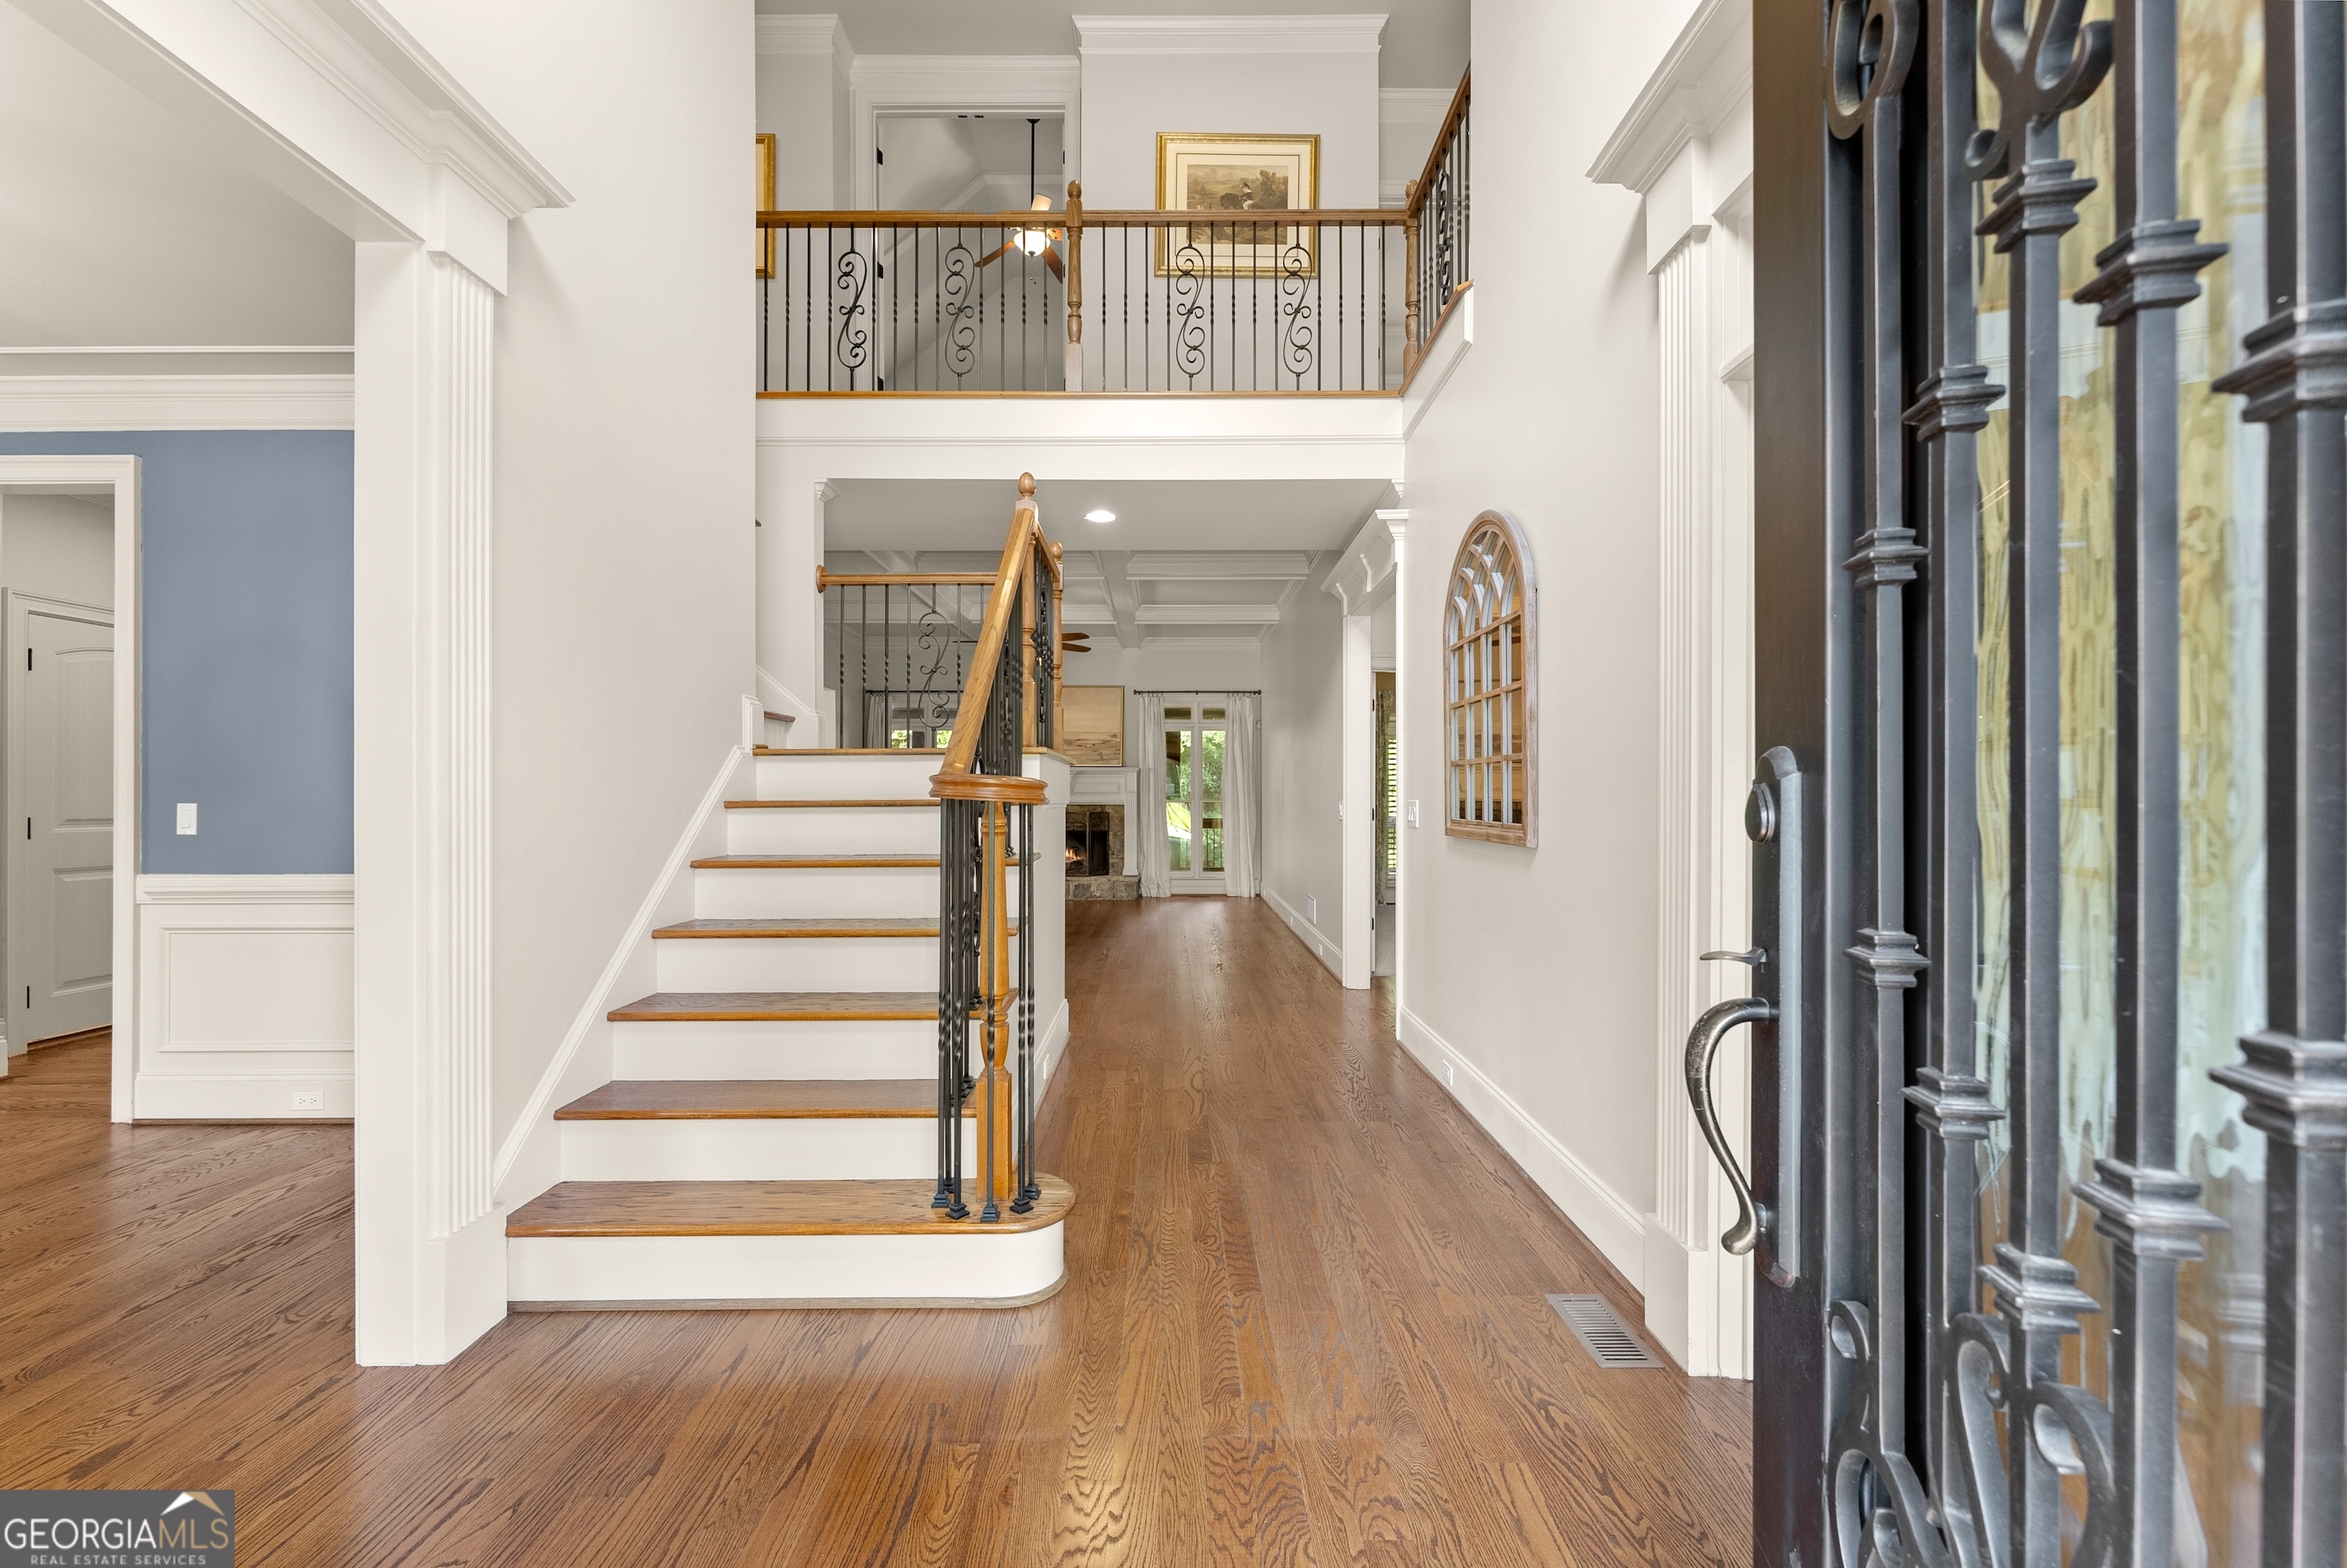
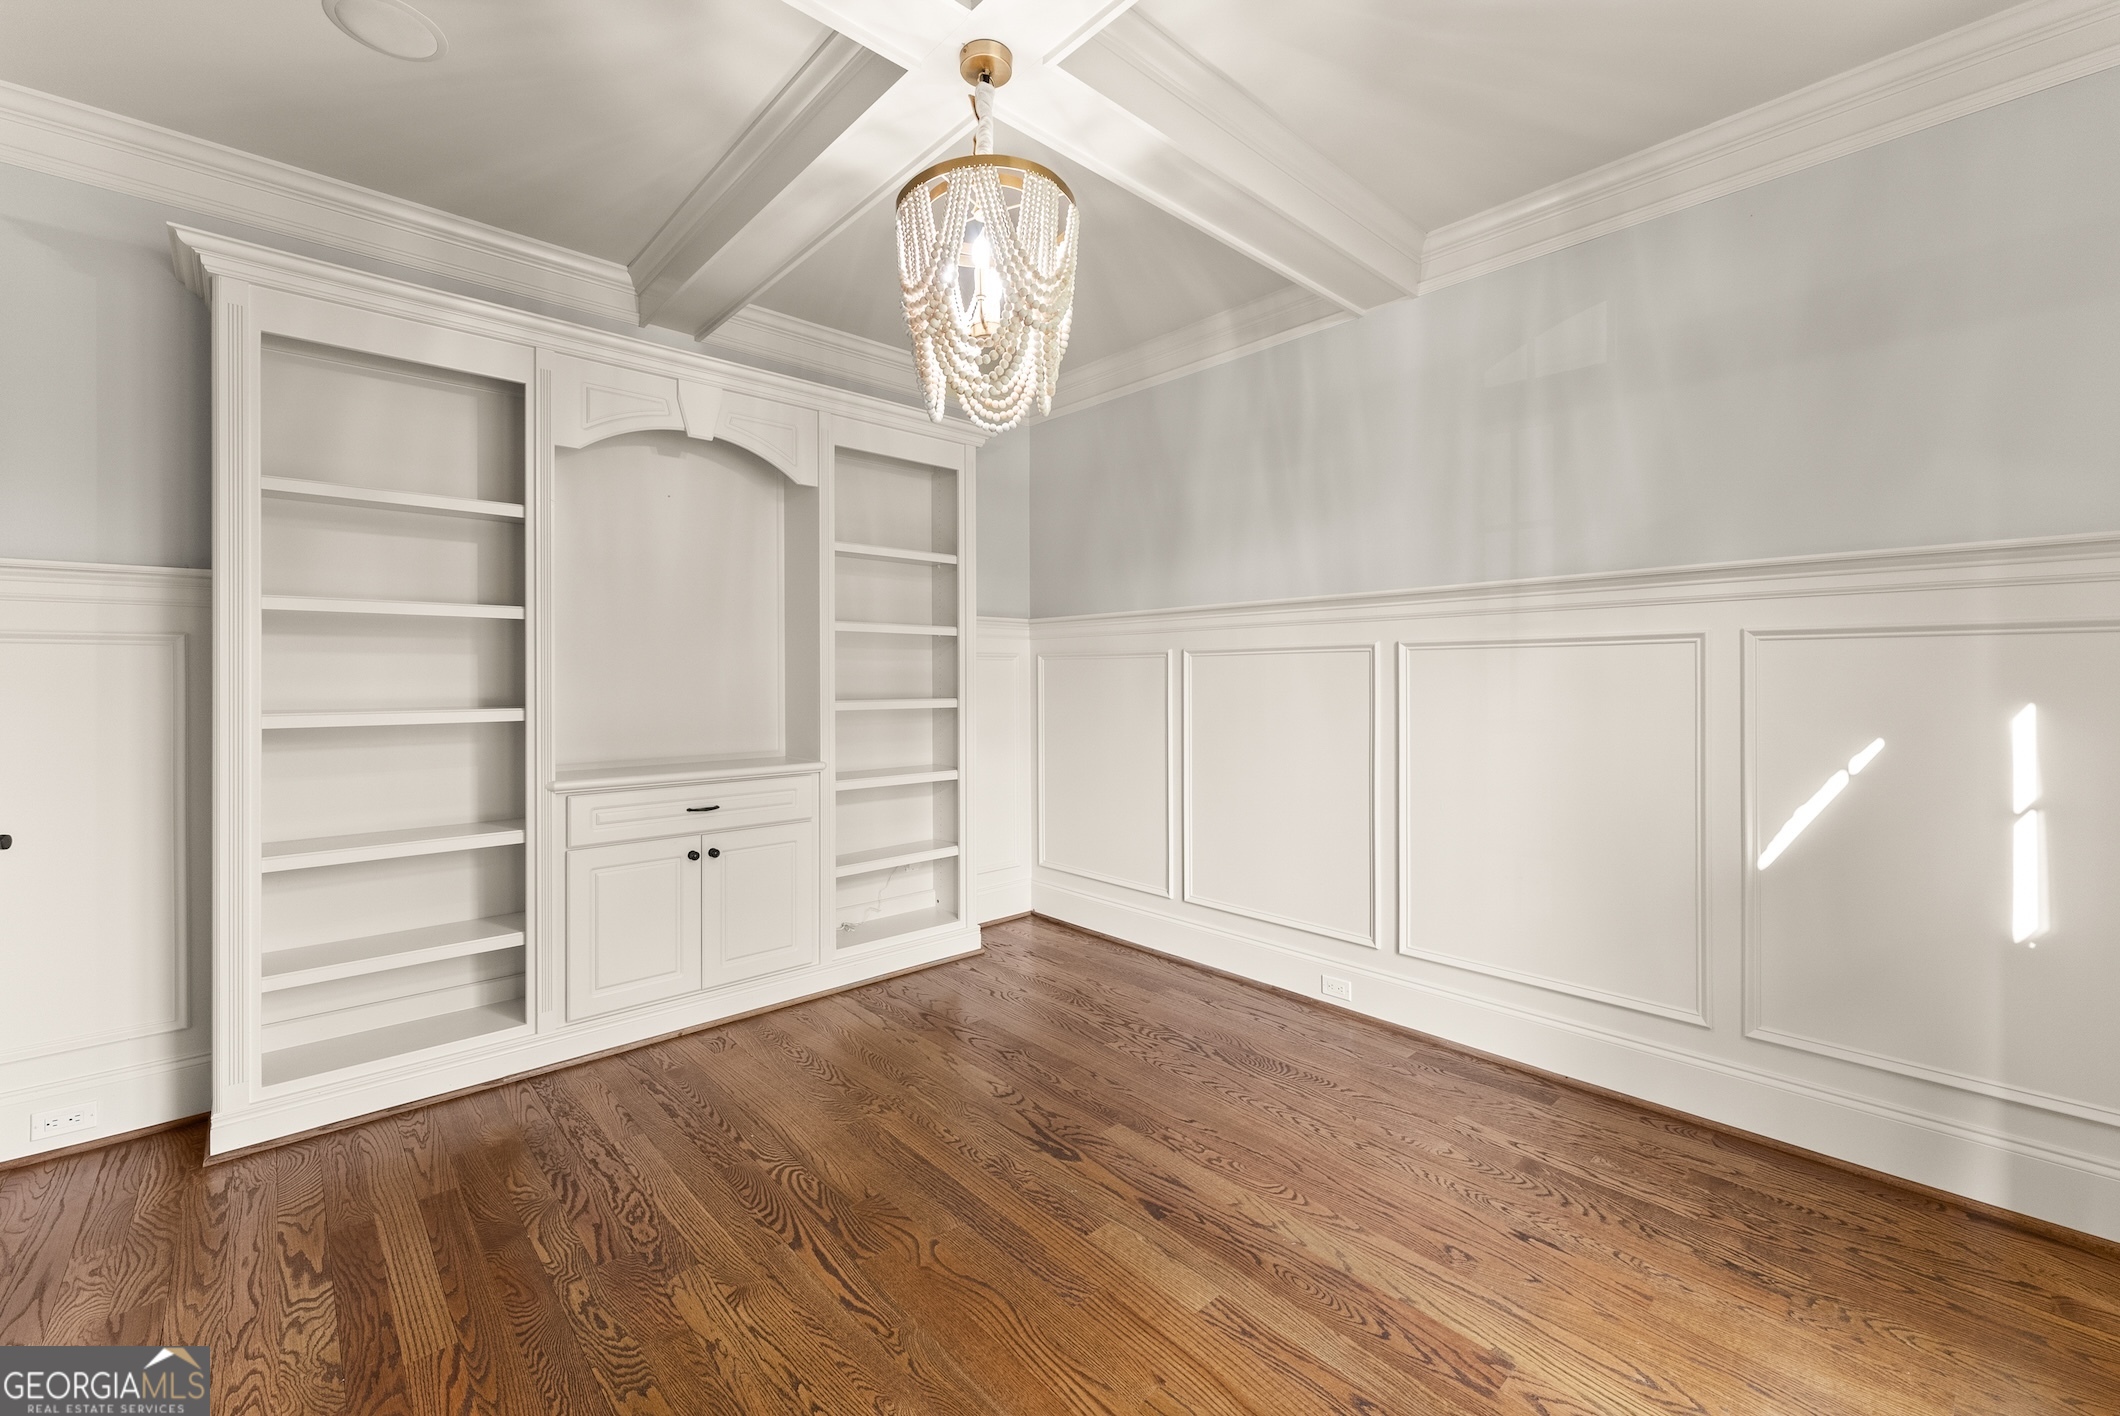
Exquisite Custom-Built Estate in Hedgerows | Seckinger High School Cluster Welcome to this meticulously maintained, custom-built masterpiece in the highly sought-after Hedgerows community, offering state-of-the-art amenities and located within the prestigious Seckinger High School district. This stunning home is the epitome of luxury, space, and functionality-boasting all the bells and whistles you could dream of! As you step through the grand custom iron doors, you're greeted by a spacious foyer that flows into a beautiful formal dining room with built-in cabinetry and dedicated office space with coffered ceilings and custom bookshelves. The main living room features a freshly painted coffered ceiling, elegant fireplace, and an open layout ideal for entertaining. The gourmet kitchen is a chef's dream-showcasing custom cabinetry, a paneled refrigerator for a sleek design, pot filler, gold accents, double island, warming drawer, wine fridge, and a spacious walk-in pantry. A cozy keeping room with fireplace and coffered ceilings sits just off the kitchen, with access to a screened-in deck that overlooks a lush, private backyard complete with a firepit and a tranquil creek-perfect for future pool installation. The main level also includes a powder room, ample storage, and a secondary suite with private bath-ideal for guests or multigenerational living. Upstairs, the luxurious primary suite offers a private sitting area with a fireplace, morning bar, oversized walk-in closet, and a large, bright primary bathroom that feels like a spa retreat. Three additional bedrooms on with an ensuite bathroom and 2 share a jack and jill bathroom and a large bonus/media room with vaulted ceiling and built-ins provides flexible space for entertainment or relaxation. The laundry room is conveniently located upstairs as well. The fully finished terrace level is an entertainer's paradise with a custom bar, coffered ceilings, and plenty of room for gatherings. The included pool table comes with a ping pong table topper, and the basement barstools and TVs throughout the home will remain with the property. There's also additional covered patio space under the deck for year-round outdoor enjoyment. Additional features include: Three-car garage Abundant built-in cabinetry throughout Quality construction and thoughtful details in every room Enjoy the exceptional amenities of Hedgerows-clubhouse, swimming pool, tennis courts, playground, walking trails, and even a neighborhood lacrosse/soccer field-all within minutes of shopping, dining, and top-rated schools. Too many features to list-this is a must-see! Schedule your private tour today and experience one of Hedgerows' finest homes.
Build Your Team
Quickly find investor-friendly professionals who can help you succeed in real estate investing at any stage of the investing journey.


Agents
Match with investor-friendly agents who can help you find, analyze, and close your next deal


Lenders
Get the best funding…find investor-friendly lenders who specialize in your deal strategy


Property Managers
Transition to passive investing. Find a trusted property management partnership that lasts.


Tax Pros & Accountants
Taxes and financial reporting made easy—find experts to create tax savings strategies, file taxes, and more
Location
Property Details
Parking
- Description: Attached, Garage, Garage Door Opener, Level Driveway
- Details: Attached, Garage, Garage Door Opener, Kitchen Level
- Garage Spaces: 3
- Spaces Total: 3
Bedroom Information
- # of Bedrooms: 5
Bathroom Information
- # of Baths (Full): 5
- # of Baths (Partial): 1
- # of Baths (Total): 5.5
Interior Features
- # of Rooms: 10
- # of Stories: 3
- Attic: Yes
- Basement: Yes
- Basement Description: Daylight, Exterior Entry, Finished, Full, Interior Entry
- Fireplace: Yes
Exterior Features
- Exterior Walls Materials: Brick
- Roof Type: Gable or Hip
- Roof Material: Composition
HOA
- Has HOA: Yes
- HOA Fee: $850/annually
Land Information
- Land Use: Residential
- Land Use Subtype: Single Family Residential
Lot Information
- Parcel ID: R7179351
- Lot Size: 0 sqft
Property Information
- Property Type: Single Family Residence
- Style: Brick 3 Side
- Year Built: 2007
Tax Information
- Annual Tax: $8,939
Utilities
- Water & Sewer: Public
- Heating: Central
- Cooling: Central Air
Location
- County: Gwinnett
Listing Details
Investment Summary
- Monthly Cash Flow
- -$3,346
- Cap Rate
- 1.8%
- Cash-on-Cash Return
- -18.9%
- Debt Coverage Ratio
- 0.29
- Internal Rate of Return (5 years)
- -14.2%
Cash Flow
Net Operating Income (NOI) minus mortgage payments.
Calculation:
NOI - Mortgage Payments
Cap Rate (Market Value)
Capitalization Rate is a rate of return that compares the yearly Net Operating Income (NOI) to the market value.
Calculation:
NOI / Market Value
Cash-on-Cash Return (CoC)
Annual Cash Flow / Cash Invested
Calculation:
Annual cash flow divided by initial cash invested.
Debt Coverage Ratio (DCR)
Net Operating Income (NOI) divided by total debt payments.
Calculation:
NOI / Total Debt Payments
Internal Rate of Return (IRR)
A metric for assessing profitability over time. IRR is the discount rate at which the net present value (NPV) of all future cash flows (positive and negative) from an investment equals zero — including both periodic cash flow (such as rent) and a projected sale at the end of the holding period. It represents the expected annualized return, accounting for income, expenses, and the recovery of capital through a future sale.
Purchase Details
Purchase PriceThe price paid for the property. Purchase price:
| $924,900 |
|---|---|
Amount FinancedThe amount of the purchase financed through a loan. Amount financed:
| -$739,920 |
Down paymentThe initial payment made towards the purchase. Down payment:
| $184,980 |
Closing CostsFees and expenses associated with purchasing a property, typically ranging from 2% to 5% of the home’s purchase price, paid at the end of a home purchase to cover services like lending, title transfer, and taxes. Closing costs:
| $27,747 |
Rehab CostsCosts incurred to repair or improve the property, including: roof, flooring, exterior siding, kitchen, exterior paint, bathrooms, etc. Rehab costs:
| $0 |
Initial Cash InvestedThe total initial cash invested in the property. Calculation:Down payment + Buying costs + Rehab costs Initial cash invested:
| $212,727 |
Square Feet (SQFT)The total square footage of the property. Square feet:
| 5,788 |
Cost Per Square FootCost per square foot of the property. Calculation:Purchase Price / Square Feet Cost per square foot:
| $160 |
Monthly Rent Per Square FootMonthly rent divided by the number of square feet. This ratio helps investors compare rental income efficiency across properties, markets, and unit sizes Calculation:Monthly Rent / Square Feet Monthly rent per square foot:
| $0.55 |
Financing Details
Loan AmountThe total sum of money borrowed from a lender to finance a property purchase. Calculation:Purchase Price - Down Payment
Loan amount:
| $739,920 |
|---|---|
Loan to Value Ratio (LTV)Loan amount divided by the market value of the property. Calculation:Loan Amount / Market Value
Loan to value ratio:
| 80.0% |
Loan TypeThe type of loan (e.g., fixed, adjustable).
Loan type:
| Amortizing |
TermThe loan repayment period in years.
Term:
| 30 years |
Interest RateThe percentage a lender charges on the borrowed amount of a loan, determining the cost of borrowing money.
Interest rate:
| 6.625% |
Principal & Interest (PI)The principal is the portion of the loan payment that reduces the loan balance. The interest is the lender's charge for borrowing money. Calculation:(P * r * (1 + r) ** n) / ((1 + r) ** n - 1) Where:
P = Loan amount (principal)
Principal & interest:
| $4,738 |
Property TaxesAnnual taxes levied by local governments on real estate properties. These taxes fund public services like schools, roads, and emergency services.
Property tax:
| $745 |
InsuranceThe costs for insurance coverage to protect against financial losses due to risks like fire, natural disasters, theft, liability, or tenant-related damages. Calculation:Assumes 7% of gross rental income, unless insurance rates are specified.
Insurance:
| $224 |
Private Mortgage Insurance (PMI)A fee that borrowers pay when they take out a conventional loan with a loan-to-value (LTV) ratio above 80%.
Private mortgage insurance (PMI):
| $0 |
Monthly PaymentThe fixed amount a borrower pays each month to repay a loan. It typically includes principal and interest (P&I) and may also cover property taxes, insurance, HOA fees, and PMI if escrowed. Monthly payment:
| $5,707 |
Operating Income
| % Rent | Monthly | Yearly | |
|---|---|---|---|
Gross RentThe total rental income received from tenants before deducting any expenses. Includes base rent, late fees, pet fees, parking fees, and other recurring charges.
Gross rent:
| $3,200 | $38,400 | |
Vacancy LossExpected loss of rent due to vacancies.
Vacancy loss:
(6%)
| 6% | -$192 | -$2,304 |
Operating IncomeGross rental income minus vacancy loss. Calculation:Gross rent - Vacancy loss
Operating income:
| $3,008 | $36,096 |
Operating Expenses
| % Rent | Monthly | Yearly | |
|---|---|---|---|
Property TaxesAnnual taxes levied by local governments on real estate properties. These taxes fund public services like schools, roads, and emergency services. | 23% | -$745 | -$8,940 |
InsuranceThe costs for insurance coverage to protect against financial losses due to risks like fire, natural disasters, theft, liability, or tenant-related damages. Calculation:Assumes 7% of gross rental income, unless insurance rates are specified. | 7% | -$224 | -$2,688 |
Property ManagementThe costs associated with hiring a property manager to handle the day-to-day operations of a rental property. Includes management fees, leasing fes, eviction fees, etc. Calculation:Assumes 8% of gross rental income. | 8% | -$256 | -$3,072 |
Repairs & MaintenanceOngoing costs for routine upkeep and minor fixes needed to keep a property in good working condition. Calculation:Assumes 5% of gross rental income. Varies by property age and condition. | 5% | -$160 | -$1,920 |
Capital ExpensesLarge, infrequent costs for major improvements or replacements, like a new roof, HVAC system, or appliances. Calculation:Assumes 5% of gross rental income. Varies by property age. | 5% | -$160 | -$1,920 |
HOA FeesRegular dues paid to a Homeowners Association for community maintenance, amenities, and management. Similar fees include: Condo Association Fees, Co-op Maintenance Fees, etc. | 2% | -$71 | -$852 |
Operating ExpensesRecurring costs required to maintain and manage a rental property, including property taxes, insurance, maintenance, repairs, utilities (if paid by the owner), property management fees, and other day-to-day expenses. Calculation:Insurance + Property Taxes + Property Management + Repairs & Maintenance + Capital Expenditures + HOA Fees | 51% | -$1,616 | -$19,392 |
Cash Flow
| Monthly | Yearly | |
|---|---|---|
Net Operating Income (NOI)The income generated from a property after deducting all operating expenses but before deducting mortgage payments, taxes, and capital expenditures. Calculation:Gross Operating Income - Operating Expenses
Net operating income:
| $1,392 | $16,704 |
Mortgage PaymentThe fixed amount a borrower pays each month to repay a loan. It typically includes principal and interest (P&I) and may also cover property taxes, insurance, HOA fees, and PMI if escrowed. | -$4,738 | -$56,856 |
Cash FlowNet Operating Income (NOI) minus mortgage payments. Calculation:NOI - Mortgage Payments | $3,346 | $40,152 |