30519 Investment Properties for Sale
Browse homes for sale and investment properties in 30519. Refine your search by price, property type, or more.
Best cash flowing properties in 30519
Active
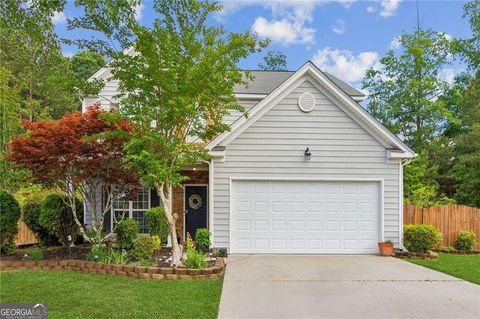
$380,000
4
bds
|
2
ba
|
0
sqft
|
built
1992
3202 Windgate Dr, Buford, GA 30519
$-699
Cash flow
-9.6%
Cash-on-Cash Return
3.9%
Cap rate
0.6%
Rent to Value Ratio
Active
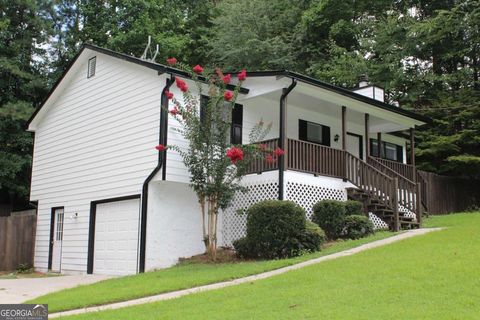
$369,000
4
bds
|
3
ba
|
0
sqft
|
built
1994
3310 Windward Gate Ln, Buford, GA 30519
$-704
Cash flow
-10.0%
Cash-on-Cash Return
3.9%
Cap rate
0.6%
Rent to Value Ratio
122 out of 130 properties for sale in 30519
Limited Results Shown
Create a free account, or log in to reveal all property listings and enjoy the complete experience.
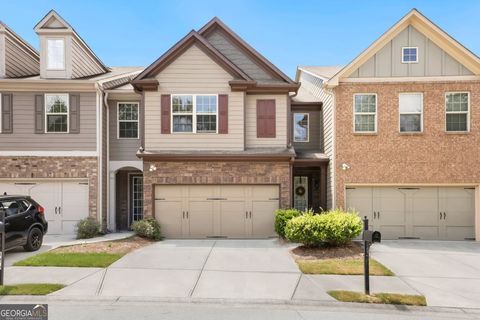
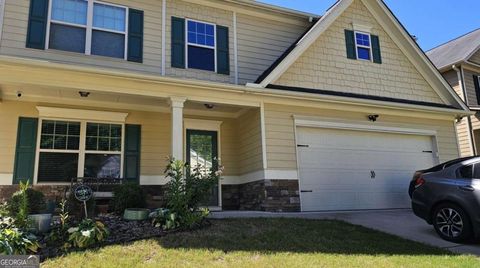
Active
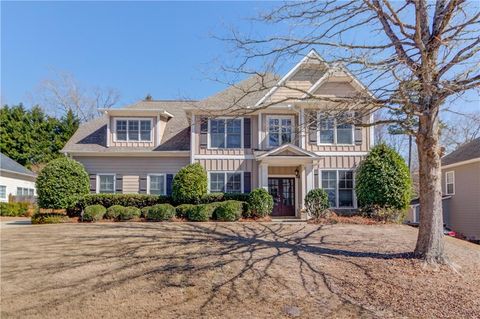
$625,000
4
bds
|
3
ba
|
3,118
sqft
|
built
2021
3606 Andover Way, Buford, GA 30519
$-1,791
Cash flow
-15.0%
Cash-on-Cash Return
2.7%
Cap rate
0.5%
Rent to Value Ratio

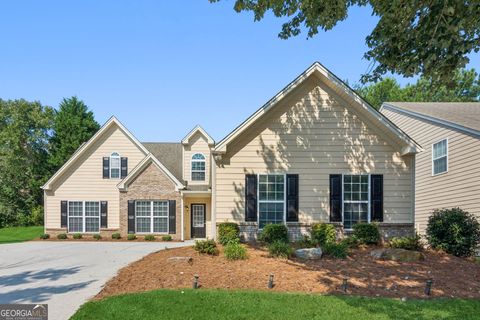
Active
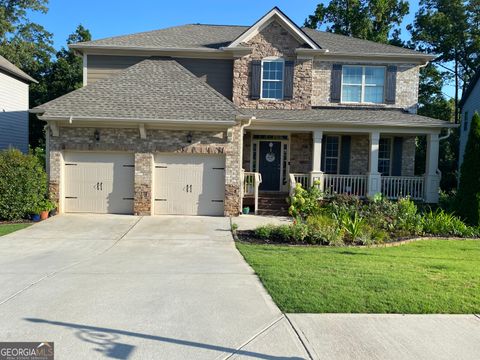
$519,000
5
bds
|
3
ba
|
0
sqft
|
built
2013
3248 Sag Harbor Ct, Buford, GA 30519
$-1,458
Cash flow
-14.7%
Cash-on-Cash Return
2.8%
Cap rate
0.5%
Rent to Value Ratio
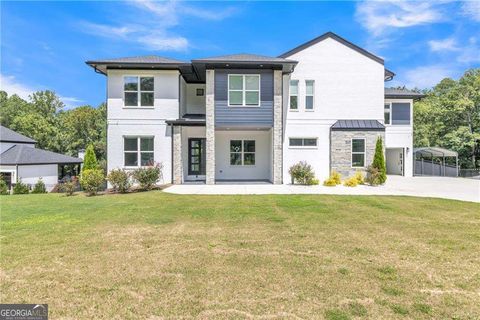
Active
$395,000
3
bds
|
3
ba
|
0
sqft
|
built
2021
2378 Morgan Creek Rd, Buford, GA 30519
$-782
Cash flow
-10.3%
Cash-on-Cash Return
3.8%
Cap rate
0.6%
Rent to Value Ratio
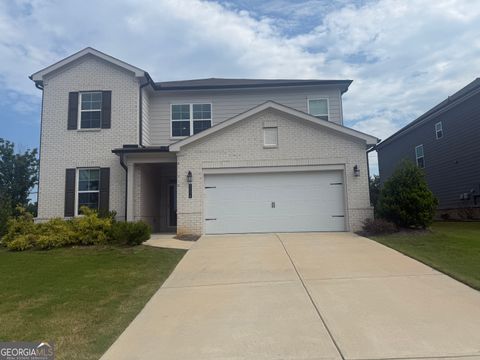
Active
$359,000
3
bds
|
2.5
ba
|
1,956
sqft
|
built
2013
3315 Sardis Bend Dr, Buford, GA 30519
$-785
Cash flow
-11.4%
Cash-on-Cash Return
3.5%
Cap rate
0.6%
Rent to Value Ratio
Active
$850,000
5
bds
|
4
ba
|
4,143
sqft
|
built
2006
2953 Springbluff Ln, Buford, GA 30519
$-3,071
Cash flow
-18.9%
Cash-on-Cash Return
1.8%
Cap rate
0.4%
Rent to Value Ratio
Active
$549,000
5
bds
|
3
ba
|
2,938
sqft
|
built
2001
3102 Seneca Farm Ln, Buford, GA 30519
$-1,453
Cash flow
-13.8%
Cash-on-Cash Return
3.0%
Cap rate
0.5%
Rent to Value Ratio
Active
$419,000
4
bds
|
3
ba
|
0
sqft
|
built
2001
3066 Gem Creek Rd, Buford, GA 30519
$-1,110
Cash flow
-13.8%
Cash-on-Cash Return
3.0%
Cap rate
0.5%
Rent to Value Ratio
Active
$479,900
4
bds
|
3
ba
|
0
sqft
|
built
2014
4271 Haywater Cv, Buford, GA 30519
$-1,156
Cash flow
-12.6%
Cash-on-Cash Return
3.3%
Cap rate
0.5%
Rent to Value Ratio
Active
$671,000
5
bds
|
4.5
ba
|
0
sqft
|
built
2020
2066 Holland Creek Ct, Buford, GA 30519
$-2,170
Cash flow
-16.9%
Cash-on-Cash Return
2.3%
Cap rate
0.4%
Rent to Value Ratio
Active
$367,000
3
bds
|
2.5
ba
|
1,968
sqft
|
built
2014
3669 Brockenhurst Dr, Buford, GA 30519
$-752
Cash flow
-10.7%
Cash-on-Cash Return
3.7%
Cap rate
0.6%
Rent to Value Ratio
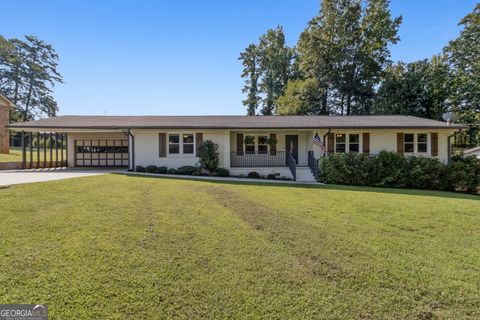
Active
$599,000
3
bds
|
3
ba
|
2,837
sqft
|
built
1964
2410 Thrasher Rd, Buford, GA 30519
$-1,400
Cash flow
-12.2%
Cash-on-Cash Return
3.3%
Cap rate
0.4%
Rent to Value Ratio
Active
$399,900
3
bds
|
2
ba
|
0
sqft
|
built
2000
4556 Duane Dr, Buford, GA 30519
$-898
Cash flow
-11.7%
Cash-on-Cash Return
3.5%
Cap rate
0.6%
Rent to Value Ratio
Active
$449,000
4
bds
|
3
ba
|
2,242
sqft
|
built
2015
2436 Loughridge Dr, Buford, GA 30519
$-887
Cash flow
-10.3%
Cash-on-Cash Return
3.8%
Cap rate
0.6%
Rent to Value Ratio
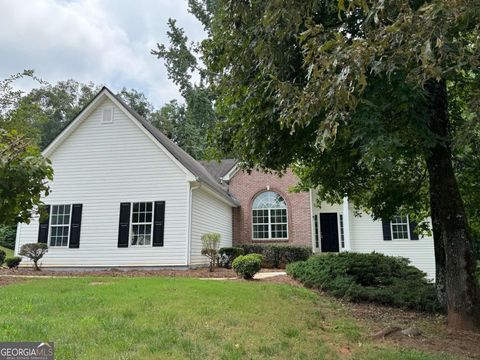
Active
$525,300
4
bds
|
2.5
ba
|
3,122
sqft
|
built
2014
4457 Water Mill Dr, Buford, GA 30519
$-1,211
Cash flow
-12.0%
Cash-on-Cash Return
3.4%
Cap rate
0.6%
Rent to Value Ratio
Active
$449,950
4
bds
|
3
ba
|
2,664
sqft
|
built
2007
2818 Suttonwood Way, Buford, GA 30519
$-932
Cash flow
-10.8%
Cash-on-Cash Return
3.7%
Cap rate
0.6%
Rent to Value Ratio
Active
$345,000
4
bds
|
2.5
ba
|
0
sqft
|
built
2008
2433 Sardis Chase Ct, Buford, GA 30519
$-1,081
Cash flow
-16.3%
Cash-on-Cash Return
2.4%
Cap rate
0.6%
Rent to Value Ratio
Active
$1,999,900
5
bds
|
6
ba
|
8,458
sqft
|
built
2022
3671 Hamilton Mill Rd, Buford, GA 30519
$-8,293
Cash flow
-21.6%
Cash-on-Cash Return
1.2%
Cap rate
0.3%
Rent to Value Ratio
Active
$599,000
5
bds
|
4
ba
|
3,379
sqft
|
built
2021
3334 Long Creek Dr, Buford, GA 30519
$-1,284
Cash flow
-11.2%
Cash-on-Cash Return
3.6%
Cap rate
0.5%
Rent to Value Ratio
Active
$2,200,000
5
bds
|
5
ba
|
5,716
sqft
|
built
1997
2760 Camp Branch Rd, Buford, GA 30519
$-6,818
Cash flow
-16.2%
Cash-on-Cash Return
2.4%
Cap rate
0.4%
Rent to Value Ratio
Active
$475,000
4
bds
|
3
ba
|
2,166
sqft
|
built
1999
3737 Victoria Dr, Buford, GA 30519
$-949
Cash flow
-10.4%
Cash-on-Cash Return
3.7%
Cap rate
0.5%
Rent to Value Ratio
Active
$800,000
6
bds
|
5
ba
|
4,592
sqft
|
built
2006
4731 Moon Chase Dr, Buford, GA 30519
$-2,430
Cash flow
-15.8%
Cash-on-Cash Return
2.5%
Cap rate
0.4%
Rent to Value Ratio
Active
$739,000
4
bds
|
3
ba
|
1,652
sqft
|
built
1981
3105 Hamilton Mill Rd, Buford, GA 30519
$-2,655
Cash flow
-18.7%
Cash-on-Cash Return
1.8%
Cap rate
0.3%
Rent to Value Ratio
Active
$3,800,000
6
bds
|
6
ba
|
11,000
sqft
|
built
2017
2305 Braselton Hwy, Buford, GA 30519
$-17,974
Cash flow
-24.7%
Cash-on-Cash Return
0.5%
Cap rate
0.2%
Rent to Value Ratio
Active
$605,000
4
bds
|
3.5
ba
|
0
sqft
|
built
2021
3075 Andover Trl, Buford, GA 30519
$-1,842
Cash flow
-15.9%
Cash-on-Cash Return
2.5%
Cap rate
0.5%
Rent to Value Ratio
Active
$611,000
5
bds
|
4
ba
|
3,482
sqft
|
built
2019
4398 Mantova Dr, Buford, GA 30519
$-1,698
Cash flow
-14.5%
Cash-on-Cash Return
2.8%
Cap rate
0.5%
Rent to Value Ratio
Active
$599,900
6
bds
|
4
ba
|
0
sqft
|
built
2004
3828 Morning Meadow Ln, Buford, GA 30519
$-1,752
Cash flow
-15.2%
Cash-on-Cash Return
2.6%
Cap rate
0.5%
Rent to Value Ratio
Active
$410,000
3
bds
|
2.5
ba
|
2,244
sqft
|
built
2000
2173 Beacon Crest Dr, Buford, GA 30519
$-1,070
Cash flow
-13.6%
Cash-on-Cash Return
3.0%
Cap rate
0.6%
Rent to Value Ratio

Active
$315,000
3
bds
|
3
ba
|
0
sqft
|
built
2006
3051 Cedar Glade Ln, Buford, GA 30519
$-869
Cash flow
-14.4%
Cash-on-Cash Return
2.8%
Cap rate
0.6%
Rent to Value Ratio
Active
$389,000
3
bds
|
2
ba
|
1,872
sqft
|
built
1990
2571 Hamill Dr, Buford, GA 30519
$-745
Cash flow
-10.0%
Cash-on-Cash Return
3.8%
Cap rate
0.5%
Rent to Value Ratio
Active
$509,000
5
bds
|
3
ba
|
0
sqft
|
built
2003
4155 Cami Way, Buford, GA 30519
$-1,259
Cash flow
-12.9%
Cash-on-Cash Return
3.2%
Cap rate
0.6%
Rent to Value Ratio
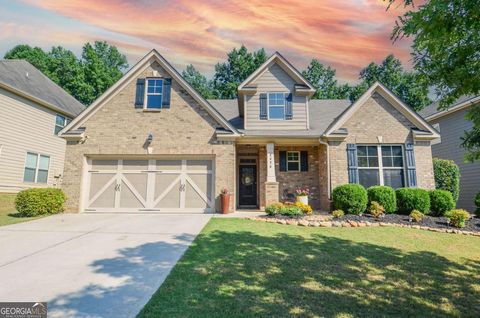
Active
$645,000
4
bds
|
3
ba
|
3,004
sqft
|
built
2016
1320 Newbridge Cir, Buford, GA 30519
$-1,642
Cash flow
-13.3%
Cash-on-Cash Return
3.1%
Cap rate
0.5%
Rent to Value Ratio
Active
$439,000
4
bds
|
2.5
ba
|
3,017
sqft
|
built
1994
1742 Ivy Pine Ct, Buford, GA 30519
$-997
Cash flow
-11.8%
Cash-on-Cash Return
3.4%
Cap rate
0.6%
Rent to Value Ratio

Active
$385,000
3
bds
|
2
ba
|
1,732
sqft
|
built
1999
4642 Devencrest Ln, Buford, GA 30519
$-892
Cash flow
-12.1%
Cash-on-Cash Return
3.4%
Cap rate
0.6%
Rent to Value Ratio
Active
$700,000
5
bds
|
4
ba
|
3,648
sqft
|
built
2014
2587 Summer Song Way, Buford, GA 30519
$-1,985
Cash flow
-14.8%
Cash-on-Cash Return
2.7%
Cap rate
0.5%
Rent to Value Ratio

Active
$420,000
5
bds
|
3
ba
|
2,931
sqft
|
built
2006
2148 Splitrail Trl, Buford, GA 30519
$-777
Cash flow
-9.7%
Cash-on-Cash Return
3.9%
Cap rate
0.7%
Rent to Value Ratio
Active
$579,900
6
bds
|
4
ba
|
3,425
sqft
|
built
2017
4132 Rovello Way, Buford, GA 30519
$-1,452
Cash flow
-13.1%
Cash-on-Cash Return
3.1%
Cap rate
0.6%
Rent to Value Ratio
Active
$450,000
4
bds
|
2.5
ba
|
0
sqft
|
built
1998
2415 Hamilton Parc Ln, Buford, GA 30519
$-1,179
Cash flow
-13.7%
Cash-on-Cash Return
3.0%
Cap rate
0.6%
Rent to Value Ratio

Active
$395,000
4
bds
|
2.5
ba
|
2,565
sqft
|
built
1993
3230 Ivy Lake Dr, Buford, GA 30519
$-863
Cash flow
-11.4%
Cash-on-Cash Return
3.5%
Cap rate
0.6%
Rent to Value Ratio