$698,000
Investment Summary
- Monthly Cash Flow
- -$973
- Cap Rate
- 4.5%
- Cash-on-Cash Return
- -7.3%
- Debt Coverage Ratio
- 0.73
- Internal Rate of Return (5 years)
- -3.1%
Cash Flow
Net Operating Income (NOI) minus mortgage payments.
Calculation:
NOI - Mortgage Payments
Cap Rate (Market Value)
Capitalization Rate is a rate of return that compares the yearly Net Operating Income (NOI) to the market value.
Calculation:
NOI / Market Value
Cash-on-Cash Return (CoC)
Annual Cash Flow / Cash Invested
Calculation:
Annual cash flow divided by initial cash invested.
Debt Coverage Ratio (DCR)
Net Operating Income (NOI) divided by total debt payments.
Calculation:
NOI / Total Debt Payments
Internal Rate of Return (IRR)
A metric for assessing profitability over time. IRR is the discount rate at which the net present value (NPV) of all future cash flows (positive and negative) from an investment equals zero — including both periodic cash flow (such as rent) and a projected sale at the end of the holding period. It represents the expected annualized return, accounting for income, expenses, and the recovery of capital through a future sale.
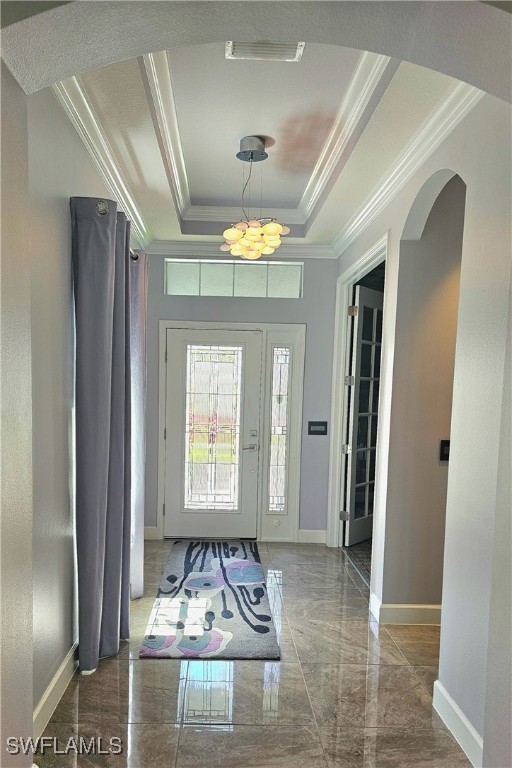
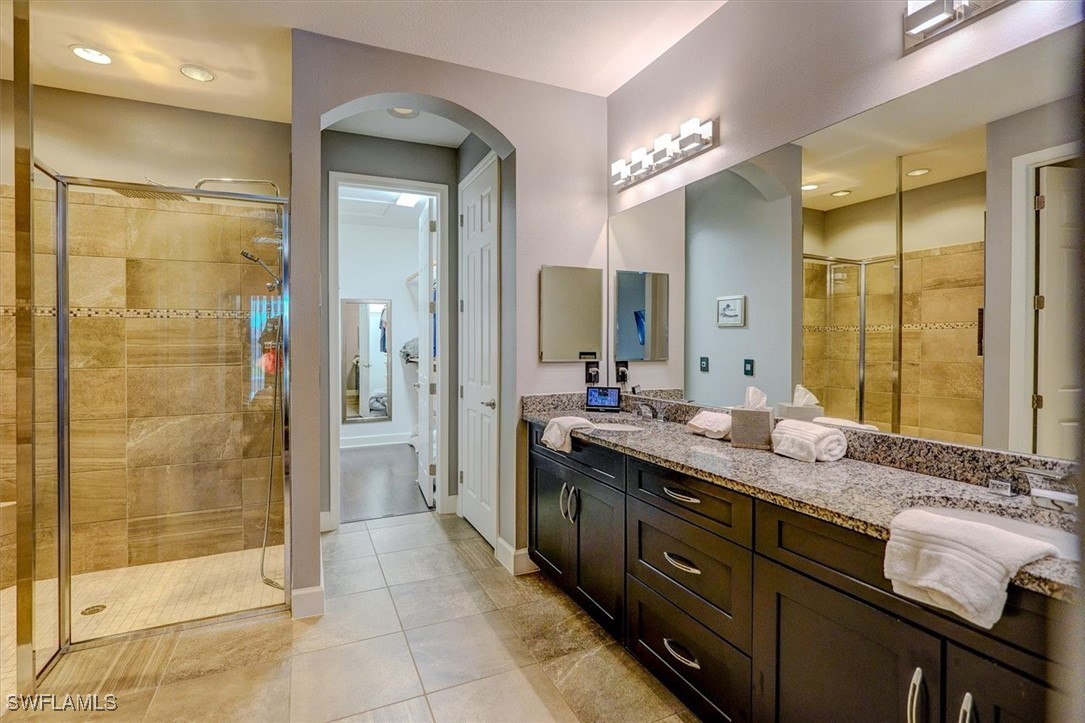
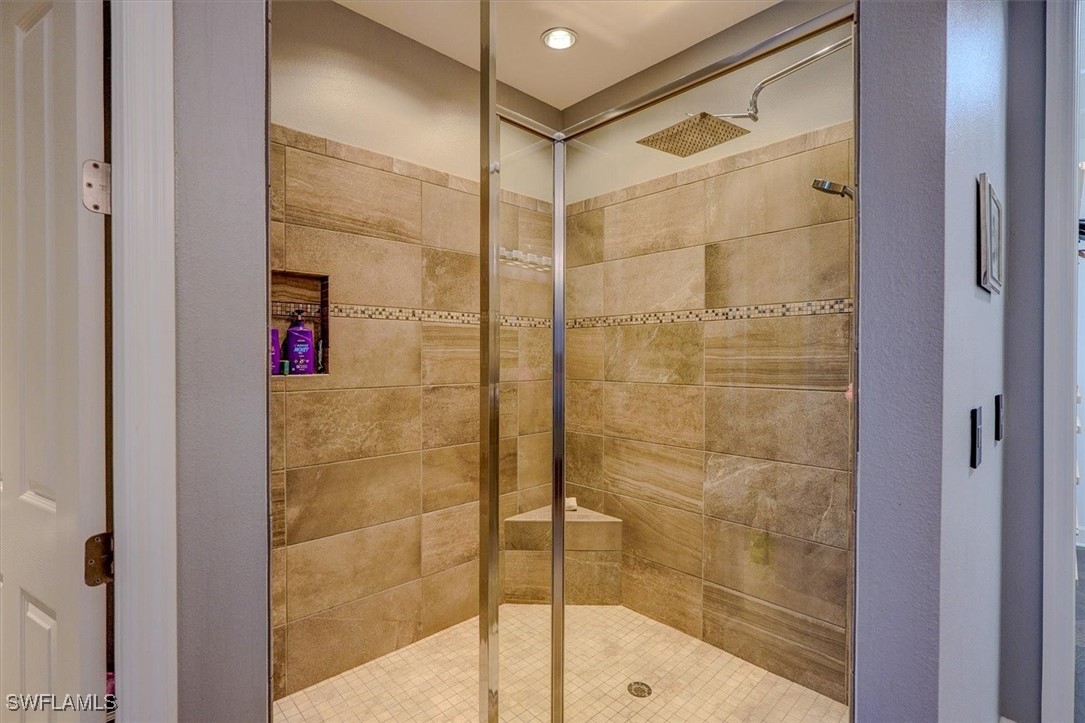
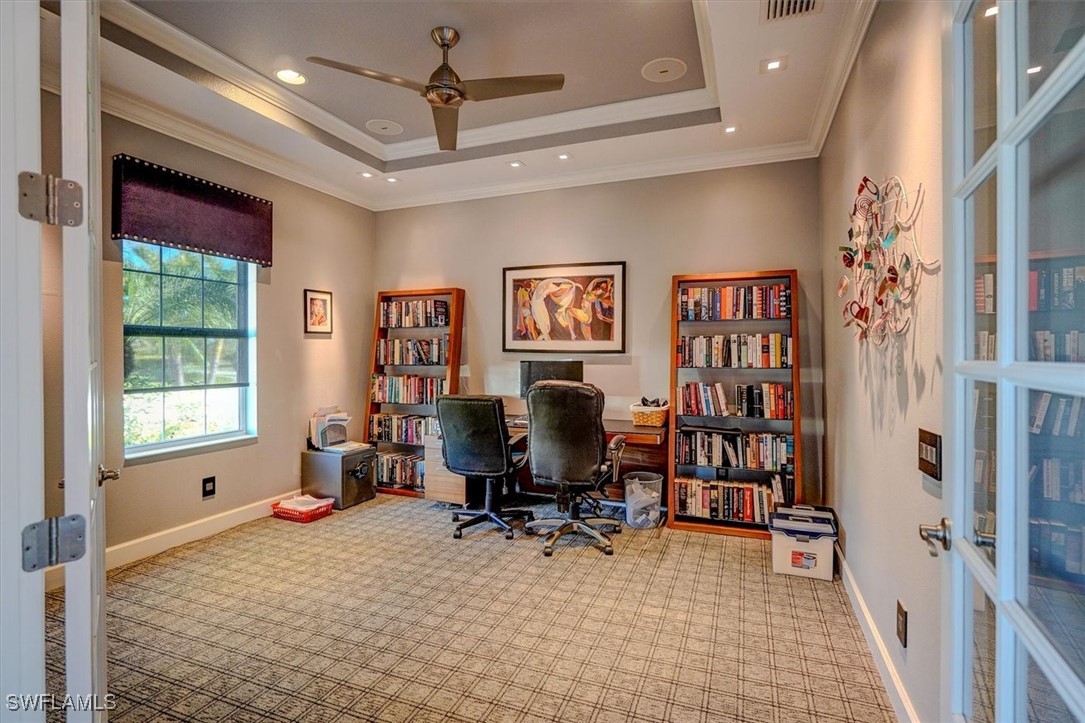
Property Description
MOTIVATED SELLER! Owner of this spacious luxury appointed SOLAR home says close the deal. Don’t pass this opportunity to purchase a move-in ready exceptionally well-maintained home. This state-of-the-art home is as beautiful as it is functional. From the moment you step through the front door, you'll be captivated by the custom-built craftsmanship and luxurious details that make this home truly one-of-a-kind. The home welcomes you with stunning 24" LEVEL 5 PORCELAIN TILE that flows seamlessly through the main living areas. The open floor plan is designed for both relaxation and entertainment, featuring a state-of-the-art SURROUND SOUND SYSTEM that immerses you in rich audio throughout the living room, dining room, family room, master bedroom, and even the lanai and pool area.The kitchen is a chef’s dream with a large island, WOLF GAS RANGE with infrared charbroiler, and a cutting-edge refrigerator with computer capabilities, including internet access and TV right on the door. Entire home boasts a FLASH HOT WATER HEATER SYSTEM for instant hot water. Custom drapes, electric blinds, and sophisticated lighting elevates the ambiance. Step outside to your private oasis—a custom-designed SALTWATER POOL with 7 mesmerizing water features and an OVERSIZED INFINITY SPA, all set against a backdrop of ITALIAN MARBLE TILE with a NON SLIP FINISH . This outdoor retreat is perfect for entertaining or unwinding in style. The GARAGE built with additional 5 FOOT DEPTH adding about 120 Sq ft and high end EPOXY flooring complete with high end workbench and cabinets included! Here's the kicker—this home is NOT in a flood zone, no flood insurance required, offering you peace of mind. Nestled on a serene lake teeming with tropical birds, including elegant white swans, this property is located in the prestigious, gated community of Sandoval in Cape Coral—a neighborhood known for its vibrant lifestyle and resort-style amenities. Living in Sandoval means embracing a lifestyle of leisure and activity. The community offers a RESORT-STYLE POOL, two dog parks, pickleball and tennis courts, volleyball, bocce ball, basketball, a fishing pier, and a clubhouse that hosts daily events. Stay active in the large community gym and yoga and dance studio. This home and community are the perfect blend of luxury, comfort, and fun. Here are just some of the additional features you will enjoy: * Stunning 24" high-gloss LEVEL 5 porcelain tile that flows seamlessly through the main living areas * Plush, high-grade carpet in the bedrooms and office adds a touch of quiet comfort * Whole house sound system that immerses you in rich audio throughout * 10 KW SOLAR system that runs the entire home * 50A, 240-volt electric car charging outlet * 30-amp RV Outlet * 50-amp Generator Connection * Whole house FLASH HOT WATER SYSTEM for instant hot water * UV air purification
Build Your Team
Quickly find investor-friendly professionals who can help you succeed in real estate investing at any stage of the investing journey.


Agents
Match with investor-friendly agents who can help you find, analyze, and close your next deal


Lenders
Get the best funding…find investor-friendly lenders who specialize in your deal strategy


Property Managers
Transition to passive investing. Find a trusted property management partnership that lasts.


Tax Pros & Accountants
Taxes and financial reporting made easy—find experts to create tax savings strategies, file taxes, and more
Location
Property Details
Parking
- Description: Attached, Driveway, Garage, Paved, TwoSpaces, ElectricVehicleChargingStations, GarageDoorOpener
- Details: Attached, Driveway, Garage, Paved, Electric Vehicle Charging Station(s), Garage Door Opener
- Garage Spaces: 2
- Spaces Total: 0
Bedroom Information
- # of Bedrooms: 3
Bathroom Information
- # of Baths (Full): 2
- # of Baths (Partial): 1
- # of Baths (Total): 3.0
Interior Features
- # of Stories: 1
Exterior Features
- Exterior Walls Materials: Stucco
- Roof Type: IRR/Cathedral
- Roof Material: Tile
- Pool: Yes
- Pool Community: Yes
- Solar Panels: Yes
HOA
- Has HOA: Yes
- HOA Fee: $1,064/quarterly
Land Information
- Land Use: Residential
- Land Use Subtype: Single Family Residential
Lot Information
- Parcel ID: 204423C300925.0160
- Lot Size: 0 sqft
Property Information
- Property Type: Single Family Residence
- Style: Ranch, One Story
- Year Built: 2015
Tax Information
- Annual Tax: $5,920
Utilities
- Heating: Active Solar, Central, Electric, Solar
- Cooling: Central Air, Ceiling Fan(s), Electric, Gas
Location
- County: Lee
Listing Details
Investment Summary
- Monthly Cash Flow
- -$973
- Cap Rate
- 4.5%
- Cash-on-Cash Return
- -7.3%
- Debt Coverage Ratio
- 0.73
- Internal Rate of Return (5 years)
- -3.1%
Cash Flow
Net Operating Income (NOI) minus mortgage payments.
Calculation:
NOI - Mortgage Payments
Cap Rate (Market Value)
Capitalization Rate is a rate of return that compares the yearly Net Operating Income (NOI) to the market value.
Calculation:
NOI / Market Value
Cash-on-Cash Return (CoC)
Annual Cash Flow / Cash Invested
Calculation:
Annual cash flow divided by initial cash invested.
Debt Coverage Ratio (DCR)
Net Operating Income (NOI) divided by total debt payments.
Calculation:
NOI / Total Debt Payments
Internal Rate of Return (IRR)
A metric for assessing profitability over time. IRR is the discount rate at which the net present value (NPV) of all future cash flows (positive and negative) from an investment equals zero — including both periodic cash flow (such as rent) and a projected sale at the end of the holding period. It represents the expected annualized return, accounting for income, expenses, and the recovery of capital through a future sale.
Purchase Details
Purchase PriceThe price paid for the property. Purchase price:
| $698,000 |
|---|---|
Amount FinancedThe amount of the purchase financed through a loan. Amount financed:
| -$558,400 |
Down paymentThe initial payment made towards the purchase. Down payment:
| $139,600 |
Closing CostsFees and expenses associated with purchasing a property, typically ranging from 2% to 5% of the home’s purchase price, paid at the end of a home purchase to cover services like lending, title transfer, and taxes. Closing costs:
| $20,940 |
Rehab CostsCosts incurred to repair or improve the property, including: roof, flooring, exterior siding, kitchen, exterior paint, bathrooms, etc. Rehab costs:
| $0 |
Initial Cash InvestedThe total initial cash invested in the property. Calculation:Down payment + Buying costs + Rehab costs Initial cash invested:
| $160,540 |
Square Feet (SQFT)The total square footage of the property. Square feet:
| 2,610 |
Cost Per Square FootCost per square foot of the property. Calculation:Purchase Price / Square Feet Cost per square foot:
| $267 |
Monthly Rent Per Square FootMonthly rent divided by the number of square feet. This ratio helps investors compare rental income efficiency across properties, markets, and unit sizes Calculation:Monthly Rent / Square Feet Monthly rent per square foot:
| $1.92 |
Financing Details
Loan AmountThe total sum of money borrowed from a lender to finance a property purchase. Calculation:Purchase Price - Down Payment
Loan amount:
| $558,400 |
|---|---|
Loan to Value Ratio (LTV)Loan amount divided by the market value of the property. Calculation:Loan Amount / Market Value
Loan to value ratio:
| 80.0% |
Loan TypeThe type of loan (e.g., fixed, adjustable).
Loan type:
| Amortizing |
TermThe loan repayment period in years.
Term:
| 30 years |
Interest RateThe percentage a lender charges on the borrowed amount of a loan, determining the cost of borrowing money.
Interest rate:
| 6.625% |
Principal & Interest (PI)The principal is the portion of the loan payment that reduces the loan balance. The interest is the lender's charge for borrowing money. Calculation:(P * r * (1 + r) ** n) / ((1 + r) ** n - 1) Where:
P = Loan amount (principal)
Principal & interest:
| $3,575 |
Property TaxesAnnual taxes levied by local governments on real estate properties. These taxes fund public services like schools, roads, and emergency services.
Property tax:
| $493 |
InsuranceThe costs for insurance coverage to protect against financial losses due to risks like fire, natural disasters, theft, liability, or tenant-related damages. Calculation:Assumes 7% of gross rental income, unless insurance rates are specified.
Insurance:
| $350 |
Private Mortgage Insurance (PMI)A fee that borrowers pay when they take out a conventional loan with a loan-to-value (LTV) ratio above 80%.
Private mortgage insurance (PMI):
| $0 |
Monthly PaymentThe fixed amount a borrower pays each month to repay a loan. It typically includes principal and interest (P&I) and may also cover property taxes, insurance, HOA fees, and PMI if escrowed. Monthly payment:
| $4,418 |
Operating Income
| % Rent | Monthly | Yearly | |
|---|---|---|---|
Gross RentThe total rental income received from tenants before deducting any expenses. Includes base rent, late fees, pet fees, parking fees, and other recurring charges.
Gross rent:
| $5,000 | $60,000 | |
Vacancy LossExpected loss of rent due to vacancies.
Vacancy loss:
(6%)
| 6% | -$300 | -$3,600 |
Operating IncomeGross rental income minus vacancy loss. Calculation:Gross rent - Vacancy loss
Operating income:
| $4,700 | $56,400 |
Operating Expenses
| % Rent | Monthly | Yearly | |
|---|---|---|---|
Property TaxesAnnual taxes levied by local governments on real estate properties. These taxes fund public services like schools, roads, and emergency services. | 10% | -$493 | -$5,920 |
InsuranceThe costs for insurance coverage to protect against financial losses due to risks like fire, natural disasters, theft, liability, or tenant-related damages. Calculation:Assumes 7% of gross rental income, unless insurance rates are specified. | 7% | -$350 | -$4,200 |
Property ManagementThe costs associated with hiring a property manager to handle the day-to-day operations of a rental property. Includes management fees, leasing fes, eviction fees, etc. Calculation:Assumes 8% of gross rental income. | 8% | -$400 | -$4,800 |
Repairs & MaintenanceOngoing costs for routine upkeep and minor fixes needed to keep a property in good working condition. Calculation:Assumes 5% of gross rental income. Varies by property age and condition. | 5% | -$250 | -$3,000 |
Capital ExpensesLarge, infrequent costs for major improvements or replacements, like a new roof, HVAC system, or appliances. Calculation:Assumes 5% of gross rental income. Varies by property age. | 5% | -$250 | -$3,000 |
HOA FeesRegular dues paid to a Homeowners Association for community maintenance, amenities, and management. Similar fees include: Condo Association Fees, Co-op Maintenance Fees, etc. | 7% | -$355 | -$4,260 |
Operating ExpensesRecurring costs required to maintain and manage a rental property, including property taxes, insurance, maintenance, repairs, utilities (if paid by the owner), property management fees, and other day-to-day expenses. Calculation:Insurance + Property Taxes + Property Management + Repairs & Maintenance + Capital Expenditures + HOA Fees | 42% | -$2,098 | -$25,180 |
Cash Flow
| Monthly | Yearly | |
|---|---|---|
Net Operating Income (NOI)The income generated from a property after deducting all operating expenses but before deducting mortgage payments, taxes, and capital expenditures. Calculation:Gross Operating Income - Operating Expenses
Net operating income:
| $2,602 | $31,224 |
Mortgage PaymentThe fixed amount a borrower pays each month to repay a loan. It typically includes principal and interest (P&I) and may also cover property taxes, insurance, HOA fees, and PMI if escrowed. | -$3,575 | -$42,900 |
Cash FlowNet Operating Income (NOI) minus mortgage payments. Calculation:NOI - Mortgage Payments | -$973 | -$11,676 |