
$699,000
Investment Summary
- Monthly Cash Flow
- -$1,300
- Cap Rate
- 3.9%
- Cash-on-Cash Return
- -9.7%
- Debt Coverage Ratio
- 0.64
- Internal Rate of Return (5 years)
- -5.4%
Cash Flow
Net Operating Income (NOI) minus mortgage payments.
Calculation:
NOI - Mortgage Payments
Cap Rate (Market Value)
Capitalization Rate is a rate of return that compares the yearly Net Operating Income (NOI) to the market value.
Calculation:
NOI / Market Value
Cash-on-Cash Return (CoC)
Annual Cash Flow / Cash Invested
Calculation:
Annual cash flow divided by initial cash invested.
Debt Coverage Ratio (DCR)
Net Operating Income (NOI) divided by total debt payments.
Calculation:
NOI / Total Debt Payments
Internal Rate of Return (IRR)
A metric for assessing profitability over time. IRR is the discount rate at which the net present value (NPV) of all future cash flows (positive and negative) from an investment equals zero — including both periodic cash flow (such as rent) and a projected sale at the end of the holding period. It represents the expected annualized return, accounting for income, expenses, and the recovery of capital through a future sale.
Property Description
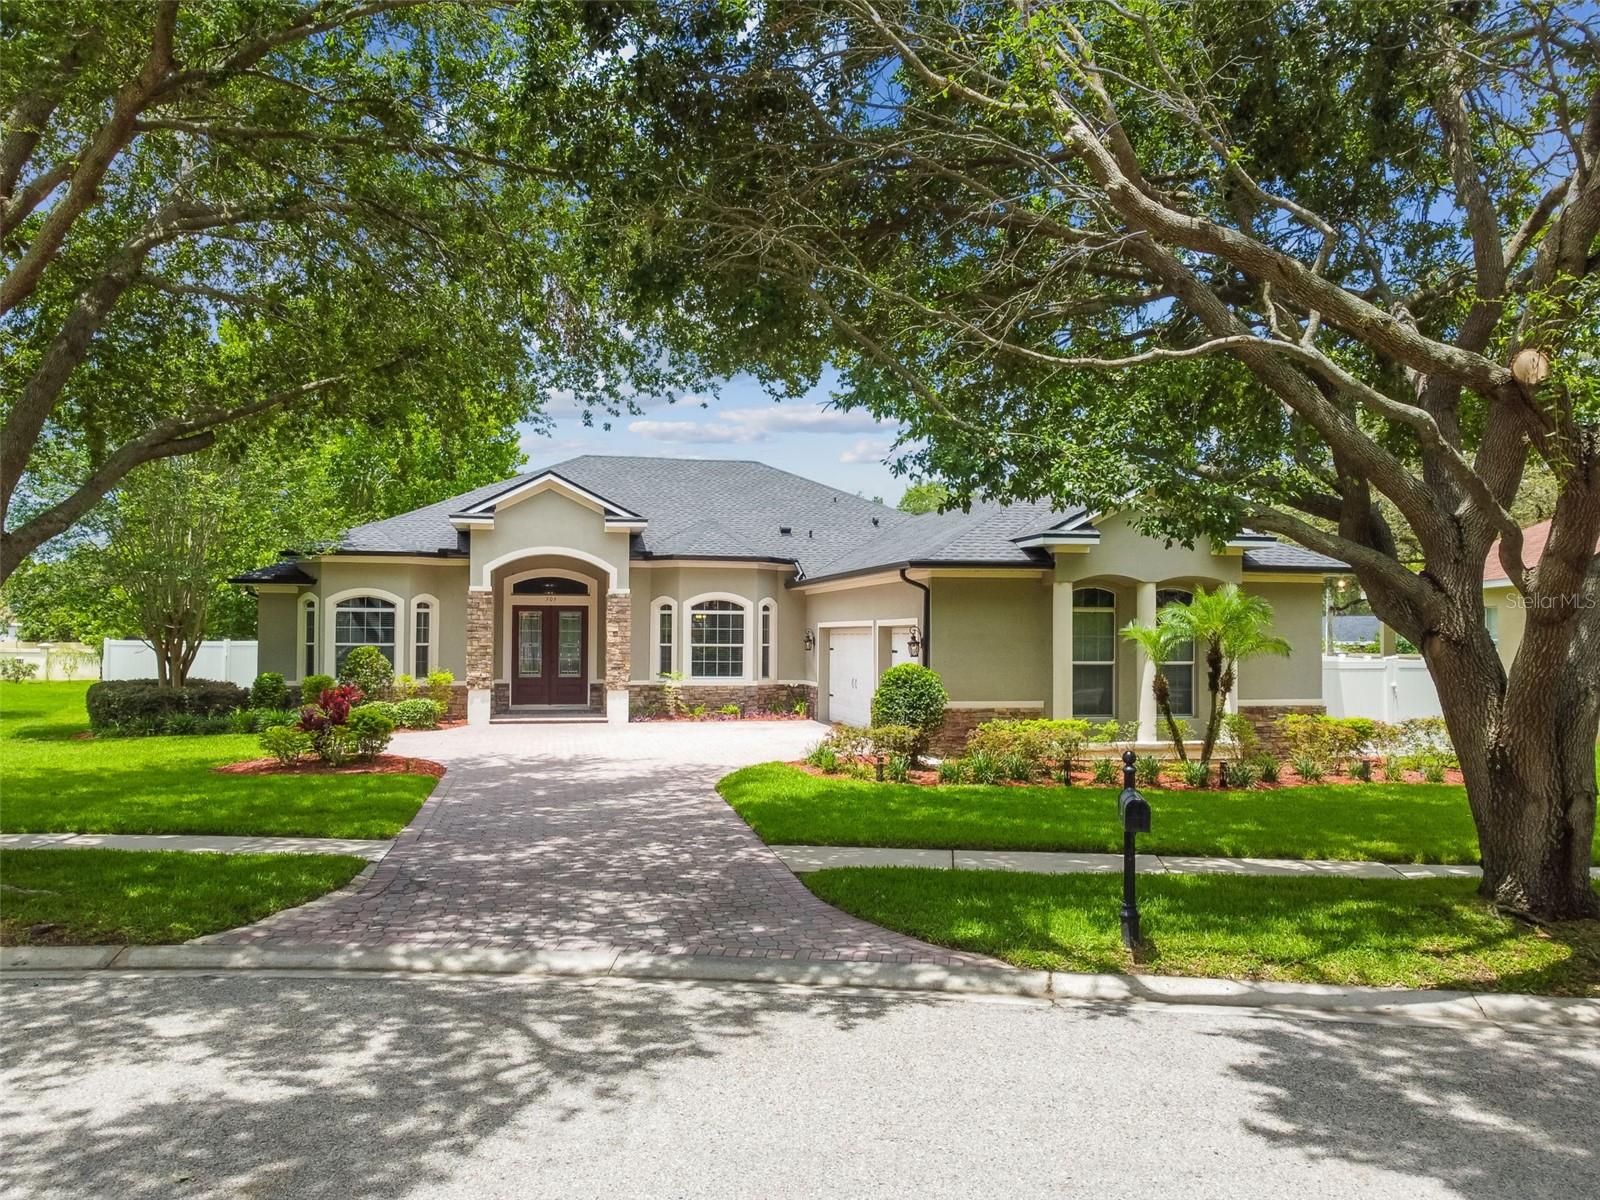
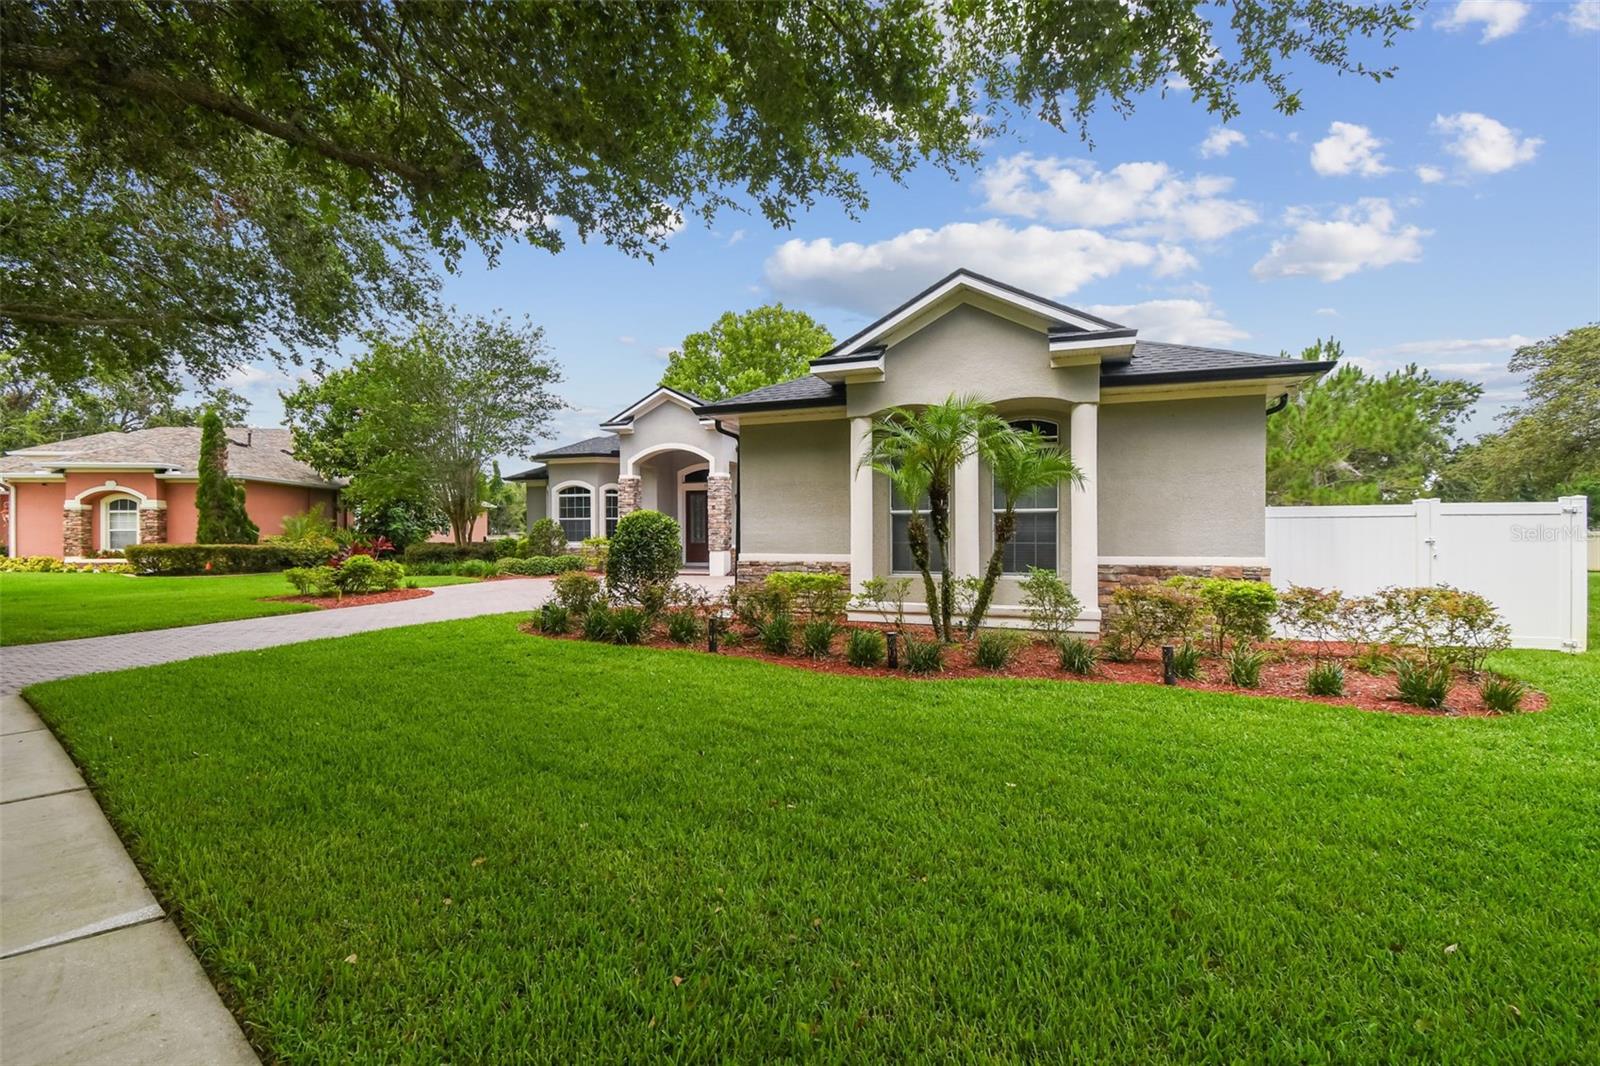
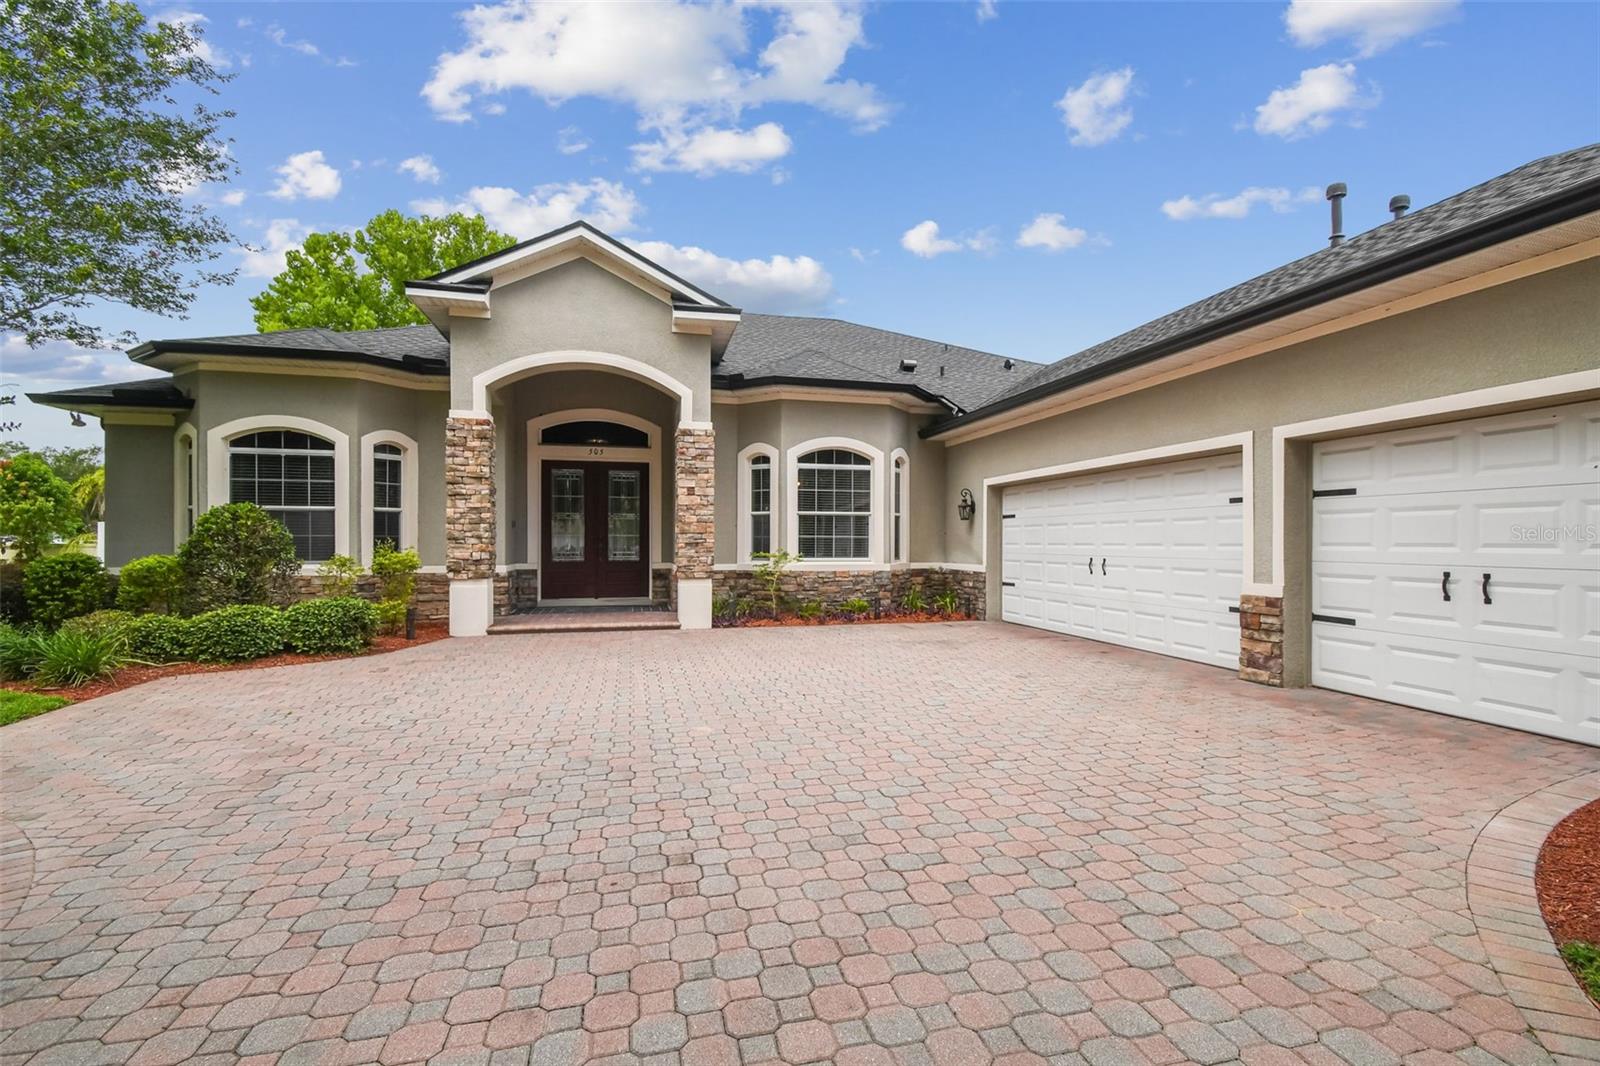
Under contract-accepting backup offers. PRICE IMPROVEMENT! Welcome to the Vineyards where quality and comfort align with ease in this highly sought after private gated community filled with 31 beautifully crafted, custom built executive style homes, each with their own unique look and characteristics. This well-designed, split bedroom layout POOL home sits on a generous sized lot and showcases beautiful stone accents spanning the front exterior, 4-bedrooms, 3-bathrooms, and a multi-use BONUS ROOM containing a custom, built-in wet bar. These desirable features are complimented by numerous updates and upgrades by the current owners including a NEW ROOF and GUTTERS, vinyl fenced back yard, upgraded kitchen with quartz countertops and refreshed cabinet color, interior paint, wood-look porcelain tile flooring installed throughout the home, and a custom-built great room entertainment wall complete with shiplap panels, custom cabinets, shelving, and an electric remote control fireplace with stone surround! The brick paver driveway leads up to the front porch with decorative beveled-glass double doors, and adjacent to that is the massive 3-car courtyard entry garage which also includes overhead storage racks inside and a 240-Volt EV CAR CHARGING Outlet! Upon entering the home you’ll immediately be welcomed by the open concept layout with high ceilings and crown molding throughout the main areas of the home including the primary bedroom. The formal dining room exhibits beautiful wainscot paneling to accent the wall. The large kitchen has a walk-in pantry, stainless appliances, gas cooktop, and overlooks the entire great room. The breakfast nook has a great view of the back patio and ample natural light. The triple sliding glass doors open to provide outdoor access to the covered patio with brick pavers and pool with a screened-in lanai. The rear patio is conveniently already piped for gas and water, which provides creative outdoor kitchen options for the next owner! The laundry room has cabinets and a closet for additional storage, a utility sink, front-loading washer & dryer, and a door providing direct access to the garage. The primary bathroom features a dual vanity, a garden tub and a separate walk-in shower. No CDD fees and low HOA fees. No neighbors to the immediate rear of the property. The lawn irrigation throughout the community is supplied by a well system which helps with the water bill too! The location is ideal and close to various amenities such as restaurants, shopping, schools, and hospitals along with numerous highways and toll roads including Hwy 60, I-75 and the Selmon Expressway. For your air travel needs, the TPA airport is located within about 22 miles. For fun in the sun & sand, some of the top ranked beaches like St. Pete Beach are approximately 40 miles. Don’t miss the opportunity to make this your next home, book your showing today to see this beauty in person!
Build Your Team
Quickly find investor-friendly professionals who can help you succeed in real estate investing at any stage of the investing journey.


Agents
Match with investor-friendly agents who can help you find, analyze, and close your next deal


Lenders
Get the best funding…find investor-friendly lenders who specialize in your deal strategy


Property Managers
Transition to passive investing. Find a trusted property management partnership that lasts.


Tax Pros & Accountants
Taxes and financial reporting made easy—find experts to create tax savings strategies, file taxes, and more
Location
Property Details
Parking
- Description: Garage Door Opener, Off Street, Oversized
- Details: Driveway, Garage Door Opener, Off Street, Oversized, Attached
- Garage Spaces: 3
- Spaces Total: 0
Bedroom Information
- # of Bedrooms: 4
Bathroom Information
- # of Baths (Full): 3
- # of Baths (Total): 3.0
Interior Features
- # of Rooms: 7
- # of Stories: 1
- Fireplace: Yes
Exterior Features
- Exterior Walls Materials: Stucco
- Foundation: Slab
- Roof Type: Gable or Hip
- Roof Material: Shingle
- Pool: Yes
HOA
- Has HOA: Yes
- Association: Brooke Brandon
- HOA Fee: $455/quarterly
Land Information
- Land Use: Residential
- Land Use Subtype: Single Family Residential
Lot Information
- Parcel ID: U34292074F000001000200
- Lot Size: 13464 sqft
Property Information
- Property Type: Single Family Residence
- Year Built: 2007
Tax Information
- Annual Tax: $610
Utilities
- Water & Sewer: Public
- Heating: Central, Natural Gas
- Cooling: Central Air
Location
- County: Hillsborough
Listing Details
Investment Summary
- Monthly Cash Flow
- -$1,300
- Cap Rate
- 3.9%
- Cash-on-Cash Return
- -9.7%
- Debt Coverage Ratio
- 0.64
- Internal Rate of Return (5 years)
- -5.4%
Cash Flow
Net Operating Income (NOI) minus mortgage payments.
Calculation:
NOI - Mortgage Payments
Cap Rate (Market Value)
Capitalization Rate is a rate of return that compares the yearly Net Operating Income (NOI) to the market value.
Calculation:
NOI / Market Value
Cash-on-Cash Return (CoC)
Annual Cash Flow / Cash Invested
Calculation:
Annual cash flow divided by initial cash invested.
Debt Coverage Ratio (DCR)
Net Operating Income (NOI) divided by total debt payments.
Calculation:
NOI / Total Debt Payments
Internal Rate of Return (IRR)
A metric for assessing profitability over time. IRR is the discount rate at which the net present value (NPV) of all future cash flows (positive and negative) from an investment equals zero — including both periodic cash flow (such as rent) and a projected sale at the end of the holding period. It represents the expected annualized return, accounting for income, expenses, and the recovery of capital through a future sale.
Purchase Details
Purchase PriceThe price paid for the property. Purchase price:
| $699,000 |
|---|---|
Amount FinancedThe amount of the purchase financed through a loan. Amount financed:
| -$559,200 |
Down paymentThe initial payment made towards the purchase. Down payment:
| $139,800 |
Closing CostsFees and expenses associated with purchasing a property, typically ranging from 2% to 5% of the home’s purchase price, paid at the end of a home purchase to cover services like lending, title transfer, and taxes. Closing costs:
| $20,970 |
Rehab CostsCosts incurred to repair or improve the property, including: roof, flooring, exterior siding, kitchen, exterior paint, bathrooms, etc. Rehab costs:
| $0 |
Initial Cash InvestedThe total initial cash invested in the property. Calculation:Down payment + Buying costs + Rehab costs Initial cash invested:
| $160,770 |
Square Feet (SQFT)The total square footage of the property. Square feet:
| 2,810 |
Cost Per Square FootCost per square foot of the property. Calculation:Purchase Price / Square Feet Cost per square foot:
| $249 |
Monthly Rent Per Square FootMonthly rent divided by the number of square feet. This ratio helps investors compare rental income efficiency across properties, markets, and unit sizes Calculation:Monthly Rent / Square Feet Monthly rent per square foot:
| $1.28 |
Financing Details
Loan AmountThe total sum of money borrowed from a lender to finance a property purchase. Calculation:Purchase Price - Down Payment
Loan amount:
| $559,200 |
|---|---|
Loan to Value Ratio (LTV)Loan amount divided by the market value of the property. Calculation:Loan Amount / Market Value
Loan to value ratio:
| 80.0% |
Loan TypeThe type of loan (e.g., fixed, adjustable).
Loan type:
| Amortizing |
TermThe loan repayment period in years.
Term:
| 30 years |
Interest RateThe percentage a lender charges on the borrowed amount of a loan, determining the cost of borrowing money.
Interest rate:
| 6.625% |
Principal & Interest (PI)The principal is the portion of the loan payment that reduces the loan balance. The interest is the lender's charge for borrowing money. Calculation:(P * r * (1 + r) ** n) / ((1 + r) ** n - 1) Where:
P = Loan amount (principal)
Principal & interest:
| $3,581 |
Property TaxesAnnual taxes levied by local governments on real estate properties. These taxes fund public services like schools, roads, and emergency services.
Property tax:
| $51 |
InsuranceThe costs for insurance coverage to protect against financial losses due to risks like fire, natural disasters, theft, liability, or tenant-related damages. Calculation:Assumes 7% of gross rental income, unless insurance rates are specified.
Insurance:
| $252 |
Private Mortgage Insurance (PMI)A fee that borrowers pay when they take out a conventional loan with a loan-to-value (LTV) ratio above 80%.
Private mortgage insurance (PMI):
| $0 |
Monthly PaymentThe fixed amount a borrower pays each month to repay a loan. It typically includes principal and interest (P&I) and may also cover property taxes, insurance, HOA fees, and PMI if escrowed. Monthly payment:
| $3,884 |
Operating Income
| % Rent | Monthly | Yearly | |
|---|---|---|---|
Gross RentThe total rental income received from tenants before deducting any expenses. Includes base rent, late fees, pet fees, parking fees, and other recurring charges.
Gross rent:
| $3,600 | $43,200 | |
Vacancy LossExpected loss of rent due to vacancies.
Vacancy loss:
(6%)
| 6% | -$216 | -$2,592 |
Operating IncomeGross rental income minus vacancy loss. Calculation:Gross rent - Vacancy loss
Operating income:
| $3,384 | $40,608 |
Operating Expenses
| % Rent | Monthly | Yearly | |
|---|---|---|---|
Property TaxesAnnual taxes levied by local governments on real estate properties. These taxes fund public services like schools, roads, and emergency services. | 1% | -$51 | -$610 |
InsuranceThe costs for insurance coverage to protect against financial losses due to risks like fire, natural disasters, theft, liability, or tenant-related damages. Calculation:Assumes 7% of gross rental income, unless insurance rates are specified. | 7% | -$252 | -$3,024 |
Property ManagementThe costs associated with hiring a property manager to handle the day-to-day operations of a rental property. Includes management fees, leasing fes, eviction fees, etc. Calculation:Assumes 8% of gross rental income. | 8% | -$288 | -$3,456 |
Repairs & MaintenanceOngoing costs for routine upkeep and minor fixes needed to keep a property in good working condition. Calculation:Assumes 5% of gross rental income. Varies by property age and condition. | 5% | -$180 | -$2,160 |
Capital ExpensesLarge, infrequent costs for major improvements or replacements, like a new roof, HVAC system, or appliances. Calculation:Assumes 5% of gross rental income. Varies by property age. | 5% | -$180 | -$2,160 |
HOA FeesRegular dues paid to a Homeowners Association for community maintenance, amenities, and management. Similar fees include: Condo Association Fees, Co-op Maintenance Fees, etc. | 4% | -$152 | -$1,824 |
Operating ExpensesRecurring costs required to maintain and manage a rental property, including property taxes, insurance, maintenance, repairs, utilities (if paid by the owner), property management fees, and other day-to-day expenses. Calculation:Insurance + Property Taxes + Property Management + Repairs & Maintenance + Capital Expenditures + HOA Fees | 31% | -$1,103 | -$13,234 |
Cash Flow
| Monthly | Yearly | |
|---|---|---|
Net Operating Income (NOI)The income generated from a property after deducting all operating expenses but before deducting mortgage payments, taxes, and capital expenditures. Calculation:Gross Operating Income - Operating Expenses
Net operating income:
| $2,281 | $27,372 |
Mortgage PaymentThe fixed amount a borrower pays each month to repay a loan. It typically includes principal and interest (P&I) and may also cover property taxes, insurance, HOA fees, and PMI if escrowed. | -$3,581 | -$42,972 |
Cash FlowNet Operating Income (NOI) minus mortgage payments. Calculation:NOI - Mortgage Payments | $1,300 | $15,600 |